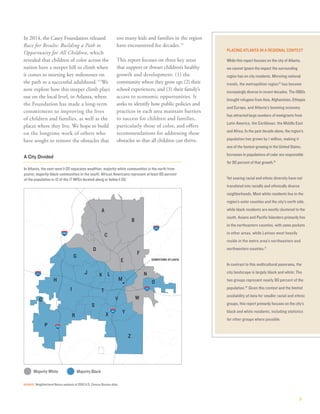
SlideShare a Scribd company logo
1 of 24
Download to read offline
3
CHANGING THE ODDS
the race for results in atlanta
4
The Annie E. Casey Foundation is a private
philanthropy that creates a brighter future for
the nation’s children by developing solutions
to strengthen families, build paths to economic
opportunity and transform struggling
communities into safer and healthier places to
live, work and grow. For more information, visit
www.aecf.org.
© 2015 The Annie E. Casey Foundation
THE ANNIE E. CASEY FOUNDATION
2
4
6
10
14
18
18
19
Introduction				
Community
Education
Economic Opportunity
Recommendations
Conclusion
Acknowledgments
Endnotes
CONTENTS
2
INTRODUCTION
The city is a magnet for professionals,
particularly people of color. It also has
a rich legacy of black and white civic and
community leaders working tirelessly
to stand apart from other southern
cities when it came to the racial tension
and unrest that marked the 1960s,
positioning Atlanta as the “city too busy
to hate.”1
Then-Mayor Ivan Allen was
the only major southern leader to
publicly endorse national civil rights
legislation, and Maynard Jackson, the
city’s first African-American mayor,
established groundbreaking affirmative
action policies and kept Atlanta’s
international airport on the south side,
bringing thousands of jobs to that part
of the city to balance business expansion
to the north.
Today, metro Atlanta serves as the
headquarters for nearly 30 Fortune
1000 companies that collectively
generated almost $360 billion in
revenues in 2014 alone, contributing
to a booming economy that is among
the largest in the country.2
But while
the city has much to celebrate, its
proud history and thriving economy
mask deep and enduring challenges
that make it one of the most difficult
places in the nation for children in low-
income families to climb out of poverty.3
This is even truer for the city’s children
of color, whose families are more likely
to struggle to make ends meet and
reside in neighborhoods contending
with blight, limited resources and few
opportunities to realize their dreams for
a better life.
Race has undeniably shaped the city’s
landscape, giving rise to two very
different Atlantas that underscore
the fact that the place where children
grow up affects their opportunities
in life. This report examines the city
through its 25 neighborhood planning
units (NPUs)4
— the resident advisory
councils that make zoning and other
planning recommendations — to
explore how race and community of
residence erect persistent barriers that
keep kids from reaching their potential.
They also keep the city from fully
harnessing its economic power: Metro
Atlanta’s economy stands to gain an
additional $78.6 million annually by
promoting racial equity, according to
a recent study.5
The importance of community is
evident throughout metro Atlanta,
but especially in the city. While the city
has become somewhat more diverse in
recent years, it remains divided, literally
and figuratively. The east-west Interstate
20 separates wealthier, majority-white
communities in the north from poorer,
majority-black ones in the south.6
African Americans represent at least
80 percent of the population in 12 of
the 17 NPUs located along or below
I-20, while more than 60 percent of
the six northern NPUs’ populations
are white.7
NPUs in northern Atlanta
have the highest enrollment in early
education programs and the highest-
performing elementary schools, most
of the city’s high-income workers
and better access to the growing job
market on the north side and in the
northern suburbs. By contrast, most of
Atlanta’s low-income workers live in the
southern NPUs, and few have access to
reliable transportation that would allow
them to tap into regional employment
opportunities that lie beyond the reach
of public transit.8
Even as metro Atlanta’s economy thrives,
the city recently ranked first for income
inequality,9
and one in four of its residents
lives in poverty.10
In addition, low- and
moderate-income workers and families
have limited housing options.11
To advance
the local economy and ensure all children
have the chance to participate in and
contribute to it, Atlanta must address the
barriers to opportunity that face many in
the city and region.
Examining Barriers to
Opportunity at the Local Level
For more than a decade, the Annie E.
Casey Foundation has worked with
a broad range of partners to increase
educational and economic opportunities
for children and families in several
southwest Atlanta neighborhoods,with
the goal of ensuring all kids, regardless
of race, ethnicity or community of
residence, have the chance to realize
their full potential.12
Yet race remains
a major predictor of a child’s trajectory
in life — a reality reinforced by nearly
every measure of child and family well-
being highlighted in this report.
Atlanta is the birthplace of the Rev. Martin Luther King Jr. and the
American civil rights movement and home to some of the country’s
most prestigious historically black colleges and universities.
3
PLACING ATLANTA IN A REGIONAL CONTEXT
While this report focuses on the city of Atlanta,
we cannot ignore the impact the surrounding
region has on city residents. Mirroring national
trends, the metropolitan region15
has become
increasingly diverse in recent decades. The 1980s
brought refugees from Asia, Afghanistan, Ethiopia
and Europe, and Atlanta’s booming economy
has attracted large numbers of immigrants from
Latin America, the Caribbean, the Middle East
and Africa. In the past decade alone, the region’s
population has grown by 1 million, making it
one of the fastest-growing in the United States.
Increases in populations of color are responsible
for 90 percent of that growth.16
Yet soaring racial and ethnic diversity have not
translated into racially and ethnically diverse
neighborhoods. Most white residents live in the
region’s outer counties and the city’s north side,
while black residents are mostly clustered to the
south. Asians and Pacific Islanders primarily live
in the northeastern counties, with some pockets
in other areas, while Latinos most heavily
reside in the metro area’s northeastern and
northwestern counties.17
In contrast to this multicultural panorama, the
city landscape is largely black and white: The
two groups represent nearly 90 percent of the
population.18
Given this context and the limited
availability of data for smaller racial and ethnic
groups, this report primarily focuses on the city’s
black and white residents, including statistics
for other groups where possible.
In 2014, the Casey Foundation released
Race for Results: Building a Path to
Opportunity for All Children, which
revealed that children of color across the
nation have a steeper hill to climb when
it comes to meeting key milestones on
the path to a successful adulthood.13
We
now explore how this steeper climb plays
out on the local level, in Atlanta, where
the Foundation has made a long-term
commitment to improving the lives
of children and families, as well as the
places where they live. We hope to build
on the longtime work of others who
have sought to remove the obstacles that
too many kids and families in the region
have encountered for decades.14
This report focuses on three key areas
that support or thwart children’s healthy
growth and development: (1) the
community where they grow up; (2) their
school experiences; and (3) their family’s
access to economic opportunities. It
seeks to identify how public policies and
practices in each area maintain barriers
to success for children and families,
particularly those of color, and offers
recommendations for addressing these
obstacles so that all children can thrive.
SOURCE: Neighborhood Nexus analysis of 2010 U.S. Census Bureau data.
A City Divided
DOWNTOWN ATLANTA
I
Z
A
B
P
D
H
C
J
F
R
G
X
S
W
Y
O
N
V
T
K L
Q
E
M
285
285
75
85
20
85
20
 Majority Black Majority White
In Atlanta, the east-west I-20 separates wealthier, majority-white communities in the north from
poorer, majority-black communities in the south. African Americans represent at least 80 percent
of the population in 12 of the 17 NPUs located along or below I-20.
4
COMMUNITY
Children’s success is strongly tied to their family’s stability
and well-being, which, in turn, is affected by where they
live.19
Children living in high-poverty areas — like many of the
neighborhoods on Atlanta’s south side — frequently lack access
to critical resources such as high-performing schools, quality
medical care and safe outdoor spaces.
Regardless of income, families living
in high-poverty communities are more
likely to have limited healthy food
options and pay more for housing than
those living in more affluent areas.20
These challenges often trap children
in a cycle of poverty.
In Atlanta, the relationship between place
and race is glaring. Ninety-four percent
of white children live in low-poverty
communities, compared to 20 percent of
black children and 57 percent of Latino
children. The neighborhood planning
units underscore this reality, with most
high-poverty areas concentrated in the
predominantly black NPUs located along
or below I-20. Only five of the 17 NPUs
along or south of I-20 are considered
low-poverty areas, where the poverty rate
is less than 20 percent, and in four of the
south-side NPUs, more than 40 percent
of residents live below the federal poverty
line, or $23,624 for a family of four.21
Factors Shaping Atlanta’s
Community Landscape
A history of segregation and recent
redevelopment. Racially segregated public
housing, zoning ordinances and other
public- and private-sector practices
throughout the last century set the stage
for many of the challenges that pervade
a number of Atlanta neighborhoods
today. During the wave of urban renewal
programs in the mid-20th century, the
city used federal funds to demolish
homes in lower-income communities
to allow for new interstate highways,
a civic center and what is now Turner
Field. This weakened the fabric of the
majority-black neighborhoods that bore
the brunt of the demolition and left the
tens of thousands who were displaced —
also mostly black — with few housing
options because of segregation policies
and delays in housing development in
those communities.22
Demolition continued in the 1990s
and 2000s, as the city used the federal
HOPE VI program to redevelop public
housing complexes. Although the mixed-
income developments that replaced
them brought more economic diversity
to some high-poverty neighborhoods,
they had fewer affordable units for
lower-income families. Even with these
new developments, poverty remains
concentrated on the city’s south side,
and most relocated families ended up in
low-income neighborhoods contending
CHILDREN WHO LIVE IN LOW-POVERTY AREAS
(POVERTY < 20%)
ATLANTA
AFRICAN AMERICAN
ASIAN AND PACIFIC ISLANDER
LATINO
WHITE
20%
44%
57%
94%
71%
SOURCE: Neighborhood Nexus analysis of the U.S. Census Bureau’s
2008-2012 American Community Survey.
SOURCE: Neighborhood Nexus analysis of 2010 U.S. Census Bureau data.
5
Vacant Housing in Atlanta by Neighborhood Planning Unit, 2010
with challenges such as high foreclosure
rates and violent crime.23
The cost of housing and declining home
values. Many south and central Atlanta
families spend more than 30 percent of
their income on housing, placing them
in financially precarious positions as
they struggle to cover other expenses
such as food, clothing and child care.24
Most of the households in 11 of the
17 NPUs along or south of I-20
find themselves in this predicament.
In NPU-L, just west of downtown,
this is true for more than 70 percent
of households. In the six northern
majority-white NPUs, by contrast, less
than 40 percent of households spend
more than 30 percent of their income
on housing.25
The dramatic drop in metro Atlanta
home values caused by the Great
Recession has further undermined
family and neighborhood stability
— particularly for African-American
residents, who saw a disproportionate
decrease in the value of their homes.26
Since the recession, home values in
northern Atlanta neighborhoods have
largely rebounded, matching national
trends. The same has not held true on
the city’s south side, where many home
mortgages exceed property values.
These losses create a domino effect, as
they turn what is normally considered
an asset — homeownership — into
a liability.27
With a majority of households in south
Atlanta struggling to make ends meet
and neighborhood stability weakened
by the housing market crash, the ability
of black families to build assets and
wealth has been largely compromised.
DOWNTOWN ATLANTA
I
Z
A
B
P
D
H
C
J
F
R
G
X
S
W
Y
O
N
V
T
K L
Q
E
M
285
285
75
85
20
85
20
 18 to < 32% 11 to < 18% 5 to < 11% 2 to < 5% 0 to < 2%
6
EDUCATION
The equation is simple: The more education you have, the more
you earn — and the more likely you are to be able to get and
keep a job that pays enough to support a family.28
In Atlanta,
however, there is a notable difference in the quality of educational
opportunities to which children have access, starting from their
earliest years and continuing through high school.
Early childhood education. Research
underscores the importance of the early
years in a child’s life in laying a solid
foundation for success in school and
beyond: Children in high-quality early
education programs are more likely
to graduate from high school.29
Such
programs have an even greater influence
on the growth and development of
children in low-income families.30
Yet preschool enrollment is uneven
across Atlanta, with lower enrollment
on the south side, where more black
children and kids in low-income
families live.31
For example, more
than 80 percent of 3- and 4-year-old
children in majority-white NPU-A
and NPU-N are enrolled in an early
education program, compared with
only about 25 percent of children in
majority-black NPU-J.
The reasons for these differences in
enrollment are unclear and require
additional research. The statewide
Georgia Pre-K program covers the
cost of prekindergarten for 4-year-olds
in public schools and private child
care centers, but its open-enrollment
process and voluntary nature can
limit the available slots for children in
communities where demand is high
and affordable alternatives are few or
nonexistent. In addition, almost half
of the city’s Georgia Pre-K programs
do not accept the public subsidies
that help low-income families pay for
child care for younger children not yet
eligible for Georgia Pre-K, which could
force them to pursue other avenues for
their care or thwart their employment
opportunities.32
A lack of access to
quality child care might also contribute
to these differences; one study found
that two-thirds of Georgia’s infants and
toddlers are in child care centers of
“unacceptably low quality.”33
Reading proficiency. An early mastery of
reading is critical to a child’s academic
success, providing a solid base for
learning more complex concepts in
higher grades.34
Fourth-graders who
struggle with reading are four times
more likely to drop out.35
Among Atlanta Public Schools36
students, the percentage of white third-
graders (88 percent) who exceeded the
state’s reading standards — a stronger
measure of proficiency — was more
HIGH SCHOOL STUDENTS GRADUATING ON TIME:
ATLANTA PUBLIC SCHOOLS, 2014
41+59A
59%
43+57A
57%
ATLANTA PUBLIC SCHOOLS
AFRICAN AMERICAN
6+94A
94%
ASIAN AND
PACIFIC ISLANDER
47+53A
53%
16+84A
84%
LATINO WHITE
SOURCE: Atlanta Public Schools analysis of 2013–2014 school year data.
7
Percentage of Children in Nursery School or Preschool, 2009-2013
DOWNTOWN ATLANTA
I
Z
A
B
P
D
H
C
J
F
R
G
X
S
W
Y
O
N
V
T
K L
Q
E
M
285
285
75
85
20
85
20
 71 to < 90%
 58 to < 71%
 52 to < 58%
 37 to < 52%
 25 to < 37%
THIRD-GRADERS WHO MEET OR EXCEED STANDARDS FOR READING, 2014
ATLANTA PUBLIC
SCHOOLS
AFRICAN AMERICAN
ASIAN
LATINO
WHITE
0%        20%        40%         60%        80% 
 Meets    
 Exceeds
EIGHTH-GRADERS WHO MEET OR EXCEED STANDARDS FOR MATH, 2014
ATLANTA PUBLIC
SCHOOLS
AFRICAN AMERICAN
ASIAN
LATINO
WHITE
0%        20%        40%         60%        80% 
 Meets    
 Exceeds
SOURCE: Neighborhood Nexus analysis of the U.S. Census Bureau’s 2009-2013
American Community Survey.
SOURCE: Governor’s Office of Student Achievement, K-12 Public Schools Report Card data for the 2013-2014 school year.
50%
39%
61%
24%
15%
79%
59%
35%
12%
88%
53%
24%
57%
16%
18%
82%
53%
28%
26%
71%
8
than three times that of their black peers
(24 percent) and more than twice that
of Latinos (35 percent). By contrast,
79 percent of Asian students exceeded
the standards.
High school graduation. Far too few
children in Atlanta are graduating from
high school, a requirement even for most
low-wage jobs.37
Although the graduation
rate for Atlanta Public Schools has risen
to almost 60 percent in recent years, it
still lags behind the state and nearly all
large U.S. school districts.38
A closer examination of this bleak
picture, however, reveals an even starker
reality for students of color. The 2014
graduation rate for white and Asian
students was 84 percent and 94 percent,
respectively, compared with 57 percent
for black students and 53 percent for
Latinos.39
Black and Latino students
are more than three times more likely
to drop out of school.40
Comparisons
between Atlanta students and their peers
across the state further illuminate the
distinct barriers facing African-American
children: While the school district’s
white students graduate at a higher rate
than their counterparts across the state,
its African-American students lag behind
their peers outside the city.
Beyond increasing opportunities for
the students themselves, improving
the graduation rate for students of color
— and, therefore, the city as a whole
— would give a significant boost to
the local economy in the form of more
jobs, income and tax revenues.41
Factors Shaping Atlanta’s
Educational Landscape
A history of discrimination. Segregated
school systems were based on the legal
notion of “separate but equal.” The
school systems established for white and
black children in Atlanta and elsewhere,
however, were far from equal. Atlanta
did not open a high school for black
students until 1924, more than 50 years
after opening high schools for white
students and after many other southern
cities had already done so.42
Per-pupil
expenditures in mid-century were nearly
three times higher for white students.43
These funding differences increased in
the 1960s, as the school board refused
to reallocate resources to majority-black
schools to account for the demographic
shifts caused by more than 60,000 white
students leaving the district.44
This
uneven investment had a measurable
effect on student learning. A 1968 study,
for example, found that black fourth-
graders lagged one year behind their
white peers, while black eighth-graders
lagged four years behind.45
Geography. Student achievement patterns
correspond with the city’s north-south
divide. Eleven of the district’s 14 top-
performing elementary schools in third-
grade reading are in northern Atlanta.
The three others are charter schools that
draw students from across the city.46
Student attendance. To succeed in school,
children must actually attend. Missing
just six days of school in a year for any
reason affects student achievement and
is a stronger predictor of not graduating
from high school than standardized test
scores.47
Housing instability and health
conditions such as asthma, which lower-
income families in particular tend to
experience, often compromise student
attendance.48
Only half of the school
system’s black students missed fewer than
six days in the 2013-2014 school year,
compared with nearly 65 percent of their
white peers. Black students also were
nearly five times more likely to miss more
than 15 days during the school year, well
over the district’s threshold for truancy.49
Improving the graduation
rate for students of color
and the city as a whole
would give a significant
boost to the local economy
in the form of more jobs,
income and tax revenues.
9
AFRICAN AMERICAN ASIAN AND
PACIFIC ISLANDER
LATINO WHITE
15%
1%
5%
1%
25
20
15
10
5
0
ATLANTA PUBLIC SCHOOLS: OUT-OF-SCHOOL SUSPENSIONS BY RACE, 2014
Disciplinary issues resulting in out-of-
school suspensions contribute to these
absences. In 2011, for example, African
Americans represented 80 percent of
district students but 94 percent of out-
of-school suspensions and 97 percent
of expulsions.50
When examined by
gender, the numbers are staggering. In
2014, the suspension rate for black male
students (19 percent) was more than 13
times that of their white counterparts
and more than twice the rate for their
Latino peers. Though the rate among
black female students was lower, at 11
percent, it far exceeds that for Latino
and white female students (3 percent
and 1 percent, respectively).51
Having access to quality learning
experiences and opportunities from
preschool through high school is an
essential ingredient to student success —
and one clearly missing for many young
Atlantans of color, who struggle to
reach key educational milestones. This
ultimately jeopardizes their chances of
graduating and for success beyond high
school, particularly as they seek to enter
the local workforce.
ATLANTA PUBLIC
SCHOOLS
12%
SOURCE: Atlanta Public Schools analysis of 2013–2014 school year data.
10
MEDIAN HOUSEHOLD INCOME BY RACE
ECONOMIC OPPORTUNITY
A job and steady source of income are essential to moving out of
poverty. Without the basic skills or credentials required to compete
in today’s job market, many children in low-income families can
end up struggling to make ends meet as adults.
While the unemployment rate in Atlanta
is 13 percent, the rate for African Americans
(22 percent) is more than three times higher
than that of their white counterparts (6
percent) and more than twice the rate for
Latinos (9 percent).52
In short, although
the majority of city residents are black, the
majority of workers are white.
Employment alone, however, does not
pave the way out of poverty, especially
for children in Atlanta’s low-income
communities. Nearly 25 percent of
Atlanta children born to parents at
the bottom of the income ladder will
remain there into adulthood, and less
than half will make their way into the
middle class.53
Most of those kids will
be children of color, as a look at median
household income by racial and ethnic
groups attests. Between 2009 and 2013,
the city’s white households earned a
median income of nearly $85,000, more
than three times the median income
for African Americans and almost
twice that of Latinos. Although Asian
and Pacific Islanders fare somewhat
better, their median household income
was almost $30,000 less than that of
white households.54
Factors Shaping Atlanta’s
Economic Landscape
Access to jobs. Most jobs in metro
Atlanta are concentrated in the north,
particularly those in the higher-paying
information, professional, scientific
and technical fields. But many south-
side households do not have the cars
that would help them tap into those
opportunities. In fact, many of the
NPUs with fewer job opportunities
are home to more families without a
vehicle. In five NPUs south of I-20,
more than 30 percent of households
do not own a vehicle, compared to less
than 12 percent in five northern NPUs
(see map on p. 12).55
Without their own cars, residents on
the south side rely heavily on public
transportation. Half of Metropolitan
Atlanta Rapid Transit Authority
(MARTA) riders use the system to
commute to work. But though MARTA
has fairly dense coverage within city
limits, making it accessible to many
low-income workers, it has fewer stops
in the northern metro areas where
jobs are concentrated.56
This severely
limits employment options for workers
from lower-income communities in
south Atlanta, or requires them to
EMPLOYMENT RATE, AGES 16-64
ATLANTA
AFRICAN AMERICAN
ASIAN AND PACIFIC ISLANDER
LATINO
WHITE
ATLANTA
AFRICAN AMERICAN
ASIAN AND PACIFIC ISLANDER
LATINO
WHITE
86%
78%
91%
94%
93%
$
57,172
$
84,944
$
43,141
$
26,605
$
46,631
SOURCE: Neighborhood Nexus analysis of the U.S. Census Bureau’s
2009-2013 American Community Survey.
11
DOWNTOWN ATLANTA
I
Z
A
B
P
D
H
C
J
F
R
G
X
S
W
Y
O
N
V
T
K L
Q
E
M
285
285
75
85
20
85
20
Most parents have big dreams for their
children and want to help them achieve
their goals. They want to live in vibrant
communities where their kids can play
and grow, attend good schools and launch
successful careers. But many city families
face insurmountable hurdles — limited
invest considerable time on public
transportation to go where the jobs are
— if the connections even exist. Workers
who must drop off and pick up their
kids from child care along the way must
clear even more hurdles to get to work. A
recent study found that commute time is
one of the biggest predictors of moving
up the economic ladder; the longer the
average commute, the lesser the odds.57
City trends in job growth will likely
only exacerbate the situation. The two
NPUs that added more than 2,500 jobs
in the two years following the recession
— NPU-B and NPU-E — are in the
northern and wealthier sections of
Atlanta. Two of the three NPUs that
lost more than 800 jobs during that
period — NPU-S and NPU-X — are
in the south, where there are more low-
income residents.58
A lack of education and skills. Most well-
paying jobs require some level of higher
education.59
Yet among Atlantans
ages 25 and older, only about half of
African Americans and Latinos have
some college experience, postsecondary
certification or training.60
Barriers to employment. Ninety-two
percent of Atlanta’s prison population is
black.61
As these individuals are released,
they are more likely to return to south-
side neighborhoods. In 2014, for example,
more than 200 formerly incarcerated
individuals settled in NPU-M, whose
neighborhoods include downtown Atlanta
and the Old Fourth Ward, while fewer
than 20 moved to the northern NPU-B.
These individuals struggle to start a new
life as their criminal records often keep
them from even getting an interview.
Even still, white job applicants with a
criminal record are more likely to get
a job interview than black applicants
without one.62
Children Living in Families With Incomes at or Above 200% of Poverty,
2009-2013
SOURCE: Neighborhood Nexus analysis of the U.S. Census Bureau’s 2009-2013 American Community Survey.
NOTE: Throughout this report, “low income” refers to families with incomes below 200 percent of the federal poverty threshold, which
was $23,624 for a family of four in 2013. Thus a family of two adults and two children fell in the low-income category if their annual
income was less than $47,248. Families with that little income often struggle to cover the cost of basic needs and expenses.
 79 to < 94% 36 to < 79% 25 to < 36% 14 to < 25% 2 to < 14%
education and job prospects, insufficient
income to properly support their children’s
growth and development — to making
those dreams a reality. With few rungs
on Atlanta’s economic ladder, moving
out of poverty can be a steep, sometimes
impossible climb for low-income families.
12
DOWNTOWN ATLANTA
I
Z
A
B
P
D
H
C
J
F
R
G
X
S
W
Y
O
N
V
T
K L
Q
E
M
285
285
75
85
20
85
20
ADULTS AGES 25 AND OLDER WITH SOME COLLEGE
32+68A
68%
51+49A
49%
ATLANTA
AFRICAN AMERICAN
11+89A
89%
ASIAN AND
PACIFIC ISLANDER
46+54A
54%
9+91A
91%
LATINO WHITE
Total Jobs by Neighborhood Planning Unit and Households
Without a Car, 2008-2012
DOWNTOWN ATLANTA
I
Z
A
B
P
D
H
C
J
F
R
G
X
S
W
Y
O
N
V
T
K L
Q
E
M
285
285
75
85
20
85
20
 62 to < 2,166 
 2,166 to < 3,132 
 3,132 to < 5,778
 5,778 to < 10,190  
 10,190 to < 128,934
 0 to < 8%
 8 to < 12%
 12 to < 27%
 27 to < 33%
 33 to < 38%
Most metro Atlanta jobs, particularly in the higher-paying information, professional, scientific and
technical fields, are concentrated in the north, but many south-side households do not have the cars
that would help them tap into those opportunities. Many of the NPUs with fewer job opportunities are
home to more families without a vehicle. In five NPUs south of I-20, more than 30 percent of households
do not own a vehicle, compared to less than 12 percent in five northern NPUs.
SOURCE: Neighborhood Nexus analysis of the U.S. Census Bureau’s
2009-2013 American Community Survey.
SOURCE: Neighborhood Nexus analysis of the Atlanta Regional Commission’s 2012 employment
estimates and the U.S. Census Bureau’s 2008-2012 American Community Survey.
Total Jobs
Households Without a Car (Percentage)
13
A TALE OF TWO CITIES: COMPARING ECONOMIC CONDITIONS AMONG NEIGHBORHOOD PLANNING UNITS
With 40,000 residents, the total population of three south-side NPUs (S, T and V) is similar to that of the northern NPU-B, but, as
closer study of the workforce in both areas reveals, the similarities end there.
WORKERS WHO ARE
AFRICAN AMERICAN
86+14A14%
EDUCATION
(BACHELOR’S DEGREE OR HIGHER)
69+31A31%
LOW-INCOME WORKERS
(LESS THAN $15,000 ANNUAL INCOME)
88+12A12%
MIDDLE- AND UPPER-INCOME WORKERS
(MORE THAN $40,000 ANNUAL INCOME)
47+53A65%
WORKERS WHO ARE
AFRICAN AMERICAN
21+79A79%
EDUCATION
(BACHELOR’S DEGREE OR HIGHER)
84+16A16%
LOW-INCOME WORKERS
(LESS THAN $15,000 ANNUAL INCOME)
70+30A30%
MIDDLE- AND UPPER-INCOME WORKERS
(MORE THAN $40,000 ANNUAL INCOME)
76+24A24%
NPU-B NPU-S, T and V
VS.
SOURCE: Neighborhood Nexus analysis of the U.S. Census Bureau’s 2009-2013 American Community Survey and 2011 Longitudinal Employer-Household Dynamics.
NOTE: Because the Longitudinal Employer-Household Dynamics data only include educational attainment information for about two-thirds of workers, the actual percentage
of workers with at least a bachelor’s degree is likely higher.
14
RECOMMENDATIONS
Our hope is to contribute to a new dialogue
and a citywide effort that enables public,
private, nonprofit, philanthropic and
community leaders to ensure Atlanta lives
up to its rich legacy.
But first, a note on the importance of
data. For a clear and accurate picture
of how all Atlanta children and families
are faring — and to properly inform city
policies, programs and decision making
— we must have publicly available
data on child and family well-being
that are disaggregated by race, ethnicity
and neighborhood. Developing data
on additional factors that affect well-
being, such as neighborhood investment
patterns and community assets, warrants
further consideration to fully understand
their impact on racial and ethnic groups.
This fundamental need, which touches
all of our suggestions here, calls for a
thorough assessment of the collection
of, and public access to, data that help
illuminate what contributes to inequities.
RECOMMENDATION 1
Increase investments in low-income
communities to support their — and the
city’s — economic growth.
Develop and preserve affordable and
quality housing. Having quality
affordable housing is key to community
stability, safety and health. To ensure
such housing is available throughout
Atlanta, city officials and the business
and philanthropic communities should
foster mixed-income communities near
transit and job centers. Public resources
should help prevent longtime residents
from being priced out of their homes
by using such tools as fair property
tax policy and low-interest home
rehabilitation loans and expanding
homeowner education programs.
A housing trust fund similar to the one
established for the Atlanta BeltLine,
the 22-mile development project
underway to replace underused rail
beds encircling downtown with trails,
parks and transit, could help ensure
major development projects include
affordable housing. Community land
trusts that preserve the affordability of
homes and inclusionary zoning policies
that require incorporating affordable
Too many of Atlanta’s children and families, especially those of
color, encounter considerable challenges that impede their ability
to achieve their full potential. In this section, we highlight several
recommendations that could begin removing those barriers and build
paths to opportunity for all children, families and communities.
15
homes into new projects could further
encourage such development.
Promote equitable development practices.
Community-based and citywide
development can produce vibrant
communities that benefit diverse racial,
ethnic and socioeconomic groups.
When large-scale developments are
planned in low-income communities,
public and private employers could
work with nonprofits focused on skill
building to create local hiring strategies,
and community benefits agreements
could help make sure residents most
affected can access project-related jobs.
Build the capacity of low- to moderate-
income entrepreneurs and enterprises in
communities of color, and bolster the local
economy by supporting businesses in low-
income neighborhoods. Many distressed
communities experience blight and
crime, but using public and private
capital to support new businesses and
microenterprises63
can help expand the
neighborhood asset base. Investments
in training programs for microbusiness
ownership can offer a path to financial
stability for many low- to moderate-
income families. The Neighborhood
Development Center in St. Paul,
Minn., for example, works to position
budding entrepreneurs in low-income
communities of color to invest in their
neighborhood’s revitalization. Since
1993, more than 500 of its graduates
have launched businesses, sustaining
2,200 jobs and returning $64 million to
their communities in payroll, taxes and
rent annually.64
Moreover, although universities and
hospitals spend more than $1 trillion
nationally each year, little of that buying
power is deliberately targeted toward
building up their surroundings.65
Atlanta is home to several major
universities and hospitals, community
colleges and government agencies
that could explore ways to redirect
and increase business to low-income
neighborhoods and minority- and
women-owned businesses.
RECOMMENDATION 2
Support strategies that prepare young children
and youth for success in school and beyond.
Improving Atlanta’s high school
graduation rate has implications beyond
the potential of each graduate: The
local economy would benefit, too. A
higher graduation rate in metro Atlanta
alone could result in nearly 2,000
jobs, $271 million in increased annual
earnings and $25 million more in state
and local tax revenues, according to one
study.66
But we must set the stage for
children’s academic success starting in
their earliest years.
Increase access to high-quality early child
care and education. The state of Georgia,
in partnership with Georgia Early
Education Alliance for Ready Students,
has launched a rating system for public
and private early education programs
that offers incentives for enrolling and
adopting higher standards than those
required for state licensing. Public and
private leaders should provide ongoing
and additional incentives to early
education programs in Atlanta’s low-
income communities and neighborhoods
with limited access to quality early
education to help improve the care
they provide.
Beyond improving access to quality
early education, more programs should
incorporate evidence-based strategies for
preparing children to enter kindergarten
ready to learn and to excel in their
elementary years. The Get Georgia
Reading Campaign, which aims to
To advance the local economy
and give all children the
chance to contribute to it,
Atlanta must address the
barriers to opportunity for
many in the city and region.
16
ensure all state children are reading
proficiently by the end of third grade, has
identified key elements that keep kids
developmentally on track in their early
years and launched several pilot programs
related to these essential elements in
and around Atlanta. One program, for
example, trains professionals who already
interact regularly with families, including
nurses, on ways to encourage parents to
talk with their young children, thereby
fostering early development.67
Promote productive learning environments
that support student attendance and
achievement. Schools can help improve
attendance rates and increase student
achievement.68
Georgia’s new School
Climate Star Rating evaluates the
learning environment of all the state’s
public schools and offers guidance to
help educators make their schools safer
and more engaging for all students,
thereby increasing attendance. Atlanta
Public Schools should continue to
expand and deepen implementation of
the evidence-based Positive Behavioral
Interventions and Supports69
(PBIS)
approach — which helps parents and
staff foster a safe, supportive and positive
learning environment — and use the
School Climate Star Rating to measure
progress and identify schools that need
to adopt PBIS. Through private funding,
the district has begun a pilot program
with early learning centers to improve
learning environments from infancy
through third grade.
Advance equity across the district. Not all
Atlanta schools offer the same quality
of education. In fact, “substantial
variations” exist across schools in
terms of teacher quality, academic
programming, classroom instruction,
financial support from private sources
and playgrounds.70
Private, philanthropic
and public leaders should work with
Atlanta Public Schools to help ensure its
resources are spread equitably. Schools
serving children who live in low-income
communities must have the necessary
tools — e.g., funding, health services,
expert teachers and leadership — to
support student achievement.
RECOMMENDATION 3
Pursue strategies to improve employment
opportunities for local residents.
Foster alignment and the sharing of
information among employers and job-
training programs. Strong partnerships
across Atlanta’s business community,
institutions of higher education and
the workforce development field are
essential to attract and retain new and
innovative business ventures and create
more concrete pathways to employment
for low-income residents. To meet
the needs of employers, people must
have access to training programs that
prepare them for family-supporting
jobs. In a survey of 200 metro Atlanta
organizations with employment or
job-training programs, less than one-
third reported working directly with an
employer.71
Metro Atlanta eXchange
for Workforce Solutions, a forum
for strengthening connections and
practices among workforce development
organizations, can help employment
and training programs align their
services with employers’ needs. It also
can facilitate stronger links between
employers, trade associations, chambers
of commerce and state and local
economic development entities to foster
more coordinated, forward-looking
strategies for regional growth.
Support sector-specific training programs.
Equipping low-skilled workers to meet
the needs of employers in particular
industries benefits businesses and allows
underemployed individuals to move
Most parents have big
dreams for their children,
but many Atlanta families
face insurmountable
hurdles to making those
dreams a reality.
17
up the career ladder and better support
their families. Atlanta CareerRise, for
example, uses a nationally recognized
job-readiness model that trains low-
skilled workers for jobs in high-growth
industries such as health care and
information technology. The program
has built solid relationships with
employers in these sectors, and the
White House has recognized its Atlanta
Beltline Healthcare Partnership, which
prepares people for careers in nursing,
as one of 35 model “Programs That
Work.”72
Such sector-specific strategies
should be expanded and employed in
other emerging industries.
Reduce barriers to employment. The
research is clear: Securing stable
employment is the best indicator of
whether a person with a criminal record
will be arrested again.73
Earlier this year,
Gov. Nathan Deal “banned the box”
on all state government employment
applications, postponing questions
about criminal history until an
applicant is identified as one of the
most qualified candidates. Applicants
also must have the chance to explain
their criminal history before denial, and
only a relevant conviction can be used to
disqualify a candidate. Similar policies
have already demonstrated their power.
A Philadelphia-based study found that
hiring 100 formerly incarcerated people
would reduce recidivism, leading to
increased income tax contributions of
$1.9 million, an additional $770,000
in sales tax revenue and $2 million
in annual savings.74
Private-sector
employers should take this approach
in their own hiring practices, further
expanding opportunities for individuals
with criminal records.
In addition, expanding public transit
systems and better integrating
transportation and housing development
projects can help address the lack of
affordable housing in the areas where
well-paying jobs are concentrated. The
Atlanta Transit Oriented Development
Collaborative, a partnership of nonprofits
and government agencies, is one of many
groups working to remove barriers to and
create incentives for equitable transit-
oriented development in metro Atlanta,
while increasing public awareness of its
benefits. Garnering public support is key
to the success of such efforts.
18
CONCLUSION
Instead of relying on children to beat the odds, we must act now to change the odds
so that all children in Atlanta have the chance to succeed. While many in the city
and region have worked to that end for decades, we cannot deny that dynamics of
race and place together continue to put needless barriers in the way of thousands
of children. The combined efforts of the public, philanthropic and private sectors,
including the business community, will be essential to removing those barriers.
The city’s future rests on the shoulders of the more than 80,000 children who call
it home. Their story will be Atlanta’s story. How it unfolds depends on what we do
today to craft a new and promising future for this generation and the ones to come.
ACKNOWLEDGMENTS
This report was written by Janelle Williams and Sarah Torian, an independent
consultant. Casey staff who contributed to this publication include Arin Gencer,
Charles Rutheiser and Nonet Sykes. This report would not have been possible without
the help of JustPartners Inc. and Partnership for Southern Equity. A special thank you
to Neighborhood Nexus and Atlanta Public Schools for providing data analysis.
Instead of relying on
children to beat the odds,
we must change the odds
so that all children in
Atlanta can succeed.
19
1. A phrase coined during the administration of
Mayor Ivan Allen, who embraced a moderate
stance on racial issues to prevent protests
experienced in other southern cities.
2. Metro Atlanta Chamber. (2014). Metro Atlanta
Fortune 500  Fortune 1000 headquarters.
Retrieved from www.metroatlantachamber./
docs/default-source/resources/2014-fortune-
headquarters.pdf?sfvrsn=4. With a $284 billion
gross metropolitan product, the Atlanta area’s
economy ranks 10th among U.S. metro areas.
3. Berube, A. (2014, February 20). All cities are not
created unequal. Metropolitan Opportunity Series,
Number 51 of 65. Washington, DC: Brookings
Institution. Retrieved from www.brookings.edu/
research/papers/2014/02/cities-unequal-berube.
And, Chetty, R., Hendren, N., Kline, P., 
Saez, E. (2014). Where is the land of economic
opportunity? The geography of intergenerational
mobility in the United States. Quarterly Journal
of Economics, 129(4). Retrieved from http://qje.
oxfordjournals.org/content/early/2014/10/16/qje.
qju022.full
4. Established by Maynard Jackson, the NPU system
divides Atlanta into 25 units through which
residents can influence zoning, land use and other
planning decisions in their community. For more,
see www.atlantaga.gov/index.aspx?page=739.
5. Treuhaft, S., Scoggins, J.,  Tran, J. (2014,
October 22). The equity solution: Racial inclusion is
key to growing a strong new economy. Oakland, CA:
PolicyLink. Retrieved from www.policylink.org/
sites/default/files/Equity_Solution_Brief.pdf
6. Barber, B. (2012, June 14). Racial diversity
increases, but segregation persists says geography
professor. Dartmouth Now.
7. Neighborhood Nexus analysis of 2010 U.S.
Census Bureau data. The 12 southern NPUs: H,
I, J, K, P, Q, R, S, T, V, X and Z. The six northern
NPUs: A, B, C, E, F and N.
8. Neighborhood Nexus analysis of the U.S. Census
Bureau’s 2008-2012 American Community Survey
for vehicle availability and the 2011 Longitudinal
Employer-Household Dynamics for job locations.
9. Berube, A. (2014, February 20).
10. U.S. Census Bureau. (n.d). Quick facts beta.
Retrieved on May 22, 2015, from www.census.
gov/quickfacts/table/IPE120213/00,1304000
11. Atlanta Regional Commission. (2015, February
11). Housing affordability in Metro Atlanta: It’s
complicated. Retrieved from www.slideshare.net/
ARCResearch/housing-affordability-fulldeck
12. Since 2000, Casey has focused specifically
on Atlanta’s Neighborhood Planning Unit V
(NPU-V), a set of neighborhoods just south
of downtown, seeking to improve the lives
of children and families and strengthen
their communities.
ENDNOTES
13. The Annie E. Casey Foundation. (2014). Race
for results: Building a path to opportunity for
all children (KIDS COUNT Policy Report).
Baltimore, MD: Author. Retrieved from www.
aecf.org/race4results
14. This includes recent efforts to collect and analyze
data so that community-based organizations
and local leaders have the information needed
to advocate for better and more even access to
quality education, jobs and public transportation
for all Atlantans.
15. This report draws on data from various entities
that define “metropolitan Atlanta” differently, from
Atlanta Regional Commission’s 10-county metro
region to the Atlanta Metropolitan Statistical Area
that now includes 29 counties surrounding the city.
16. Atlanta Regional Commission. (2011, April).
Regional snapshot: A decade of change in the
Atlanta region: A closer look at the 2010 Census.
Atlanta, GA: Author.
17. Atlanta Regional Commission. (2011, April).
18. Atlanta Regional Commission. (2011, April).
Even this dynamic has been shifting since 2000,
with many black residents moving from the city
to the suburbs.
19. The Annie E. Casey Foundation. (2014). Creating
opportunity for families: A two-generation approach
(KIDS COUNT Policy Report). Baltimore, MD:
Author. Retrieved from www.aecf.org/resources/
creating-opportunity-for-families
20. The Annie E. Casey Foundation. (2012).
Children living in high-poverty communities (KIDS
COUNT Data Snapshot). Baltimore, MD:
Author. Retrieved from www.aecf.org/resources/
data-snapshot-on-high-poverty-communities
21. Neighborhood Nexus analysis of the U.S. Census
Bureau’s 2008-2012 American Community
Survey. The two NPUs with poverty rates less
than 19 percent are P and Q. The five with rates
over 40 percent are J, L, V, Y and Z. The federal
poverty threshold is based on the U.S. Census
Bureau’s definition for a family of two adults and
two children in 2013.
22. Holliman, I. V. (2010). From “Crackertown” to
the “ATL”: Race, urban renewal, and the re-making
of downtown Atlanta, 1945-2000. Doctoral
dissertation, University of Georgia. And, Brown-
Nagin, T. (2011). Courage to dissent: Atlanta and
the long history of the civil rights movement. New
York, NY: Oxford University Press.
23. Rich, M., Owens, M. L., Griffiths, E., Haspel,
M., Hill, K., Smith, A.,  Stigers, K. (July
2010). Evaluation of the McDaniel Glenn
HOPE VI revitalization: Final report. Atlanta,
GA: Emory University. Retrieved from www.
atlantahousing.org/pdfs/HOPE%20VI%20
Evaluation_McDaniel%20Glenn_2010_07.
pdf. The McDaniel Glenn complex was located
in NPU-V. To ease the transition for relocating
residents, the Casey Foundation worked with
the Atlanta Housing Authority to arrange for
additional support services for families.
24. U.S. Department of Housing and Urban
Development. (2012, May 21). Affordable
housing. Retrieved May 20, 2015, from http://
portal.hud.gov/hudportal/HUD?src=/program_
offices/comm_planning/affordablehousing
25. Neighborhood Nexus analysis of the U.S. Census
Bureau’s 2008-2012 American Community
Survey, focused on the number of occupied
housing units that spend more than 30 percent
of annual income on housing. The six northern
NPUs: A, B, C, D, E and F. The 11 southern
NPUs: H, I, J, K, R, S, T, V, X, Y and Z.
26. Market Street Services Inc. for Atlanta Regional
Commission. (2012, April 26). Competitive assessment
metro Atlanta. Atlanta, GA: Author. Retrieved from
www.atlantaregional.com/File%20Library/Local
%20Gov%20Services/Econ%20Dev%20Strategy/
Metro-Atlanta-Competitive-Assessment.pdf
27. Brown, D. (2012, December 10). How home
ownership keeps blacks poorer than whites.
Forbes Magazine.
28. Bureau of Labor Statistics. (2015, April
2). Employment projections, earnings and
unemployment rates by educational attainment.
Retrieved from www.bls.gov/emp/ep_chart_001.
htm. Data are for ages 25 and older; earnings, for
full-time wage and salary workers.
29. The Annie E. Casey Foundation. (2013). The
first eight years: Giving kids a foundation for
lifetime success (KIDS COUNT Policy Report).
Baltimore, MD: Author. Retrieved from www.
aecf.org/resources/the-first-eight-years-giving-
kids-a-foundation-for-lifetime-success
30. Center on the Developing Child at Harvard
University. (2007). A science-based framework for
early childhood policy: Using evidence to improve
outcomes in learning, behavior, and health for
vulnerable children. Cambridge, MA: Author.
Retrieved from http://developingchild.harvard.
edu/index.php/resources/reports_and_working_
papers/policy_framework
31. Neighborhood Nexus analysis of the U.S. Census
Bureau’s 2009-2013 American Community Survey.
32. Bright from the Start: Georgia Department of
Early Care and Learning. (n.d.). Data retrieved
from www.decal.ga.gov/ProviderSearch/
SiteSearch.aspx?prekonly=ynewsearch=y
33. Quality Rated. (n.d.). How quality rated impacts
Georgia. Retrieved from http://qualityrated.
org/how-quality-rated-impacts-georgia. Frank
Porter Graham Child Development Institute at
the University of North Carolina conducted the
evaluation. And, Bright from the Start: Georgia
Department of Early Care and Learning. (n.d.) Data
retrieved from www.decal.ga.gov/ProviderSearch/
SiteSearch.aspx?prekonly=ynewsearch=y
20
34. The Annie E. Casey Foundation. (2013). Early
warning confirmed: A research update on third-
grade reading (KIDS COUNT Data Snapshot).
Baltimore, MD: Author. Retrieved from www.
aecf.org/resources/early-warning-confirmed
35. The Annie E. Casey Foundation. (2010). Early
warning! Why reading by the end of third grade
matters. Baltimore, MD: Author. Retrieved from
www.aecf.org/resources/early-warning-why-
reading-by-the-end-of-third-grade-matters
36. According to the 2010 U.S. Census, APS served
almost 90 percent (49,000) of city children and
youth ages 5–18. We therefore focus specifically
on the school district in this report, as it
represents the lion’s share of children.
37. Shierholz, H. (2009). Fix it and forget it:
Index the minimum wage to growth in average
wages. Washington, DC: Economic Policy
Institute. Retrieved from http://epi.3cdn.
net/91fd33f4e013307415_rum6iydua.pdf
38. Balfanz, R., Bridgeland, J. M., Fox, J. H.,
DePaoli, J. L., Ingram, E. S.,  Maushard,
M. (2014). Building a Grad Nation: Progress
and challenge in ending the high school dropout
epidemic. Annual update, 2014. Washington,
DC: Civic Enterprises. Retrieved from http://
gradnation.org/sites/default/files/17548_BGN_
Report_FinalFULL_5.2.14.pdf
39. Atlanta Public Schools analysis of 2013–2014
school year data.
40. Ibid.
41. Alliance for Excellent Education. (2013, October
15). The economic benefits of increasing the high
school graduation rate for public school students:
Atlanta-Sandy Springs-Marietta. Retrieved
on May 21, 2015, from http://all4ed.org/
reports-factsheets/the-economic-benefits-of-
increasing-the-high-school-graduation-rate-for-
public-school-students-in-atlanta-sandy-springs-
marietta-georgia
42. Brown-Nagin, T. (2011).
43. Tillery, C. (2006). Southern homecoming
traditions: Recipes and remembrances. New York,
NY: Kensington Publishing Corp.
44. Kruse. K. (2007). White flight: Atlanta and the
making of modern conservatism. Princeton, NJ:
Princeton University Press.
45. Bringslid, D. (2011, May). Determining the
implications of resegregation in the Atlanta public
school system and its effect on student achievement.
Undergraduate thesis, Georgia Institute for
Technology.
46. Neighborhood Nexus analysis of third-grade
reading scores for the state’s Criterion-Referenced
Competency Tests, from the Governor’s Office of
Student Achievement.
47. Kramer, D. (2012, March). Present and accounted
for. American School Board Journal (pp. 28-29).
48. Race Matters Institute. (2013). Race matters in
early school attendance. Baltimore, MD: Author.
Retrieved from http://racemattersinstitute.org/
resources/earlyschoolattendance
49. Neighborhood Nexus analysis of attendance
data for the 2013-2014 school year from the
Governor’s Office of Student Achievement.
Retrieved from http://gosa.georgia.gov/
downloadable-data
50. U.S. Department of Education. (n.d.). Civil rights
data collection: Atlanta Public Schools, Atlanta, GA.
Retrieved on May 21, 2015, from http://ocrdata.
ed.gov/Page?t=deid=28846syk=6pid=736
51. Atlanta Public Schools analysis of 2013–2014
school year data.
52. Neighborhood Nexus analysis of the U.S. Census
Bureau’s 2009-2013 American Community Survey.
53. Leonhardt, D. (2013, July 22). In climbing
income ladder, location matters. New York Times.
Retrieved from www.nytimes.com/2013/07/22/
business/in-climbing-income-ladder-location-
matters.html?pagewanted=all_r=0
54. Neighborhood Nexus analysis of the U.S. Census
Bureau’s 2009-2013 American Community Survey.
55. Neighborhood Nexus analysis of the U.S. Census
Bureau’s 2008-2012 American Community
Survey. The four southern NPUs: R, T, V and X.
The four northern NPUs: A, B, C and D.
56. Clarke, W., Kane, S.,  Shepherd, T. (December
2012). The economic impact of the Metropolitan
Atlanta Rapid Transit Authority on the economy
and labor mobility of the region. Athens, GA: The
University of Georgia, Carl Vinson Institute
of Government. Retrieved from www.caes.
uga.edu/center/caed/pubs/2012/documents/
MARTAFinalReport.pdf. And, Neighborhood
Nexus analysis of the Atlanta Regional
Commission’s 2012 employment estimates,
overlaid with MARTA’s bus stop coverage.
57. Chetty, R.,  Hendren, N. (2015, May). The
impacts of neighborhoods on intergenerational
mobility: Childhood exposure effects and county-level
estimates. Cambridge, MA: Harvard University
and NBER. Retrieved from www.equality-of-
opportunity.org/images/nbhds_paper.pdf
58. Neighborhood Nexus analysis of U.S. Census
Bureau’s 2008-2012 American Community
Survey and the Atlanta Regional Commission’s
2012 employment estimates.
59. Carnevale, A. P., Smith, N.,  Strohl, J. (2010,
June). Help wanted: Projections of jobs and education
requirements through 2018. Washington, DC:
Georgetown University, Georgetown Public Policy
Institute, Center on Education and the Workforce.
Retrieved from cew.georgetown.edu/jobs2018
60. Neighborhood Nexus analysis of the U.S. Census
Bureau’s 2008-2012 American Community Survey.
61. Neighborhood Nexus analysis of prisoner
release data from the Georgia Department of
Corrections. Data reflect the prison population as
of Jan. 1, 2015.
62. Pager, D. (2003). The mark of a criminal record.
American Journal of Sociology, 108(5): 937-975.
And, Holzer, H. (2007, October). Collateral
costs: The effects of incarceration on the employment
earnings of young workers. IZA Discussion Paper
No. 3118.
63. Microenterprises are very small businesses, usually
with less than a handful of employees.
64. The Annie E. Casey Foundation. (2015).
Expanding economic opportunity: Lessons from the
East Baltimore Revitalization Initiative. Baltimore,
MD: Author. Retrieved from www.aecf.org/
resources/expanding-economic-opportunity
65. The Democracy Collaborative. (2014). Policies
for community wealth building: Leveraging
state and local resources. Retrieved from http://
democracycollaborative.org/sites/clone.community-
wealth.org/files/downloads/PoliciesForCommunity
WealthBuilding-September2014-final.pdf
66. Alliance for Excellent Education. (2013, October 15).
67. To learn more about the campaign and the pilot
program, see www.getgeorgiareading.org and
www.talkwithmebaby.org.
68. Attendance Works. (n.d.) AttendanceWorks: Advancing
student success by reducing chronic absence. Retrieved
May 21, 2015, from www.attendanceworks.org
69. To learn more about PBIS, visit www.pbis.org.
Atlanta Public Schools calls its program Positive
Behavioral Supports (see www.nasponline.org/
publications/cq/cq352pbs_ho.aspx).
70. Fortner, C. K., Faust-Berryman, A.,  Keehn,
G. T. (2014, July). Atlanta Public Schools equity
audit report.
71. Survey completed by the Metro Atlanta eXchange
for Workforce Solutions, 2014.
72. PRWEB. (2014, July 24). President cites Atlanta
BeltLine Workforce Partnership in Healthcare as
national model. Retrieved from www.prweb.com/
releases/2014/07/prweb12044260.htm
73. Samuels, P.,  Mukamal, D. (2004). After prison,
roadblocks to reentry: A report on state legal barriers
facing people with criminal records. New York, NY:
Legal Action Center.
74. Economy League of Greater Philadelphia. (2011,
September). Economic benefits of employing
formerly incarcerated individuals in Philadelphia.
Philadelphia, PA: Author. Retrieved from http://
economyleague.org/files/ExOffenders_-_Full_
Report_FINAL_revised.pdf
21
2
THE ANNIE E. CASEY FOUNDATION
701 St. Paul Street   
Baltimore, MD 21202   
410.547.6600   
www.aecf.org

More Related Content

What's hot

City Report Toronto Final 2014
City Report Toronto Final 2014City Report Toronto Final 2014
City Report Toronto Final 2014Aaron Joshua Pinto
 
America's Tomorrow Press Coverage May-July 2011
America's Tomorrow Press Coverage May-July 2011America's Tomorrow Press Coverage May-July 2011
America's Tomorrow Press Coverage May-July 2011Pixel Prose Media, LLC
 
Poverty as a_factor_in_human_trafficking_in_rwanda
Poverty as a_factor_in_human_trafficking_in_rwandaPoverty as a_factor_in_human_trafficking_in_rwanda
Poverty as a_factor_in_human_trafficking_in_rwandaJohnGacinya
 
America's tomorrow full report (1)
America's tomorrow full report (1)America's tomorrow full report (1)
America's tomorrow full report (1)Roar Media
 
Racial wealth snapshot: latino americans | prosperity now
Racial wealth snapshot: latino americans | prosperity nowRacial wealth snapshot: latino americans | prosperity now
Racial wealth snapshot: latino americans | prosperity nowJoseMacias86
 
Gned presentation with references equality
Gned presentation with references equalityGned presentation with references equality
Gned presentation with references equalityDarika Ravichandran
 
Wide Open Spaces: Schooling in Rural America Today
Wide Open Spaces: Schooling in Rural America TodayWide Open Spaces: Schooling in Rural America Today
Wide Open Spaces: Schooling in Rural America TodayJeremy Knight
 
Poverty Strategies
Poverty StrategiesPoverty Strategies
Poverty StrategiesRachel Jones
 
Latino heritage month: economic inequality and latinos | prosperity now
Latino heritage month: economic inequality and latinos | prosperity nowLatino heritage month: economic inequality and latinos | prosperity now
Latino heritage month: economic inequality and latinos | prosperity nowJoseMacias86
 
Education in the American South: Historical Context, Current State, and Futur...
Education in the American South: Historical Context, Current State, and Futur...Education in the American South: Historical Context, Current State, and Futur...
Education in the American South: Historical Context, Current State, and Futur...Jeremy Knight
 
Kaleb bradley come gamble unm crp 275 community change in a global era]
Kaleb bradley come gamble unm crp 275 community change in a global era]Kaleb bradley come gamble unm crp 275 community change in a global era]
Kaleb bradley come gamble unm crp 275 community change in a global era]Dr. J
 
#TimeToCare (India Supplement) | Oxfam India
#TimeToCare (India Supplement) | Oxfam India#TimeToCare (India Supplement) | Oxfam India
#TimeToCare (India Supplement) | Oxfam IndiaOxfam India
 
People with Albinism in Tanzania
People with Albinism in TanzaniaPeople with Albinism in Tanzania
People with Albinism in Tanzaniamburlot
 
FINAL Version Latino Report Card
FINAL Version Latino Report CardFINAL Version Latino Report Card
FINAL Version Latino Report CardAngie Aguirre
 
WOMEN MEN AND DEVELOPMENT MARCH 2006
 WOMEN MEN AND DEVELOPMENT MARCH 2006  WOMEN MEN AND DEVELOPMENT MARCH 2006
WOMEN MEN AND DEVELOPMENT MARCH 2006 Dr Lendy Spires
 

What's hot (20)

City Report Toronto Final 2014
City Report Toronto Final 2014City Report Toronto Final 2014
City Report Toronto Final 2014
 
America's Tomorrow Press Coverage May-July 2011
America's Tomorrow Press Coverage May-July 2011America's Tomorrow Press Coverage May-July 2011
America's Tomorrow Press Coverage May-July 2011
 
Focusing On What Matters
Focusing On What MattersFocusing On What Matters
Focusing On What Matters
 
Poverty as a_factor_in_human_trafficking_in_rwanda
Poverty as a_factor_in_human_trafficking_in_rwandaPoverty as a_factor_in_human_trafficking_in_rwanda
Poverty as a_factor_in_human_trafficking_in_rwanda
 
America's tomorrow full report (1)
America's tomorrow full report (1)America's tomorrow full report (1)
America's tomorrow full report (1)
 
Racial wealth snapshot: latino americans | prosperity now
Racial wealth snapshot: latino americans | prosperity nowRacial wealth snapshot: latino americans | prosperity now
Racial wealth snapshot: latino americans | prosperity now
 
Gned presentation with references equality
Gned presentation with references equalityGned presentation with references equality
Gned presentation with references equality
 
Wide Open Spaces: Schooling in Rural America Today
Wide Open Spaces: Schooling in Rural America TodayWide Open Spaces: Schooling in Rural America Today
Wide Open Spaces: Schooling in Rural America Today
 
Poverty Strategies
Poverty StrategiesPoverty Strategies
Poverty Strategies
 
Latino heritage month: economic inequality and latinos | prosperity now
Latino heritage month: economic inequality and latinos | prosperity nowLatino heritage month: economic inequality and latinos | prosperity now
Latino heritage month: economic inequality and latinos | prosperity now
 
Haitians in Boston
Haitians in BostonHaitians in Boston
Haitians in Boston
 
Education in the American South: Historical Context, Current State, and Futur...
Education in the American South: Historical Context, Current State, and Futur...Education in the American South: Historical Context, Current State, and Futur...
Education in the American South: Historical Context, Current State, and Futur...
 
Kaleb bradley come gamble unm crp 275 community change in a global era]
Kaleb bradley come gamble unm crp 275 community change in a global era]Kaleb bradley come gamble unm crp 275 community change in a global era]
Kaleb bradley come gamble unm crp 275 community change in a global era]
 
Envision Publication 2015
Envision Publication 2015Envision Publication 2015
Envision Publication 2015
 
#TimeToCare (India Supplement) | Oxfam India
#TimeToCare (India Supplement) | Oxfam India#TimeToCare (India Supplement) | Oxfam India
#TimeToCare (India Supplement) | Oxfam India
 
People with Albinism in Tanzania
People with Albinism in TanzaniaPeople with Albinism in Tanzania
People with Albinism in Tanzania
 
FINAL Version Latino Report Card
FINAL Version Latino Report CardFINAL Version Latino Report Card
FINAL Version Latino Report Card
 
WOMEN MEN AND DEVELOPMENT MARCH 2006
 WOMEN MEN AND DEVELOPMENT MARCH 2006  WOMEN MEN AND DEVELOPMENT MARCH 2006
WOMEN MEN AND DEVELOPMENT MARCH 2006
 
Poverty in haiti
Poverty in haitiPoverty in haiti
Poverty in haiti
 
Project one ruvalles
Project one   ruvallesProject one   ruvalles
Project one ruvalles
 

Viewers also liked

Titanium + Ruby: The good stuff
Titanium + Ruby: The good stuffTitanium + Ruby: The good stuff
Titanium + Ruby: The good stuffMarshall Culpepper
 
Enseñar la condición humana
Enseñar la condición humana Enseñar la condición humana
Enseñar la condición humana Cristian Zavala
 
An analysis of environmental impacts of various environmental aspects for ind...
An analysis of environmental impacts of various environmental aspects for ind...An analysis of environmental impacts of various environmental aspects for ind...
An analysis of environmental impacts of various environmental aspects for ind...eSAT Journals
 
8.1.- IPO. Estilos y paradigmas de interacción
8.1.- IPO. Estilos y paradigmas de interacción8.1.- IPO. Estilos y paradigmas de interacción
8.1.- IPO. Estilos y paradigmas de interacciónDCU_MPIUA
 
Telecon Education and Services
Telecon Education and ServicesTelecon Education and Services
Telecon Education and ServicesTelecon Telecon
 
7 Tips to Straighten Out the Kinks in Your Employee Onboarding Process
7 Tips to Straighten Out the Kinks in Your Employee Onboarding Process7 Tips to Straighten Out the Kinks in Your Employee Onboarding Process
7 Tips to Straighten Out the Kinks in Your Employee Onboarding ProcessClearCompany
 

Viewers also liked (8)

Titanium + Ruby: The good stuff
Titanium + Ruby: The good stuffTitanium + Ruby: The good stuff
Titanium + Ruby: The good stuff
 
Novas Tecnologias para Educação
Novas Tecnologias para EducaçãoNovas Tecnologias para Educação
Novas Tecnologias para Educação
 
Enseñar la condición humana
Enseñar la condición humana Enseñar la condición humana
Enseñar la condición humana
 
An analysis of environmental impacts of various environmental aspects for ind...
An analysis of environmental impacts of various environmental aspects for ind...An analysis of environmental impacts of various environmental aspects for ind...
An analysis of environmental impacts of various environmental aspects for ind...
 
8.1.- IPO. Estilos y paradigmas de interacción
8.1.- IPO. Estilos y paradigmas de interacción8.1.- IPO. Estilos y paradigmas de interacción
8.1.- IPO. Estilos y paradigmas de interacción
 
Telecon Education and Services
Telecon Education and ServicesTelecon Education and Services
Telecon Education and Services
 
7 Tips to Straighten Out the Kinks in Your Employee Onboarding Process
7 Tips to Straighten Out the Kinks in Your Employee Onboarding Process7 Tips to Straighten Out the Kinks in Your Employee Onboarding Process
7 Tips to Straighten Out the Kinks in Your Employee Onboarding Process
 
Herramientas digitales.tiace
Herramientas digitales.tiaceHerramientas digitales.tiace
Herramientas digitales.tiace
 

Similar to AECF-ChangingTheOdds-Atlanta-2015

Creating an Equitable Future in Washington State
Creating an Equitable Future in Washington StateCreating an Equitable Future in Washington State
Creating an Equitable Future in Washington StateTabor 100
 
African Americans Today The Issues SOCY 3020-E01 Race .docx
African Americans Today The Issues SOCY 3020-E01 Race .docxAfrican Americans Today The Issues SOCY 3020-E01 Race .docx
African Americans Today The Issues SOCY 3020-E01 Race .docxcoubroughcosta
 
America’s Racially Diverse Suburbs Opportunities and Chal.docx
America’s Racially Diverse Suburbs Opportunities and Chal.docxAmerica’s Racially Diverse Suburbs Opportunities and Chal.docx
America’s Racially Diverse Suburbs Opportunities and Chal.docxnettletondevon
 
Making the Invisible Visible
Making the Invisible VisibleMaking the Invisible Visible
Making the Invisible VisibleJaneen Comenote
 
African american-consumer-untold-story-sept-2015
African american-consumer-untold-story-sept-2015African american-consumer-untold-story-sept-2015
African american-consumer-untold-story-sept-2015Loyalty Consultants FZ
 
Who is Tulsa - Overview
Who is Tulsa - OverviewWho is Tulsa - Overview
Who is Tulsa - Overviewoiiannie
 
The New Philanthropists: Fundraising with Diverse Communities_Association of ...
The New Philanthropists: Fundraising with Diverse Communities_Association of ...The New Philanthropists: Fundraising with Diverse Communities_Association of ...
The New Philanthropists: Fundraising with Diverse Communities_Association of ...Mando Rayo
 
Racial Wealth Inequality: Myths, Realities, and What Can be Done About It Wor...
Racial Wealth Inequality: Myths, Realities, and What Can be Done About It Wor...Racial Wealth Inequality: Myths, Realities, and What Can be Done About It Wor...
Racial Wealth Inequality: Myths, Realities, and What Can be Done About It Wor...Bonner Foundation
 
MsFoundationReport_Web_DiskStation_Sep-15-2054-2015_Conflict
MsFoundationReport_Web_DiskStation_Sep-15-2054-2015_ConflictMsFoundationReport_Web_DiskStation_Sep-15-2054-2015_Conflict
MsFoundationReport_Web_DiskStation_Sep-15-2054-2015_ConflictDeborah Jacobs
 

Similar to AECF-ChangingTheOdds-Atlanta-2015 (12)

Creating an Equitable Future in Washington State
Creating an Equitable Future in Washington StateCreating an Equitable Future in Washington State
Creating an Equitable Future in Washington State
 
African Americans Today The Issues SOCY 3020-E01 Race .docx
African Americans Today The Issues SOCY 3020-E01 Race .docxAfrican Americans Today The Issues SOCY 3020-E01 Race .docx
African Americans Today The Issues SOCY 3020-E01 Race .docx
 
America’s Racially Diverse Suburbs Opportunities and Chal.docx
America’s Racially Diverse Suburbs Opportunities and Chal.docxAmerica’s Racially Diverse Suburbs Opportunities and Chal.docx
America’s Racially Diverse Suburbs Opportunities and Chal.docx
 
Making the Invisible Visible
Making the Invisible VisibleMaking the Invisible Visible
Making the Invisible Visible
 
African american-consumer-untold-story-sept-2015
African american-consumer-untold-story-sept-2015African american-consumer-untold-story-sept-2015
African american-consumer-untold-story-sept-2015
 
Immigration Essay
Immigration EssayImmigration Essay
Immigration Essay
 
Hansen_Essay_3
Hansen_Essay_3Hansen_Essay_3
Hansen_Essay_3
 
Beyond Post-Racialism, Toward Opportunity and Social Justice
Beyond Post-Racialism, Toward Opportunity and Social Justice Beyond Post-Racialism, Toward Opportunity and Social Justice
Beyond Post-Racialism, Toward Opportunity and Social Justice
 
Who is Tulsa - Overview
Who is Tulsa - OverviewWho is Tulsa - Overview
Who is Tulsa - Overview
 
The New Philanthropists: Fundraising with Diverse Communities_Association of ...
The New Philanthropists: Fundraising with Diverse Communities_Association of ...The New Philanthropists: Fundraising with Diverse Communities_Association of ...
The New Philanthropists: Fundraising with Diverse Communities_Association of ...
 
Racial Wealth Inequality: Myths, Realities, and What Can be Done About It Wor...
Racial Wealth Inequality: Myths, Realities, and What Can be Done About It Wor...Racial Wealth Inequality: Myths, Realities, and What Can be Done About It Wor...
Racial Wealth Inequality: Myths, Realities, and What Can be Done About It Wor...
 
MsFoundationReport_Web_DiskStation_Sep-15-2054-2015_Conflict
MsFoundationReport_Web_DiskStation_Sep-15-2054-2015_ConflictMsFoundationReport_Web_DiskStation_Sep-15-2054-2015_Conflict
MsFoundationReport_Web_DiskStation_Sep-15-2054-2015_Conflict
 

AECF-ChangingTheOdds-Atlanta-2015

  • 1. 3 CHANGING THE ODDS the race for results in atlanta
  • 2. 4 The Annie E. Casey Foundation is a private philanthropy that creates a brighter future for the nation’s children by developing solutions to strengthen families, build paths to economic opportunity and transform struggling communities into safer and healthier places to live, work and grow. For more information, visit www.aecf.org. © 2015 The Annie E. Casey Foundation THE ANNIE E. CASEY FOUNDATION
  • 4. 2 INTRODUCTION The city is a magnet for professionals, particularly people of color. It also has a rich legacy of black and white civic and community leaders working tirelessly to stand apart from other southern cities when it came to the racial tension and unrest that marked the 1960s, positioning Atlanta as the “city too busy to hate.”1 Then-Mayor Ivan Allen was the only major southern leader to publicly endorse national civil rights legislation, and Maynard Jackson, the city’s first African-American mayor, established groundbreaking affirmative action policies and kept Atlanta’s international airport on the south side, bringing thousands of jobs to that part of the city to balance business expansion to the north. Today, metro Atlanta serves as the headquarters for nearly 30 Fortune 1000 companies that collectively generated almost $360 billion in revenues in 2014 alone, contributing to a booming economy that is among the largest in the country.2 But while the city has much to celebrate, its proud history and thriving economy mask deep and enduring challenges that make it one of the most difficult places in the nation for children in low- income families to climb out of poverty.3 This is even truer for the city’s children of color, whose families are more likely to struggle to make ends meet and reside in neighborhoods contending with blight, limited resources and few opportunities to realize their dreams for a better life. Race has undeniably shaped the city’s landscape, giving rise to two very different Atlantas that underscore the fact that the place where children grow up affects their opportunities in life. This report examines the city through its 25 neighborhood planning units (NPUs)4 — the resident advisory councils that make zoning and other planning recommendations — to explore how race and community of residence erect persistent barriers that keep kids from reaching their potential. They also keep the city from fully harnessing its economic power: Metro Atlanta’s economy stands to gain an additional $78.6 million annually by promoting racial equity, according to a recent study.5 The importance of community is evident throughout metro Atlanta, but especially in the city. While the city has become somewhat more diverse in recent years, it remains divided, literally and figuratively. The east-west Interstate 20 separates wealthier, majority-white communities in the north from poorer, majority-black ones in the south.6 African Americans represent at least 80 percent of the population in 12 of the 17 NPUs located along or below I-20, while more than 60 percent of the six northern NPUs’ populations are white.7 NPUs in northern Atlanta have the highest enrollment in early education programs and the highest- performing elementary schools, most of the city’s high-income workers and better access to the growing job market on the north side and in the northern suburbs. By contrast, most of Atlanta’s low-income workers live in the southern NPUs, and few have access to reliable transportation that would allow them to tap into regional employment opportunities that lie beyond the reach of public transit.8 Even as metro Atlanta’s economy thrives, the city recently ranked first for income inequality,9 and one in four of its residents lives in poverty.10 In addition, low- and moderate-income workers and families have limited housing options.11 To advance the local economy and ensure all children have the chance to participate in and contribute to it, Atlanta must address the barriers to opportunity that face many in the city and region. Examining Barriers to Opportunity at the Local Level For more than a decade, the Annie E. Casey Foundation has worked with a broad range of partners to increase educational and economic opportunities for children and families in several southwest Atlanta neighborhoods,with the goal of ensuring all kids, regardless of race, ethnicity or community of residence, have the chance to realize their full potential.12 Yet race remains a major predictor of a child’s trajectory in life — a reality reinforced by nearly every measure of child and family well- being highlighted in this report. Atlanta is the birthplace of the Rev. Martin Luther King Jr. and the American civil rights movement and home to some of the country’s most prestigious historically black colleges and universities.
  • 5. 3 PLACING ATLANTA IN A REGIONAL CONTEXT While this report focuses on the city of Atlanta, we cannot ignore the impact the surrounding region has on city residents. Mirroring national trends, the metropolitan region15 has become increasingly diverse in recent decades. The 1980s brought refugees from Asia, Afghanistan, Ethiopia and Europe, and Atlanta’s booming economy has attracted large numbers of immigrants from Latin America, the Caribbean, the Middle East and Africa. In the past decade alone, the region’s population has grown by 1 million, making it one of the fastest-growing in the United States. Increases in populations of color are responsible for 90 percent of that growth.16 Yet soaring racial and ethnic diversity have not translated into racially and ethnically diverse neighborhoods. Most white residents live in the region’s outer counties and the city’s north side, while black residents are mostly clustered to the south. Asians and Pacific Islanders primarily live in the northeastern counties, with some pockets in other areas, while Latinos most heavily reside in the metro area’s northeastern and northwestern counties.17 In contrast to this multicultural panorama, the city landscape is largely black and white: The two groups represent nearly 90 percent of the population.18 Given this context and the limited availability of data for smaller racial and ethnic groups, this report primarily focuses on the city’s black and white residents, including statistics for other groups where possible. In 2014, the Casey Foundation released Race for Results: Building a Path to Opportunity for All Children, which revealed that children of color across the nation have a steeper hill to climb when it comes to meeting key milestones on the path to a successful adulthood.13 We now explore how this steeper climb plays out on the local level, in Atlanta, where the Foundation has made a long-term commitment to improving the lives of children and families, as well as the places where they live. We hope to build on the longtime work of others who have sought to remove the obstacles that too many kids and families in the region have encountered for decades.14 This report focuses on three key areas that support or thwart children’s healthy growth and development: (1) the community where they grow up; (2) their school experiences; and (3) their family’s access to economic opportunities. It seeks to identify how public policies and practices in each area maintain barriers to success for children and families, particularly those of color, and offers recommendations for addressing these obstacles so that all children can thrive. SOURCE: Neighborhood Nexus analysis of 2010 U.S. Census Bureau data. A City Divided DOWNTOWN ATLANTA I Z A B P D H C J F R G X S W Y O N V T K L Q E M 285 285 75 85 20 85 20  Majority Black Majority White In Atlanta, the east-west I-20 separates wealthier, majority-white communities in the north from poorer, majority-black communities in the south. African Americans represent at least 80 percent of the population in 12 of the 17 NPUs located along or below I-20.
  • 6. 4 COMMUNITY Children’s success is strongly tied to their family’s stability and well-being, which, in turn, is affected by where they live.19 Children living in high-poverty areas — like many of the neighborhoods on Atlanta’s south side — frequently lack access to critical resources such as high-performing schools, quality medical care and safe outdoor spaces. Regardless of income, families living in high-poverty communities are more likely to have limited healthy food options and pay more for housing than those living in more affluent areas.20 These challenges often trap children in a cycle of poverty. In Atlanta, the relationship between place and race is glaring. Ninety-four percent of white children live in low-poverty communities, compared to 20 percent of black children and 57 percent of Latino children. The neighborhood planning units underscore this reality, with most high-poverty areas concentrated in the predominantly black NPUs located along or below I-20. Only five of the 17 NPUs along or south of I-20 are considered low-poverty areas, where the poverty rate is less than 20 percent, and in four of the south-side NPUs, more than 40 percent of residents live below the federal poverty line, or $23,624 for a family of four.21 Factors Shaping Atlanta’s Community Landscape A history of segregation and recent redevelopment. Racially segregated public housing, zoning ordinances and other public- and private-sector practices throughout the last century set the stage for many of the challenges that pervade a number of Atlanta neighborhoods today. During the wave of urban renewal programs in the mid-20th century, the city used federal funds to demolish homes in lower-income communities to allow for new interstate highways, a civic center and what is now Turner Field. This weakened the fabric of the majority-black neighborhoods that bore the brunt of the demolition and left the tens of thousands who were displaced — also mostly black — with few housing options because of segregation policies and delays in housing development in those communities.22 Demolition continued in the 1990s and 2000s, as the city used the federal HOPE VI program to redevelop public housing complexes. Although the mixed- income developments that replaced them brought more economic diversity to some high-poverty neighborhoods, they had fewer affordable units for lower-income families. Even with these new developments, poverty remains concentrated on the city’s south side, and most relocated families ended up in low-income neighborhoods contending CHILDREN WHO LIVE IN LOW-POVERTY AREAS (POVERTY < 20%) ATLANTA AFRICAN AMERICAN ASIAN AND PACIFIC ISLANDER LATINO WHITE 20% 44% 57% 94% 71% SOURCE: Neighborhood Nexus analysis of the U.S. Census Bureau’s 2008-2012 American Community Survey.
  • 7. SOURCE: Neighborhood Nexus analysis of 2010 U.S. Census Bureau data. 5 Vacant Housing in Atlanta by Neighborhood Planning Unit, 2010 with challenges such as high foreclosure rates and violent crime.23 The cost of housing and declining home values. Many south and central Atlanta families spend more than 30 percent of their income on housing, placing them in financially precarious positions as they struggle to cover other expenses such as food, clothing and child care.24 Most of the households in 11 of the 17 NPUs along or south of I-20 find themselves in this predicament. In NPU-L, just west of downtown, this is true for more than 70 percent of households. In the six northern majority-white NPUs, by contrast, less than 40 percent of households spend more than 30 percent of their income on housing.25 The dramatic drop in metro Atlanta home values caused by the Great Recession has further undermined family and neighborhood stability — particularly for African-American residents, who saw a disproportionate decrease in the value of their homes.26 Since the recession, home values in northern Atlanta neighborhoods have largely rebounded, matching national trends. The same has not held true on the city’s south side, where many home mortgages exceed property values. These losses create a domino effect, as they turn what is normally considered an asset — homeownership — into a liability.27 With a majority of households in south Atlanta struggling to make ends meet and neighborhood stability weakened by the housing market crash, the ability of black families to build assets and wealth has been largely compromised. DOWNTOWN ATLANTA I Z A B P D H C J F R G X S W Y O N V T K L Q E M 285 285 75 85 20 85 20  18 to < 32% 11 to < 18% 5 to < 11% 2 to < 5% 0 to < 2%
  • 8. 6 EDUCATION The equation is simple: The more education you have, the more you earn — and the more likely you are to be able to get and keep a job that pays enough to support a family.28 In Atlanta, however, there is a notable difference in the quality of educational opportunities to which children have access, starting from their earliest years and continuing through high school. Early childhood education. Research underscores the importance of the early years in a child’s life in laying a solid foundation for success in school and beyond: Children in high-quality early education programs are more likely to graduate from high school.29 Such programs have an even greater influence on the growth and development of children in low-income families.30 Yet preschool enrollment is uneven across Atlanta, with lower enrollment on the south side, where more black children and kids in low-income families live.31 For example, more than 80 percent of 3- and 4-year-old children in majority-white NPU-A and NPU-N are enrolled in an early education program, compared with only about 25 percent of children in majority-black NPU-J. The reasons for these differences in enrollment are unclear and require additional research. The statewide Georgia Pre-K program covers the cost of prekindergarten for 4-year-olds in public schools and private child care centers, but its open-enrollment process and voluntary nature can limit the available slots for children in communities where demand is high and affordable alternatives are few or nonexistent. In addition, almost half of the city’s Georgia Pre-K programs do not accept the public subsidies that help low-income families pay for child care for younger children not yet eligible for Georgia Pre-K, which could force them to pursue other avenues for their care or thwart their employment opportunities.32 A lack of access to quality child care might also contribute to these differences; one study found that two-thirds of Georgia’s infants and toddlers are in child care centers of “unacceptably low quality.”33 Reading proficiency. An early mastery of reading is critical to a child’s academic success, providing a solid base for learning more complex concepts in higher grades.34 Fourth-graders who struggle with reading are four times more likely to drop out.35 Among Atlanta Public Schools36 students, the percentage of white third- graders (88 percent) who exceeded the state’s reading standards — a stronger measure of proficiency — was more HIGH SCHOOL STUDENTS GRADUATING ON TIME: ATLANTA PUBLIC SCHOOLS, 2014 41+59A 59% 43+57A 57% ATLANTA PUBLIC SCHOOLS AFRICAN AMERICAN 6+94A 94% ASIAN AND PACIFIC ISLANDER 47+53A 53% 16+84A 84% LATINO WHITE SOURCE: Atlanta Public Schools analysis of 2013–2014 school year data.
  • 9. 7 Percentage of Children in Nursery School or Preschool, 2009-2013 DOWNTOWN ATLANTA I Z A B P D H C J F R G X S W Y O N V T K L Q E M 285 285 75 85 20 85 20  71 to < 90%  58 to < 71%  52 to < 58%  37 to < 52%  25 to < 37% THIRD-GRADERS WHO MEET OR EXCEED STANDARDS FOR READING, 2014 ATLANTA PUBLIC SCHOOLS AFRICAN AMERICAN ASIAN LATINO WHITE 0%        20%        40%         60%        80%   Meets      Exceeds EIGHTH-GRADERS WHO MEET OR EXCEED STANDARDS FOR MATH, 2014 ATLANTA PUBLIC SCHOOLS AFRICAN AMERICAN ASIAN LATINO WHITE 0%        20%        40%         60%        80%   Meets      Exceeds SOURCE: Neighborhood Nexus analysis of the U.S. Census Bureau’s 2009-2013 American Community Survey. SOURCE: Governor’s Office of Student Achievement, K-12 Public Schools Report Card data for the 2013-2014 school year. 50% 39% 61% 24% 15% 79% 59% 35% 12% 88% 53% 24% 57% 16% 18% 82% 53% 28% 26% 71%
  • 10. 8 than three times that of their black peers (24 percent) and more than twice that of Latinos (35 percent). By contrast, 79 percent of Asian students exceeded the standards. High school graduation. Far too few children in Atlanta are graduating from high school, a requirement even for most low-wage jobs.37 Although the graduation rate for Atlanta Public Schools has risen to almost 60 percent in recent years, it still lags behind the state and nearly all large U.S. school districts.38 A closer examination of this bleak picture, however, reveals an even starker reality for students of color. The 2014 graduation rate for white and Asian students was 84 percent and 94 percent, respectively, compared with 57 percent for black students and 53 percent for Latinos.39 Black and Latino students are more than three times more likely to drop out of school.40 Comparisons between Atlanta students and their peers across the state further illuminate the distinct barriers facing African-American children: While the school district’s white students graduate at a higher rate than their counterparts across the state, its African-American students lag behind their peers outside the city. Beyond increasing opportunities for the students themselves, improving the graduation rate for students of color — and, therefore, the city as a whole — would give a significant boost to the local economy in the form of more jobs, income and tax revenues.41 Factors Shaping Atlanta’s Educational Landscape A history of discrimination. Segregated school systems were based on the legal notion of “separate but equal.” The school systems established for white and black children in Atlanta and elsewhere, however, were far from equal. Atlanta did not open a high school for black students until 1924, more than 50 years after opening high schools for white students and after many other southern cities had already done so.42 Per-pupil expenditures in mid-century were nearly three times higher for white students.43 These funding differences increased in the 1960s, as the school board refused to reallocate resources to majority-black schools to account for the demographic shifts caused by more than 60,000 white students leaving the district.44 This uneven investment had a measurable effect on student learning. A 1968 study, for example, found that black fourth- graders lagged one year behind their white peers, while black eighth-graders lagged four years behind.45 Geography. Student achievement patterns correspond with the city’s north-south divide. Eleven of the district’s 14 top- performing elementary schools in third- grade reading are in northern Atlanta. The three others are charter schools that draw students from across the city.46 Student attendance. To succeed in school, children must actually attend. Missing just six days of school in a year for any reason affects student achievement and is a stronger predictor of not graduating from high school than standardized test scores.47 Housing instability and health conditions such as asthma, which lower- income families in particular tend to experience, often compromise student attendance.48 Only half of the school system’s black students missed fewer than six days in the 2013-2014 school year, compared with nearly 65 percent of their white peers. Black students also were nearly five times more likely to miss more than 15 days during the school year, well over the district’s threshold for truancy.49 Improving the graduation rate for students of color and the city as a whole would give a significant boost to the local economy in the form of more jobs, income and tax revenues.
  • 11. 9 AFRICAN AMERICAN ASIAN AND PACIFIC ISLANDER LATINO WHITE 15% 1% 5% 1% 25 20 15 10 5 0 ATLANTA PUBLIC SCHOOLS: OUT-OF-SCHOOL SUSPENSIONS BY RACE, 2014 Disciplinary issues resulting in out-of- school suspensions contribute to these absences. In 2011, for example, African Americans represented 80 percent of district students but 94 percent of out- of-school suspensions and 97 percent of expulsions.50 When examined by gender, the numbers are staggering. In 2014, the suspension rate for black male students (19 percent) was more than 13 times that of their white counterparts and more than twice the rate for their Latino peers. Though the rate among black female students was lower, at 11 percent, it far exceeds that for Latino and white female students (3 percent and 1 percent, respectively).51 Having access to quality learning experiences and opportunities from preschool through high school is an essential ingredient to student success — and one clearly missing for many young Atlantans of color, who struggle to reach key educational milestones. This ultimately jeopardizes their chances of graduating and for success beyond high school, particularly as they seek to enter the local workforce. ATLANTA PUBLIC SCHOOLS 12% SOURCE: Atlanta Public Schools analysis of 2013–2014 school year data.
  • 12. 10 MEDIAN HOUSEHOLD INCOME BY RACE ECONOMIC OPPORTUNITY A job and steady source of income are essential to moving out of poverty. Without the basic skills or credentials required to compete in today’s job market, many children in low-income families can end up struggling to make ends meet as adults. While the unemployment rate in Atlanta is 13 percent, the rate for African Americans (22 percent) is more than three times higher than that of their white counterparts (6 percent) and more than twice the rate for Latinos (9 percent).52 In short, although the majority of city residents are black, the majority of workers are white. Employment alone, however, does not pave the way out of poverty, especially for children in Atlanta’s low-income communities. Nearly 25 percent of Atlanta children born to parents at the bottom of the income ladder will remain there into adulthood, and less than half will make their way into the middle class.53 Most of those kids will be children of color, as a look at median household income by racial and ethnic groups attests. Between 2009 and 2013, the city’s white households earned a median income of nearly $85,000, more than three times the median income for African Americans and almost twice that of Latinos. Although Asian and Pacific Islanders fare somewhat better, their median household income was almost $30,000 less than that of white households.54 Factors Shaping Atlanta’s Economic Landscape Access to jobs. Most jobs in metro Atlanta are concentrated in the north, particularly those in the higher-paying information, professional, scientific and technical fields. But many south- side households do not have the cars that would help them tap into those opportunities. In fact, many of the NPUs with fewer job opportunities are home to more families without a vehicle. In five NPUs south of I-20, more than 30 percent of households do not own a vehicle, compared to less than 12 percent in five northern NPUs (see map on p. 12).55 Without their own cars, residents on the south side rely heavily on public transportation. Half of Metropolitan Atlanta Rapid Transit Authority (MARTA) riders use the system to commute to work. But though MARTA has fairly dense coverage within city limits, making it accessible to many low-income workers, it has fewer stops in the northern metro areas where jobs are concentrated.56 This severely limits employment options for workers from lower-income communities in south Atlanta, or requires them to EMPLOYMENT RATE, AGES 16-64 ATLANTA AFRICAN AMERICAN ASIAN AND PACIFIC ISLANDER LATINO WHITE ATLANTA AFRICAN AMERICAN ASIAN AND PACIFIC ISLANDER LATINO WHITE 86% 78% 91% 94% 93% $ 57,172 $ 84,944 $ 43,141 $ 26,605 $ 46,631 SOURCE: Neighborhood Nexus analysis of the U.S. Census Bureau’s 2009-2013 American Community Survey.
  • 13. 11 DOWNTOWN ATLANTA I Z A B P D H C J F R G X S W Y O N V T K L Q E M 285 285 75 85 20 85 20 Most parents have big dreams for their children and want to help them achieve their goals. They want to live in vibrant communities where their kids can play and grow, attend good schools and launch successful careers. But many city families face insurmountable hurdles — limited invest considerable time on public transportation to go where the jobs are — if the connections even exist. Workers who must drop off and pick up their kids from child care along the way must clear even more hurdles to get to work. A recent study found that commute time is one of the biggest predictors of moving up the economic ladder; the longer the average commute, the lesser the odds.57 City trends in job growth will likely only exacerbate the situation. The two NPUs that added more than 2,500 jobs in the two years following the recession — NPU-B and NPU-E — are in the northern and wealthier sections of Atlanta. Two of the three NPUs that lost more than 800 jobs during that period — NPU-S and NPU-X — are in the south, where there are more low- income residents.58 A lack of education and skills. Most well- paying jobs require some level of higher education.59 Yet among Atlantans ages 25 and older, only about half of African Americans and Latinos have some college experience, postsecondary certification or training.60 Barriers to employment. Ninety-two percent of Atlanta’s prison population is black.61 As these individuals are released, they are more likely to return to south- side neighborhoods. In 2014, for example, more than 200 formerly incarcerated individuals settled in NPU-M, whose neighborhoods include downtown Atlanta and the Old Fourth Ward, while fewer than 20 moved to the northern NPU-B. These individuals struggle to start a new life as their criminal records often keep them from even getting an interview. Even still, white job applicants with a criminal record are more likely to get a job interview than black applicants without one.62 Children Living in Families With Incomes at or Above 200% of Poverty, 2009-2013 SOURCE: Neighborhood Nexus analysis of the U.S. Census Bureau’s 2009-2013 American Community Survey. NOTE: Throughout this report, “low income” refers to families with incomes below 200 percent of the federal poverty threshold, which was $23,624 for a family of four in 2013. Thus a family of two adults and two children fell in the low-income category if their annual income was less than $47,248. Families with that little income often struggle to cover the cost of basic needs and expenses.  79 to < 94% 36 to < 79% 25 to < 36% 14 to < 25% 2 to < 14% education and job prospects, insufficient income to properly support their children’s growth and development — to making those dreams a reality. With few rungs on Atlanta’s economic ladder, moving out of poverty can be a steep, sometimes impossible climb for low-income families.
  • 14. 12 DOWNTOWN ATLANTA I Z A B P D H C J F R G X S W Y O N V T K L Q E M 285 285 75 85 20 85 20 ADULTS AGES 25 AND OLDER WITH SOME COLLEGE 32+68A 68% 51+49A 49% ATLANTA AFRICAN AMERICAN 11+89A 89% ASIAN AND PACIFIC ISLANDER 46+54A 54% 9+91A 91% LATINO WHITE Total Jobs by Neighborhood Planning Unit and Households Without a Car, 2008-2012 DOWNTOWN ATLANTA I Z A B P D H C J F R G X S W Y O N V T K L Q E M 285 285 75 85 20 85 20  62 to < 2,166   2,166 to < 3,132   3,132 to < 5,778  5,778 to < 10,190    10,190 to < 128,934  0 to < 8%  8 to < 12%  12 to < 27%  27 to < 33%  33 to < 38% Most metro Atlanta jobs, particularly in the higher-paying information, professional, scientific and technical fields, are concentrated in the north, but many south-side households do not have the cars that would help them tap into those opportunities. Many of the NPUs with fewer job opportunities are home to more families without a vehicle. In five NPUs south of I-20, more than 30 percent of households do not own a vehicle, compared to less than 12 percent in five northern NPUs. SOURCE: Neighborhood Nexus analysis of the U.S. Census Bureau’s 2009-2013 American Community Survey. SOURCE: Neighborhood Nexus analysis of the Atlanta Regional Commission’s 2012 employment estimates and the U.S. Census Bureau’s 2008-2012 American Community Survey. Total Jobs Households Without a Car (Percentage)
  • 15. 13 A TALE OF TWO CITIES: COMPARING ECONOMIC CONDITIONS AMONG NEIGHBORHOOD PLANNING UNITS With 40,000 residents, the total population of three south-side NPUs (S, T and V) is similar to that of the northern NPU-B, but, as closer study of the workforce in both areas reveals, the similarities end there. WORKERS WHO ARE AFRICAN AMERICAN 86+14A14% EDUCATION (BACHELOR’S DEGREE OR HIGHER) 69+31A31% LOW-INCOME WORKERS (LESS THAN $15,000 ANNUAL INCOME) 88+12A12% MIDDLE- AND UPPER-INCOME WORKERS (MORE THAN $40,000 ANNUAL INCOME) 47+53A65% WORKERS WHO ARE AFRICAN AMERICAN 21+79A79% EDUCATION (BACHELOR’S DEGREE OR HIGHER) 84+16A16% LOW-INCOME WORKERS (LESS THAN $15,000 ANNUAL INCOME) 70+30A30% MIDDLE- AND UPPER-INCOME WORKERS (MORE THAN $40,000 ANNUAL INCOME) 76+24A24% NPU-B NPU-S, T and V VS. SOURCE: Neighborhood Nexus analysis of the U.S. Census Bureau’s 2009-2013 American Community Survey and 2011 Longitudinal Employer-Household Dynamics. NOTE: Because the Longitudinal Employer-Household Dynamics data only include educational attainment information for about two-thirds of workers, the actual percentage of workers with at least a bachelor’s degree is likely higher.
  • 16. 14 RECOMMENDATIONS Our hope is to contribute to a new dialogue and a citywide effort that enables public, private, nonprofit, philanthropic and community leaders to ensure Atlanta lives up to its rich legacy. But first, a note on the importance of data. For a clear and accurate picture of how all Atlanta children and families are faring — and to properly inform city policies, programs and decision making — we must have publicly available data on child and family well-being that are disaggregated by race, ethnicity and neighborhood. Developing data on additional factors that affect well- being, such as neighborhood investment patterns and community assets, warrants further consideration to fully understand their impact on racial and ethnic groups. This fundamental need, which touches all of our suggestions here, calls for a thorough assessment of the collection of, and public access to, data that help illuminate what contributes to inequities. RECOMMENDATION 1 Increase investments in low-income communities to support their — and the city’s — economic growth. Develop and preserve affordable and quality housing. Having quality affordable housing is key to community stability, safety and health. To ensure such housing is available throughout Atlanta, city officials and the business and philanthropic communities should foster mixed-income communities near transit and job centers. Public resources should help prevent longtime residents from being priced out of their homes by using such tools as fair property tax policy and low-interest home rehabilitation loans and expanding homeowner education programs. A housing trust fund similar to the one established for the Atlanta BeltLine, the 22-mile development project underway to replace underused rail beds encircling downtown with trails, parks and transit, could help ensure major development projects include affordable housing. Community land trusts that preserve the affordability of homes and inclusionary zoning policies that require incorporating affordable Too many of Atlanta’s children and families, especially those of color, encounter considerable challenges that impede their ability to achieve their full potential. In this section, we highlight several recommendations that could begin removing those barriers and build paths to opportunity for all children, families and communities.
  • 17. 15 homes into new projects could further encourage such development. Promote equitable development practices. Community-based and citywide development can produce vibrant communities that benefit diverse racial, ethnic and socioeconomic groups. When large-scale developments are planned in low-income communities, public and private employers could work with nonprofits focused on skill building to create local hiring strategies, and community benefits agreements could help make sure residents most affected can access project-related jobs. Build the capacity of low- to moderate- income entrepreneurs and enterprises in communities of color, and bolster the local economy by supporting businesses in low- income neighborhoods. Many distressed communities experience blight and crime, but using public and private capital to support new businesses and microenterprises63 can help expand the neighborhood asset base. Investments in training programs for microbusiness ownership can offer a path to financial stability for many low- to moderate- income families. The Neighborhood Development Center in St. Paul, Minn., for example, works to position budding entrepreneurs in low-income communities of color to invest in their neighborhood’s revitalization. Since 1993, more than 500 of its graduates have launched businesses, sustaining 2,200 jobs and returning $64 million to their communities in payroll, taxes and rent annually.64 Moreover, although universities and hospitals spend more than $1 trillion nationally each year, little of that buying power is deliberately targeted toward building up their surroundings.65 Atlanta is home to several major universities and hospitals, community colleges and government agencies that could explore ways to redirect and increase business to low-income neighborhoods and minority- and women-owned businesses. RECOMMENDATION 2 Support strategies that prepare young children and youth for success in school and beyond. Improving Atlanta’s high school graduation rate has implications beyond the potential of each graduate: The local economy would benefit, too. A higher graduation rate in metro Atlanta alone could result in nearly 2,000 jobs, $271 million in increased annual earnings and $25 million more in state and local tax revenues, according to one study.66 But we must set the stage for children’s academic success starting in their earliest years. Increase access to high-quality early child care and education. The state of Georgia, in partnership with Georgia Early Education Alliance for Ready Students, has launched a rating system for public and private early education programs that offers incentives for enrolling and adopting higher standards than those required for state licensing. Public and private leaders should provide ongoing and additional incentives to early education programs in Atlanta’s low- income communities and neighborhoods with limited access to quality early education to help improve the care they provide. Beyond improving access to quality early education, more programs should incorporate evidence-based strategies for preparing children to enter kindergarten ready to learn and to excel in their elementary years. The Get Georgia Reading Campaign, which aims to To advance the local economy and give all children the chance to contribute to it, Atlanta must address the barriers to opportunity for many in the city and region.
  • 18. 16 ensure all state children are reading proficiently by the end of third grade, has identified key elements that keep kids developmentally on track in their early years and launched several pilot programs related to these essential elements in and around Atlanta. One program, for example, trains professionals who already interact regularly with families, including nurses, on ways to encourage parents to talk with their young children, thereby fostering early development.67 Promote productive learning environments that support student attendance and achievement. Schools can help improve attendance rates and increase student achievement.68 Georgia’s new School Climate Star Rating evaluates the learning environment of all the state’s public schools and offers guidance to help educators make their schools safer and more engaging for all students, thereby increasing attendance. Atlanta Public Schools should continue to expand and deepen implementation of the evidence-based Positive Behavioral Interventions and Supports69 (PBIS) approach — which helps parents and staff foster a safe, supportive and positive learning environment — and use the School Climate Star Rating to measure progress and identify schools that need to adopt PBIS. Through private funding, the district has begun a pilot program with early learning centers to improve learning environments from infancy through third grade. Advance equity across the district. Not all Atlanta schools offer the same quality of education. In fact, “substantial variations” exist across schools in terms of teacher quality, academic programming, classroom instruction, financial support from private sources and playgrounds.70 Private, philanthropic and public leaders should work with Atlanta Public Schools to help ensure its resources are spread equitably. Schools serving children who live in low-income communities must have the necessary tools — e.g., funding, health services, expert teachers and leadership — to support student achievement. RECOMMENDATION 3 Pursue strategies to improve employment opportunities for local residents. Foster alignment and the sharing of information among employers and job- training programs. Strong partnerships across Atlanta’s business community, institutions of higher education and the workforce development field are essential to attract and retain new and innovative business ventures and create more concrete pathways to employment for low-income residents. To meet the needs of employers, people must have access to training programs that prepare them for family-supporting jobs. In a survey of 200 metro Atlanta organizations with employment or job-training programs, less than one- third reported working directly with an employer.71 Metro Atlanta eXchange for Workforce Solutions, a forum for strengthening connections and practices among workforce development organizations, can help employment and training programs align their services with employers’ needs. It also can facilitate stronger links between employers, trade associations, chambers of commerce and state and local economic development entities to foster more coordinated, forward-looking strategies for regional growth. Support sector-specific training programs. Equipping low-skilled workers to meet the needs of employers in particular industries benefits businesses and allows underemployed individuals to move Most parents have big dreams for their children, but many Atlanta families face insurmountable hurdles to making those dreams a reality.
  • 19. 17 up the career ladder and better support their families. Atlanta CareerRise, for example, uses a nationally recognized job-readiness model that trains low- skilled workers for jobs in high-growth industries such as health care and information technology. The program has built solid relationships with employers in these sectors, and the White House has recognized its Atlanta Beltline Healthcare Partnership, which prepares people for careers in nursing, as one of 35 model “Programs That Work.”72 Such sector-specific strategies should be expanded and employed in other emerging industries. Reduce barriers to employment. The research is clear: Securing stable employment is the best indicator of whether a person with a criminal record will be arrested again.73 Earlier this year, Gov. Nathan Deal “banned the box” on all state government employment applications, postponing questions about criminal history until an applicant is identified as one of the most qualified candidates. Applicants also must have the chance to explain their criminal history before denial, and only a relevant conviction can be used to disqualify a candidate. Similar policies have already demonstrated their power. A Philadelphia-based study found that hiring 100 formerly incarcerated people would reduce recidivism, leading to increased income tax contributions of $1.9 million, an additional $770,000 in sales tax revenue and $2 million in annual savings.74 Private-sector employers should take this approach in their own hiring practices, further expanding opportunities for individuals with criminal records. In addition, expanding public transit systems and better integrating transportation and housing development projects can help address the lack of affordable housing in the areas where well-paying jobs are concentrated. The Atlanta Transit Oriented Development Collaborative, a partnership of nonprofits and government agencies, is one of many groups working to remove barriers to and create incentives for equitable transit- oriented development in metro Atlanta, while increasing public awareness of its benefits. Garnering public support is key to the success of such efforts.
  • 20. 18 CONCLUSION Instead of relying on children to beat the odds, we must act now to change the odds so that all children in Atlanta have the chance to succeed. While many in the city and region have worked to that end for decades, we cannot deny that dynamics of race and place together continue to put needless barriers in the way of thousands of children. The combined efforts of the public, philanthropic and private sectors, including the business community, will be essential to removing those barriers. The city’s future rests on the shoulders of the more than 80,000 children who call it home. Their story will be Atlanta’s story. How it unfolds depends on what we do today to craft a new and promising future for this generation and the ones to come. ACKNOWLEDGMENTS This report was written by Janelle Williams and Sarah Torian, an independent consultant. Casey staff who contributed to this publication include Arin Gencer, Charles Rutheiser and Nonet Sykes. This report would not have been possible without the help of JustPartners Inc. and Partnership for Southern Equity. A special thank you to Neighborhood Nexus and Atlanta Public Schools for providing data analysis. Instead of relying on children to beat the odds, we must change the odds so that all children in Atlanta can succeed.
  • 21. 19 1. A phrase coined during the administration of Mayor Ivan Allen, who embraced a moderate stance on racial issues to prevent protests experienced in other southern cities. 2. Metro Atlanta Chamber. (2014). Metro Atlanta Fortune 500 Fortune 1000 headquarters. Retrieved from www.metroatlantachamber./ docs/default-source/resources/2014-fortune- headquarters.pdf?sfvrsn=4. With a $284 billion gross metropolitan product, the Atlanta area’s economy ranks 10th among U.S. metro areas. 3. Berube, A. (2014, February 20). All cities are not created unequal. Metropolitan Opportunity Series, Number 51 of 65. Washington, DC: Brookings Institution. Retrieved from www.brookings.edu/ research/papers/2014/02/cities-unequal-berube. And, Chetty, R., Hendren, N., Kline, P., Saez, E. (2014). Where is the land of economic opportunity? The geography of intergenerational mobility in the United States. Quarterly Journal of Economics, 129(4). Retrieved from http://qje. oxfordjournals.org/content/early/2014/10/16/qje. qju022.full 4. Established by Maynard Jackson, the NPU system divides Atlanta into 25 units through which residents can influence zoning, land use and other planning decisions in their community. For more, see www.atlantaga.gov/index.aspx?page=739. 5. Treuhaft, S., Scoggins, J., Tran, J. (2014, October 22). The equity solution: Racial inclusion is key to growing a strong new economy. Oakland, CA: PolicyLink. Retrieved from www.policylink.org/ sites/default/files/Equity_Solution_Brief.pdf 6. Barber, B. (2012, June 14). Racial diversity increases, but segregation persists says geography professor. Dartmouth Now. 7. Neighborhood Nexus analysis of 2010 U.S. Census Bureau data. The 12 southern NPUs: H, I, J, K, P, Q, R, S, T, V, X and Z. The six northern NPUs: A, B, C, E, F and N. 8. Neighborhood Nexus analysis of the U.S. Census Bureau’s 2008-2012 American Community Survey for vehicle availability and the 2011 Longitudinal Employer-Household Dynamics for job locations. 9. Berube, A. (2014, February 20). 10. U.S. Census Bureau. (n.d). Quick facts beta. Retrieved on May 22, 2015, from www.census. gov/quickfacts/table/IPE120213/00,1304000 11. Atlanta Regional Commission. (2015, February 11). Housing affordability in Metro Atlanta: It’s complicated. Retrieved from www.slideshare.net/ ARCResearch/housing-affordability-fulldeck 12. Since 2000, Casey has focused specifically on Atlanta’s Neighborhood Planning Unit V (NPU-V), a set of neighborhoods just south of downtown, seeking to improve the lives of children and families and strengthen their communities. ENDNOTES 13. The Annie E. Casey Foundation. (2014). Race for results: Building a path to opportunity for all children (KIDS COUNT Policy Report). Baltimore, MD: Author. Retrieved from www. aecf.org/race4results 14. This includes recent efforts to collect and analyze data so that community-based organizations and local leaders have the information needed to advocate for better and more even access to quality education, jobs and public transportation for all Atlantans. 15. This report draws on data from various entities that define “metropolitan Atlanta” differently, from Atlanta Regional Commission’s 10-county metro region to the Atlanta Metropolitan Statistical Area that now includes 29 counties surrounding the city. 16. Atlanta Regional Commission. (2011, April). Regional snapshot: A decade of change in the Atlanta region: A closer look at the 2010 Census. Atlanta, GA: Author. 17. Atlanta Regional Commission. (2011, April). 18. Atlanta Regional Commission. (2011, April). Even this dynamic has been shifting since 2000, with many black residents moving from the city to the suburbs. 19. The Annie E. Casey Foundation. (2014). Creating opportunity for families: A two-generation approach (KIDS COUNT Policy Report). Baltimore, MD: Author. Retrieved from www.aecf.org/resources/ creating-opportunity-for-families 20. The Annie E. Casey Foundation. (2012). Children living in high-poverty communities (KIDS COUNT Data Snapshot). Baltimore, MD: Author. Retrieved from www.aecf.org/resources/ data-snapshot-on-high-poverty-communities 21. Neighborhood Nexus analysis of the U.S. Census Bureau’s 2008-2012 American Community Survey. The two NPUs with poverty rates less than 19 percent are P and Q. The five with rates over 40 percent are J, L, V, Y and Z. The federal poverty threshold is based on the U.S. Census Bureau’s definition for a family of two adults and two children in 2013. 22. Holliman, I. V. (2010). From “Crackertown” to the “ATL”: Race, urban renewal, and the re-making of downtown Atlanta, 1945-2000. Doctoral dissertation, University of Georgia. And, Brown- Nagin, T. (2011). Courage to dissent: Atlanta and the long history of the civil rights movement. New York, NY: Oxford University Press. 23. Rich, M., Owens, M. L., Griffiths, E., Haspel, M., Hill, K., Smith, A., Stigers, K. (July 2010). Evaluation of the McDaniel Glenn HOPE VI revitalization: Final report. Atlanta, GA: Emory University. Retrieved from www. atlantahousing.org/pdfs/HOPE%20VI%20 Evaluation_McDaniel%20Glenn_2010_07. pdf. The McDaniel Glenn complex was located in NPU-V. To ease the transition for relocating residents, the Casey Foundation worked with the Atlanta Housing Authority to arrange for additional support services for families. 24. U.S. Department of Housing and Urban Development. (2012, May 21). Affordable housing. Retrieved May 20, 2015, from http:// portal.hud.gov/hudportal/HUD?src=/program_ offices/comm_planning/affordablehousing 25. Neighborhood Nexus analysis of the U.S. Census Bureau’s 2008-2012 American Community Survey, focused on the number of occupied housing units that spend more than 30 percent of annual income on housing. The six northern NPUs: A, B, C, D, E and F. The 11 southern NPUs: H, I, J, K, R, S, T, V, X, Y and Z. 26. Market Street Services Inc. for Atlanta Regional Commission. (2012, April 26). Competitive assessment metro Atlanta. Atlanta, GA: Author. Retrieved from www.atlantaregional.com/File%20Library/Local %20Gov%20Services/Econ%20Dev%20Strategy/ Metro-Atlanta-Competitive-Assessment.pdf 27. Brown, D. (2012, December 10). How home ownership keeps blacks poorer than whites. Forbes Magazine. 28. Bureau of Labor Statistics. (2015, April 2). Employment projections, earnings and unemployment rates by educational attainment. Retrieved from www.bls.gov/emp/ep_chart_001. htm. Data are for ages 25 and older; earnings, for full-time wage and salary workers. 29. The Annie E. Casey Foundation. (2013). The first eight years: Giving kids a foundation for lifetime success (KIDS COUNT Policy Report). Baltimore, MD: Author. Retrieved from www. aecf.org/resources/the-first-eight-years-giving- kids-a-foundation-for-lifetime-success 30. Center on the Developing Child at Harvard University. (2007). A science-based framework for early childhood policy: Using evidence to improve outcomes in learning, behavior, and health for vulnerable children. Cambridge, MA: Author. Retrieved from http://developingchild.harvard. edu/index.php/resources/reports_and_working_ papers/policy_framework 31. Neighborhood Nexus analysis of the U.S. Census Bureau’s 2009-2013 American Community Survey. 32. Bright from the Start: Georgia Department of Early Care and Learning. (n.d.). Data retrieved from www.decal.ga.gov/ProviderSearch/ SiteSearch.aspx?prekonly=ynewsearch=y 33. Quality Rated. (n.d.). How quality rated impacts Georgia. Retrieved from http://qualityrated. org/how-quality-rated-impacts-georgia. Frank Porter Graham Child Development Institute at the University of North Carolina conducted the evaluation. And, Bright from the Start: Georgia Department of Early Care and Learning. (n.d.) Data retrieved from www.decal.ga.gov/ProviderSearch/ SiteSearch.aspx?prekonly=ynewsearch=y
  • 22. 20 34. The Annie E. Casey Foundation. (2013). Early warning confirmed: A research update on third- grade reading (KIDS COUNT Data Snapshot). Baltimore, MD: Author. Retrieved from www. aecf.org/resources/early-warning-confirmed 35. The Annie E. Casey Foundation. (2010). Early warning! Why reading by the end of third grade matters. Baltimore, MD: Author. Retrieved from www.aecf.org/resources/early-warning-why- reading-by-the-end-of-third-grade-matters 36. According to the 2010 U.S. Census, APS served almost 90 percent (49,000) of city children and youth ages 5–18. We therefore focus specifically on the school district in this report, as it represents the lion’s share of children. 37. Shierholz, H. (2009). Fix it and forget it: Index the minimum wage to growth in average wages. Washington, DC: Economic Policy Institute. Retrieved from http://epi.3cdn. net/91fd33f4e013307415_rum6iydua.pdf 38. Balfanz, R., Bridgeland, J. M., Fox, J. H., DePaoli, J. L., Ingram, E. S., Maushard, M. (2014). Building a Grad Nation: Progress and challenge in ending the high school dropout epidemic. Annual update, 2014. Washington, DC: Civic Enterprises. Retrieved from http:// gradnation.org/sites/default/files/17548_BGN_ Report_FinalFULL_5.2.14.pdf 39. Atlanta Public Schools analysis of 2013–2014 school year data. 40. Ibid. 41. Alliance for Excellent Education. (2013, October 15). The economic benefits of increasing the high school graduation rate for public school students: Atlanta-Sandy Springs-Marietta. Retrieved on May 21, 2015, from http://all4ed.org/ reports-factsheets/the-economic-benefits-of- increasing-the-high-school-graduation-rate-for- public-school-students-in-atlanta-sandy-springs- marietta-georgia 42. Brown-Nagin, T. (2011). 43. Tillery, C. (2006). Southern homecoming traditions: Recipes and remembrances. New York, NY: Kensington Publishing Corp. 44. Kruse. K. (2007). White flight: Atlanta and the making of modern conservatism. Princeton, NJ: Princeton University Press. 45. Bringslid, D. (2011, May). Determining the implications of resegregation in the Atlanta public school system and its effect on student achievement. Undergraduate thesis, Georgia Institute for Technology. 46. Neighborhood Nexus analysis of third-grade reading scores for the state’s Criterion-Referenced Competency Tests, from the Governor’s Office of Student Achievement. 47. Kramer, D. (2012, March). Present and accounted for. American School Board Journal (pp. 28-29). 48. Race Matters Institute. (2013). Race matters in early school attendance. Baltimore, MD: Author. Retrieved from http://racemattersinstitute.org/ resources/earlyschoolattendance 49. Neighborhood Nexus analysis of attendance data for the 2013-2014 school year from the Governor’s Office of Student Achievement. Retrieved from http://gosa.georgia.gov/ downloadable-data 50. U.S. Department of Education. (n.d.). Civil rights data collection: Atlanta Public Schools, Atlanta, GA. Retrieved on May 21, 2015, from http://ocrdata. ed.gov/Page?t=deid=28846syk=6pid=736 51. Atlanta Public Schools analysis of 2013–2014 school year data. 52. Neighborhood Nexus analysis of the U.S. Census Bureau’s 2009-2013 American Community Survey. 53. Leonhardt, D. (2013, July 22). In climbing income ladder, location matters. New York Times. Retrieved from www.nytimes.com/2013/07/22/ business/in-climbing-income-ladder-location- matters.html?pagewanted=all_r=0 54. Neighborhood Nexus analysis of the U.S. Census Bureau’s 2009-2013 American Community Survey. 55. Neighborhood Nexus analysis of the U.S. Census Bureau’s 2008-2012 American Community Survey. The four southern NPUs: R, T, V and X. The four northern NPUs: A, B, C and D. 56. Clarke, W., Kane, S., Shepherd, T. (December 2012). The economic impact of the Metropolitan Atlanta Rapid Transit Authority on the economy and labor mobility of the region. Athens, GA: The University of Georgia, Carl Vinson Institute of Government. Retrieved from www.caes. uga.edu/center/caed/pubs/2012/documents/ MARTAFinalReport.pdf. And, Neighborhood Nexus analysis of the Atlanta Regional Commission’s 2012 employment estimates, overlaid with MARTA’s bus stop coverage. 57. Chetty, R., Hendren, N. (2015, May). The impacts of neighborhoods on intergenerational mobility: Childhood exposure effects and county-level estimates. Cambridge, MA: Harvard University and NBER. Retrieved from www.equality-of- opportunity.org/images/nbhds_paper.pdf 58. Neighborhood Nexus analysis of U.S. Census Bureau’s 2008-2012 American Community Survey and the Atlanta Regional Commission’s 2012 employment estimates. 59. Carnevale, A. P., Smith, N., Strohl, J. (2010, June). Help wanted: Projections of jobs and education requirements through 2018. Washington, DC: Georgetown University, Georgetown Public Policy Institute, Center on Education and the Workforce. Retrieved from cew.georgetown.edu/jobs2018 60. Neighborhood Nexus analysis of the U.S. Census Bureau’s 2008-2012 American Community Survey. 61. Neighborhood Nexus analysis of prisoner release data from the Georgia Department of Corrections. Data reflect the prison population as of Jan. 1, 2015. 62. Pager, D. (2003). The mark of a criminal record. American Journal of Sociology, 108(5): 937-975. And, Holzer, H. (2007, October). Collateral costs: The effects of incarceration on the employment earnings of young workers. IZA Discussion Paper No. 3118. 63. Microenterprises are very small businesses, usually with less than a handful of employees. 64. The Annie E. Casey Foundation. (2015). Expanding economic opportunity: Lessons from the East Baltimore Revitalization Initiative. Baltimore, MD: Author. Retrieved from www.aecf.org/ resources/expanding-economic-opportunity 65. The Democracy Collaborative. (2014). Policies for community wealth building: Leveraging state and local resources. Retrieved from http:// democracycollaborative.org/sites/clone.community- wealth.org/files/downloads/PoliciesForCommunity WealthBuilding-September2014-final.pdf 66. Alliance for Excellent Education. (2013, October 15). 67. To learn more about the campaign and the pilot program, see www.getgeorgiareading.org and www.talkwithmebaby.org. 68. Attendance Works. (n.d.) AttendanceWorks: Advancing student success by reducing chronic absence. Retrieved May 21, 2015, from www.attendanceworks.org 69. To learn more about PBIS, visit www.pbis.org. Atlanta Public Schools calls its program Positive Behavioral Supports (see www.nasponline.org/ publications/cq/cq352pbs_ho.aspx). 70. Fortner, C. K., Faust-Berryman, A., Keehn, G. T. (2014, July). Atlanta Public Schools equity audit report. 71. Survey completed by the Metro Atlanta eXchange for Workforce Solutions, 2014. 72. PRWEB. (2014, July 24). President cites Atlanta BeltLine Workforce Partnership in Healthcare as national model. Retrieved from www.prweb.com/ releases/2014/07/prweb12044260.htm 73. Samuels, P., Mukamal, D. (2004). After prison, roadblocks to reentry: A report on state legal barriers facing people with criminal records. New York, NY: Legal Action Center. 74. Economy League of Greater Philadelphia. (2011, September). Economic benefits of employing formerly incarcerated individuals in Philadelphia. Philadelphia, PA: Author. Retrieved from http:// economyleague.org/files/ExOffenders_-_Full_ Report_FINAL_revised.pdf
  • 23. 21
  • 24. 2 THE ANNIE E. CASEY FOUNDATION 701 St. Paul Street    Baltimore, MD 21202    410.547.6600    www.aecf.org