Downloaded 40 times


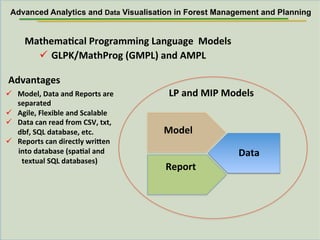

![ForestValue,
FOLPI-‐based
Model
Formula9on
ü LP
Model
–
Model
II
Formula9on
(
2
or
more
Rota9ons)
Ø Objec9ve
Func9on
-‐
Maximise
Revenue
or
Volume
Ø Structural
Constraints
of
FOLPI
-‐
Area
Must
be
Replanted
-‐
Area
Must
be
Harvested
-‐
Ini9al
Area
Must
be
Harvested
Ø Variables
-‐
Y[t,i,j]
-‐>
Forest
area
to
be
harvested
/
cut
-‐
X[t,i,j]
-‐>
Forest
area
to
be
replanted
-‐
Z[t,I,j]
-‐>
Forest
area
to
be
transferred
Advanced Analytics and Data Visualisation in Forest Management and Planning](https://image.slidesharecdn.com/ensicadforesttech2017part1-171122203514/85/Advanced-Analytics-and-Data-Visualisation-in-Forest-Management-and-Planning-17-320.jpg)


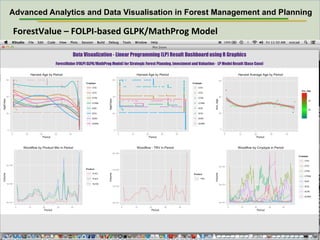
![Spa9al
MIP
Models
Formula9on
(Model
I)
ü MIP
Model
–
Model
I
Formula9on
Ø Objec9ve
Func9on
-‐
Maximise
Revenue
or
Volume
Ø Constraints
-‐
Total
sum
of
forest
blocks
/
stands
<=
Total
Area
-‐
Non
Declining
Volume
(TRV)
-‐
No
Adjacency
of
forest
blocks
/
stands
X[t,i,j]
-‐>
Forest
Stand
to
be
harvested
by
Period
(t),
Croptype
(i)
and
AgeClass
(j)
X[t,i,j]
is
binary
(0/1)
TRV[t]
>
Total
Recoverable
Volume
MAI[t]
-‐>
MAI
(Mean
Annual
Increment
(m3/yr)
Ø Variables
Advanced Analytics and Data Visualisation in Forest Management and Planning](https://image.slidesharecdn.com/ensicadforesttech2017part1-171122203514/85/Advanced-Analytics-and-Data-Visualisation-in-Forest-Management-and-Planning-24-320.jpg)
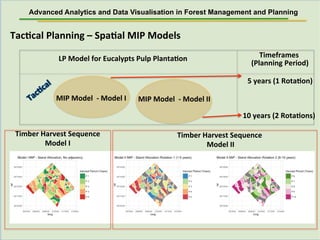
![Spa9al
MIP
Models
Formula9on
(Model
II
ü MIP
Model
–
Model
II
Formula9on
(
2
Rota9ons)
Ø Objec9ve
Func9on
-‐
Maximise
Revenue
or
Volume
Ø Addi9onal
Constraints
-‐
Total
sum
of
forest
blocks
/
stands
<=
Total
Area
-‐
Non
Declining
Volume
(TRV)
-‐
No
Adjacency
of
forest
blocks
/
stands
Ø Structural
Constraints
of
FOLPI
-‐
Area
Must
be
Replanted
-‐
Area
Must
be
Harvested
-‐
Ini9al
Area
Must
be
Harvested
Ø Binary
Variables
(0/1)
-‐
Y[t,i,j]
-‐>
Forest
area
to
be
harvested
/
cut
-‐
X[t,i,j]
-‐>
Forest
area
to
be
replanted
Advanced Analytics and Data Visualisation in Forest Management and Planning](https://image.slidesharecdn.com/ensicadforesttech2017part1-171122203514/85/Advanced-Analytics-and-Data-Visualisation-in-Forest-Management-and-Planning-25-320.jpg)


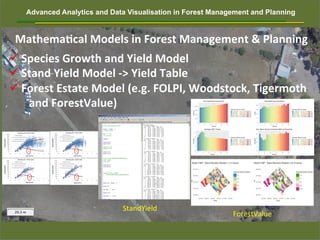
The document discusses advanced analytics and data visualization tools for effective forest management and planning, emphasizing the use of autonomous UAVs for mapping and remote sensing. It outlines various mathematical models and programming techniques designed to optimize forest resource management, including linear and mixed-integer programming models. Additionally, it highlights the potential partnerships for UAV mapping services and consulting in forest estate modeling targeted at small tree growers in New Zealand and Australia.