Download to read offline
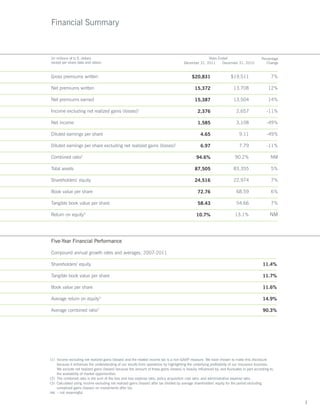


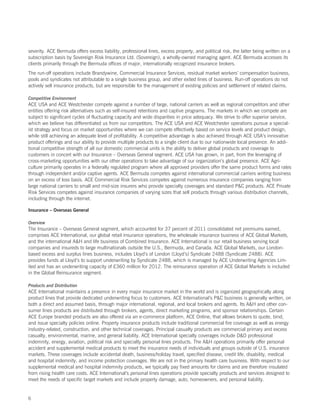


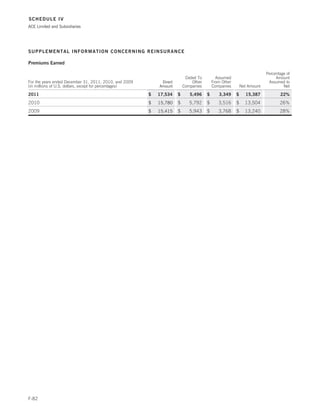


ACE Limited is one of the world's largest property and casualty insurers operating in 53 countries. In 2011, ACE reported $15.4 billion in net premiums earned. While 2011 was a challenging year due to natural catastrophes and soft market conditions, ACE outperformed peers with an 11% operating ROE. ACE focuses on diversification across products and geographies to balance exposure to pricing cycles, with around half of premiums from lines like accident and health less impacted by cycles.


