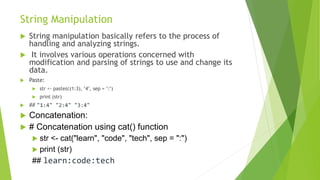
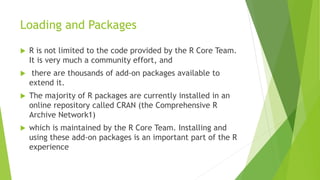
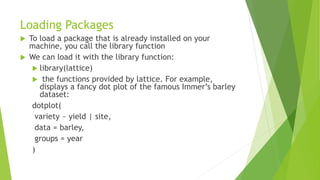
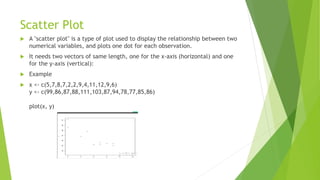
Variable Scope
 A variable’s scope is the set of places from which you can see the variable.
For example, when you define a variable inside a function, the rest of the
statements in that function will have access to that variable.
 In R subfunctions will also have access to that variable.
 In this next example, the function f takes a variable x and passes it to the
function g. f also defines a variable y, which is within the scope of g, since g
is a sub‐ function of f.
 So, even though y isn’t defined inside g, the example works:
 f <- function(x)
 {
 y <- 1
 g <- function(x)
 {
 (x + y) / 2 #y is used, but is not a formal argument of g }
 g(x)
 }
 f(sqrt(5)) #It works! y is magically found in the environment of f
 ## [1] 1.618
String Manipulation
 String manipulation basically refers to the process of
handling and analyzing strings.
 It involves various operations concerned with
modification and parsing of strings to use and change its
data.
 Paste:
 str <- paste(c(1:3), "4", sep = ":")
 print (str)
 ## "1:4" "2:4" "3:4"
 Concatenation:
 # Concatenation using cat() function
 str <- cat("learn", "code", "tech", sep = ":")
 print (str)
## learn:code:tech
Packages and Visualization
Loading and Packages
 R is not limited to the code provided by the R Core Team.
It is very much a community effort, and
 there are thousands of add-on packages available to
extend it.
 The majority of R packages are currently installed in an
online repository called CRAN (the Comprehensive R
Archive Network1)
 which is maintained by the R Core Team. Installing and
using these add-on packages is an important part of the R
experience
Loading Packages
 To load a package that is already installed on your
machine, you call the library function
 We can load it with the library function:
 library(lattice)
 the functions provided by lattice. For example,
displays a fancy dot plot of the famous Immer’s barley
dataset:
dotplot(
variety ~ yield | site,
data = barley,
groups = year
)
Scatter Plot
 A "scatter plot" is a type of plot used to display the relationship between two
numerical variables, and plots one dot for each observation.
 It needs two vectors of same length, one for the x-axis (horizontal) and one
for the y-axis (vertical):
 Example
 x <- c(5,7,8,7,2,2,9,4,11,12,9,6)
y <- c(99,86,87,88,111,103,87,94,78,77,85,86)
plot(x, y)
P<- ggplot(mtcars,aes(wt,mpg) )
p+geom_point()
P<- ggplot(mtcars,aes(wt,mpg) )
p+geom_line(color=blue)
Box_plot()
ggplot(data = mpg, aes(x = drv, y = hwy,
colour = class)) +
geom_boxplot()
Geom_bar()
g <- ggplot(mpg, aes(class))
# Number of cars in each class:
g + geom_bar()

欧洲杯竞猜-欧洲杯竞猜下注平台-欧洲杯竞猜投注平台|【​网址​🎉ac44.net🎉​】

  • 1.
    Variable Scope  Avariable’s scope is the set of places from which you can see the variable. For example, when you define a variable inside a function, the rest of the statements in that function will have access to that variable.  In R subfunctions will also have access to that variable.  In this next example, the function f takes a variable x and passes it to the function g. f also defines a variable y, which is within the scope of g, since g is a sub‐ function of f.
  • 2.
     So, eventhough y isn’t defined inside g, the example works:  f <- function(x)  {  y <- 1  g <- function(x)  {  (x + y) / 2 #y is used, but is not a formal argument of g }  g(x)  }  f(sqrt(5)) #It works! y is magically found in the environment of f  ## [1] 1.618
  • 3.
    String Manipulation  Stringmanipulation basically refers to the process of handling and analyzing strings.  It involves various operations concerned with modification and parsing of strings to use and change its data.  Paste:  str <- paste(c(1:3), "4", sep = ":")  print (str)  ## "1:4" "2:4" "3:4"  Concatenation:  # Concatenation using cat() function  str <- cat("learn", "code", "tech", sep = ":")  print (str) ## learn:code:tech
  • 4.
  • 5.
    Loading and Packages R is not limited to the code provided by the R Core Team. It is very much a community effort, and  there are thousands of add-on packages available to extend it.  The majority of R packages are currently installed in an online repository called CRAN (the Comprehensive R Archive Network1)  which is maintained by the R Core Team. Installing and using these add-on packages is an important part of the R experience
  • 6.
    Loading Packages  Toload a package that is already installed on your machine, you call the library function  We can load it with the library function:  library(lattice)  the functions provided by lattice. For example, displays a fancy dot plot of the famous Immer’s barley dataset: dotplot( variety ~ yield | site, data = barley, groups = year )
  • 7.
    Scatter Plot  A"scatter plot" is a type of plot used to display the relationship between two numerical variables, and plots one dot for each observation.  It needs two vectors of same length, one for the x-axis (horizontal) and one for the y-axis (vertical):  Example  x <- c(5,7,8,7,2,2,9,4,11,12,9,6) y <- c(99,86,87,88,111,103,87,94,78,77,85,86) plot(x, y)
  • 8.
  • 9.
  • 10.
    Box_plot() ggplot(data = mpg,aes(x = drv, y = hwy, colour = class)) + geom_boxplot()
  • 11.
    Geom_bar() g <- ggplot(mpg,aes(class)) # Number of cars in each class: g + geom_bar()