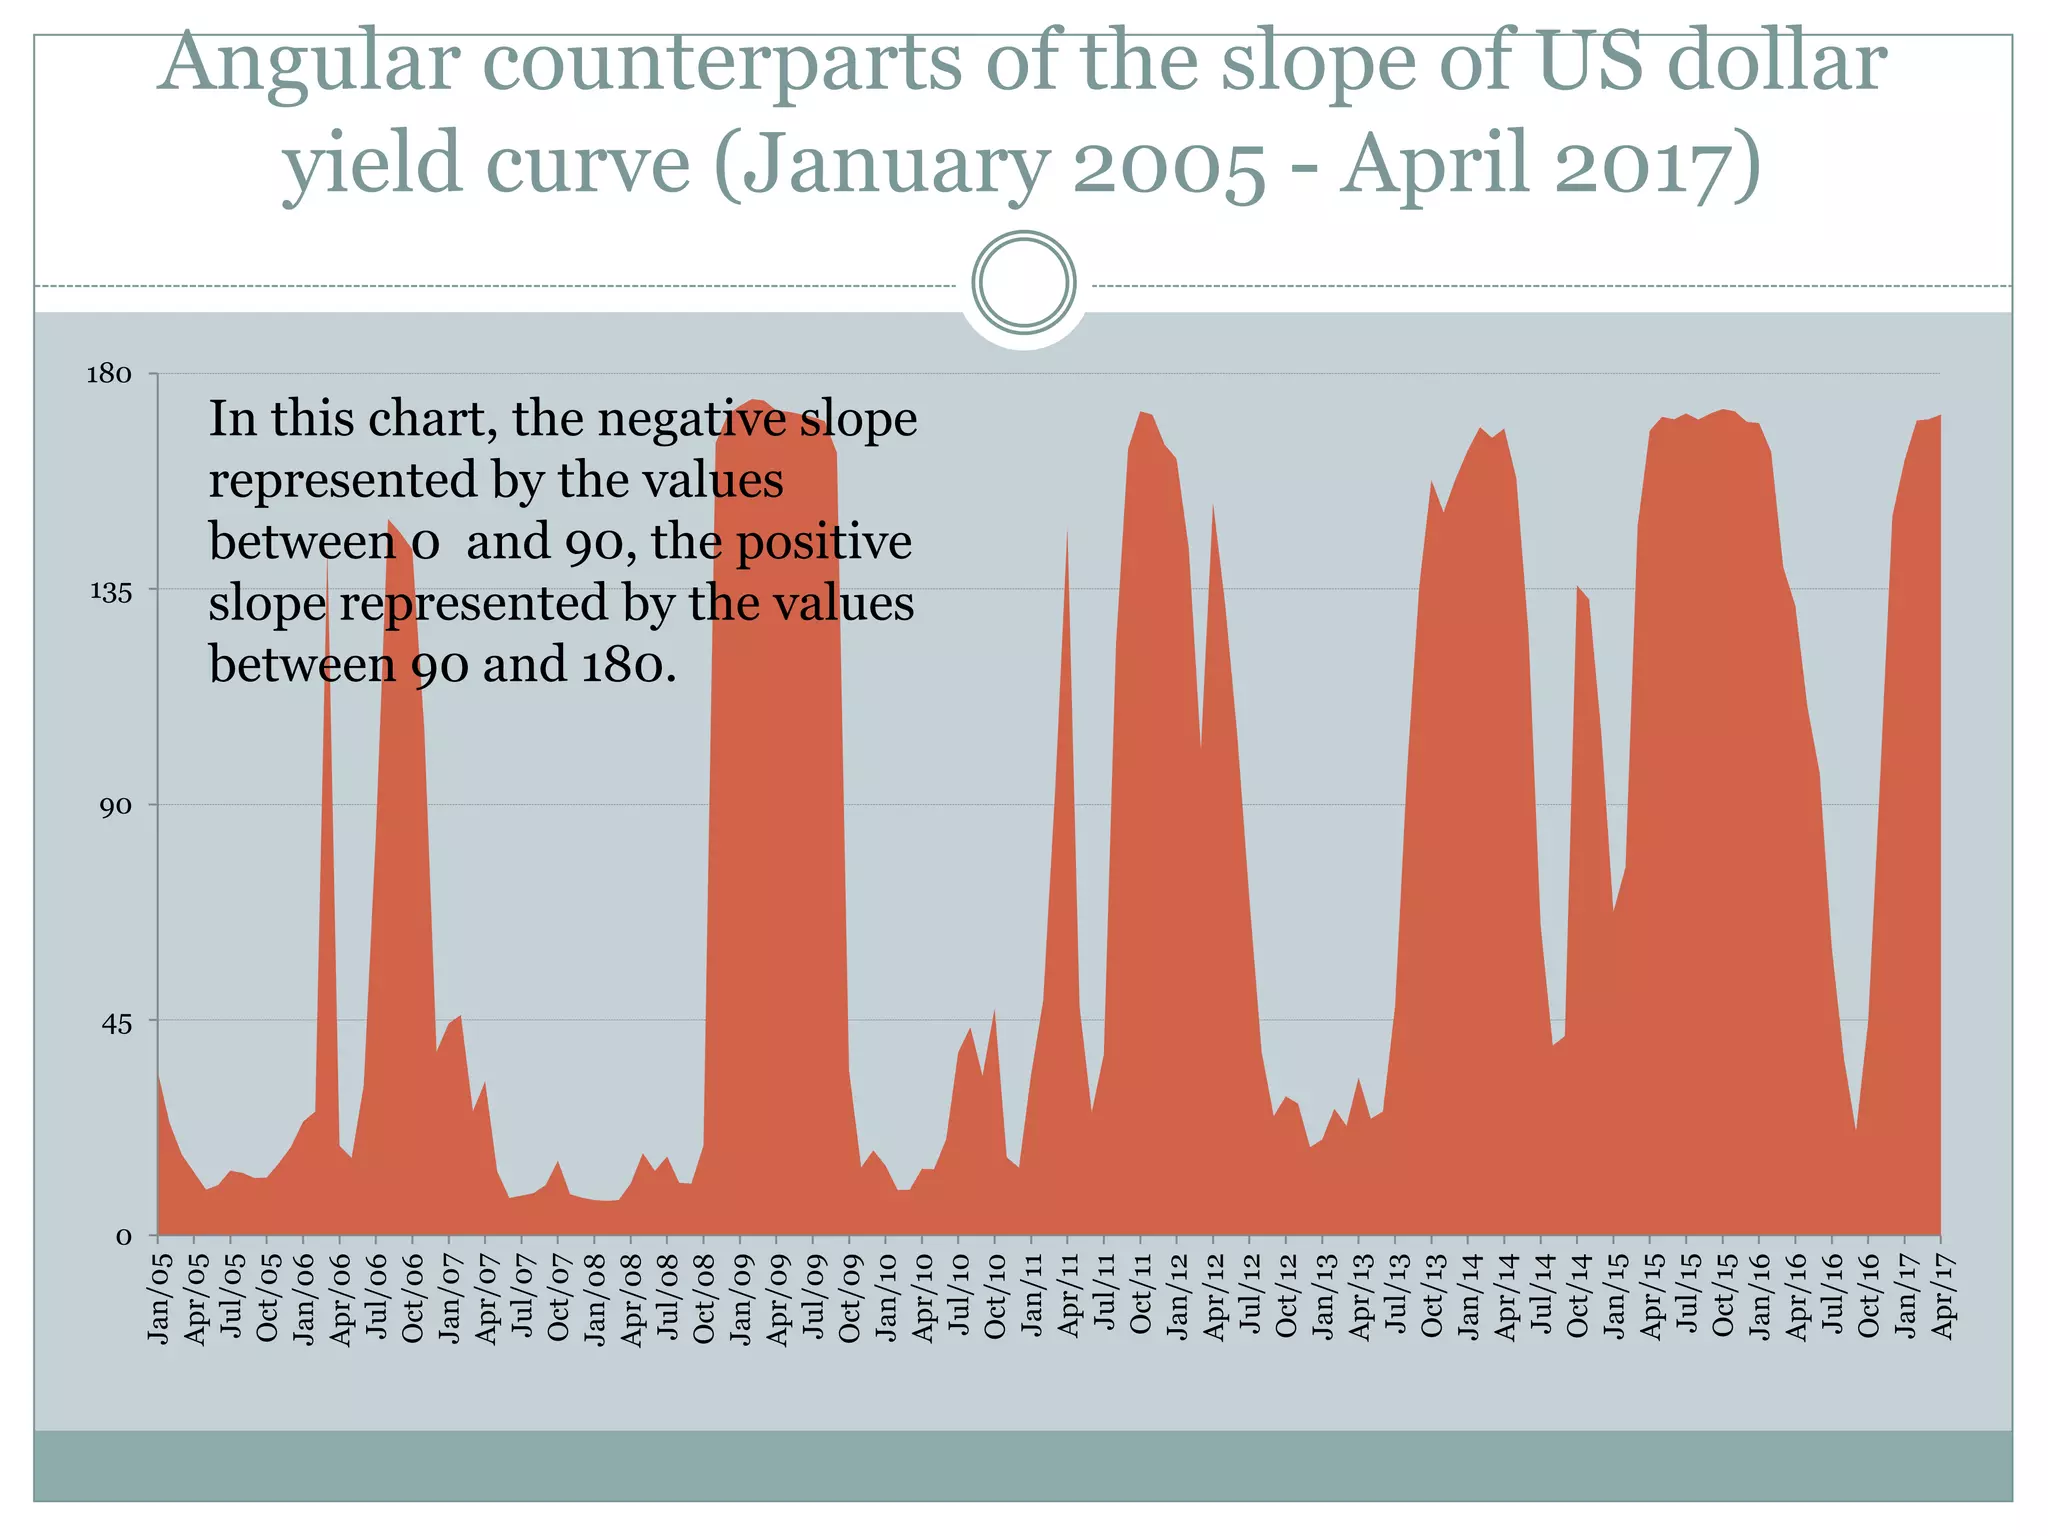
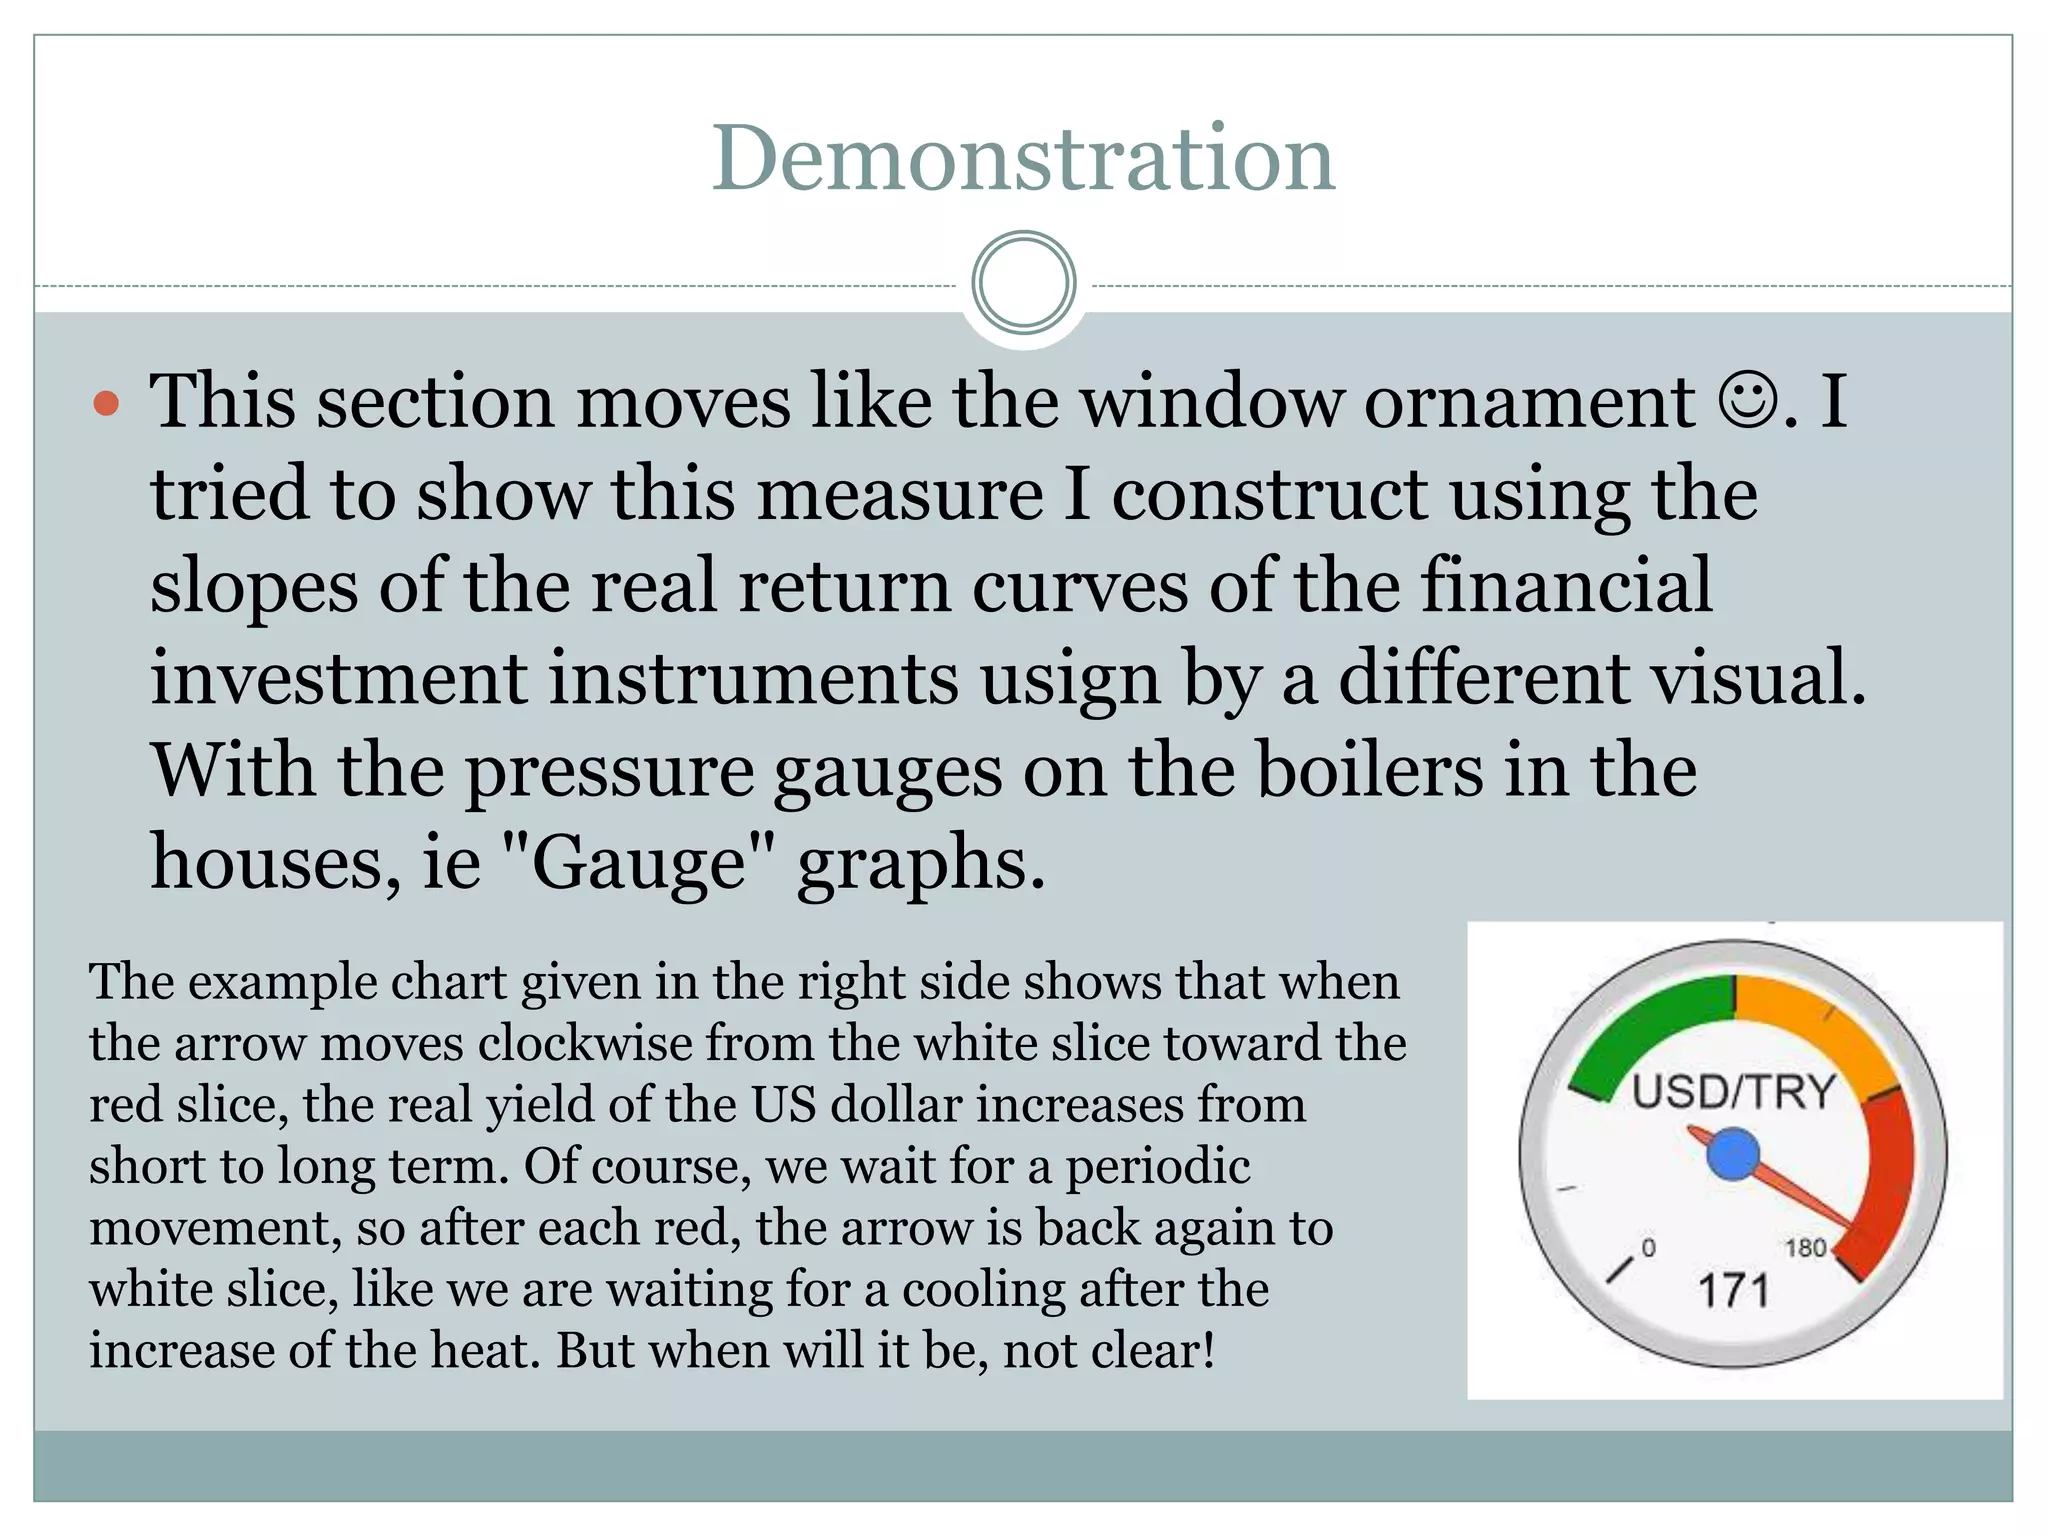
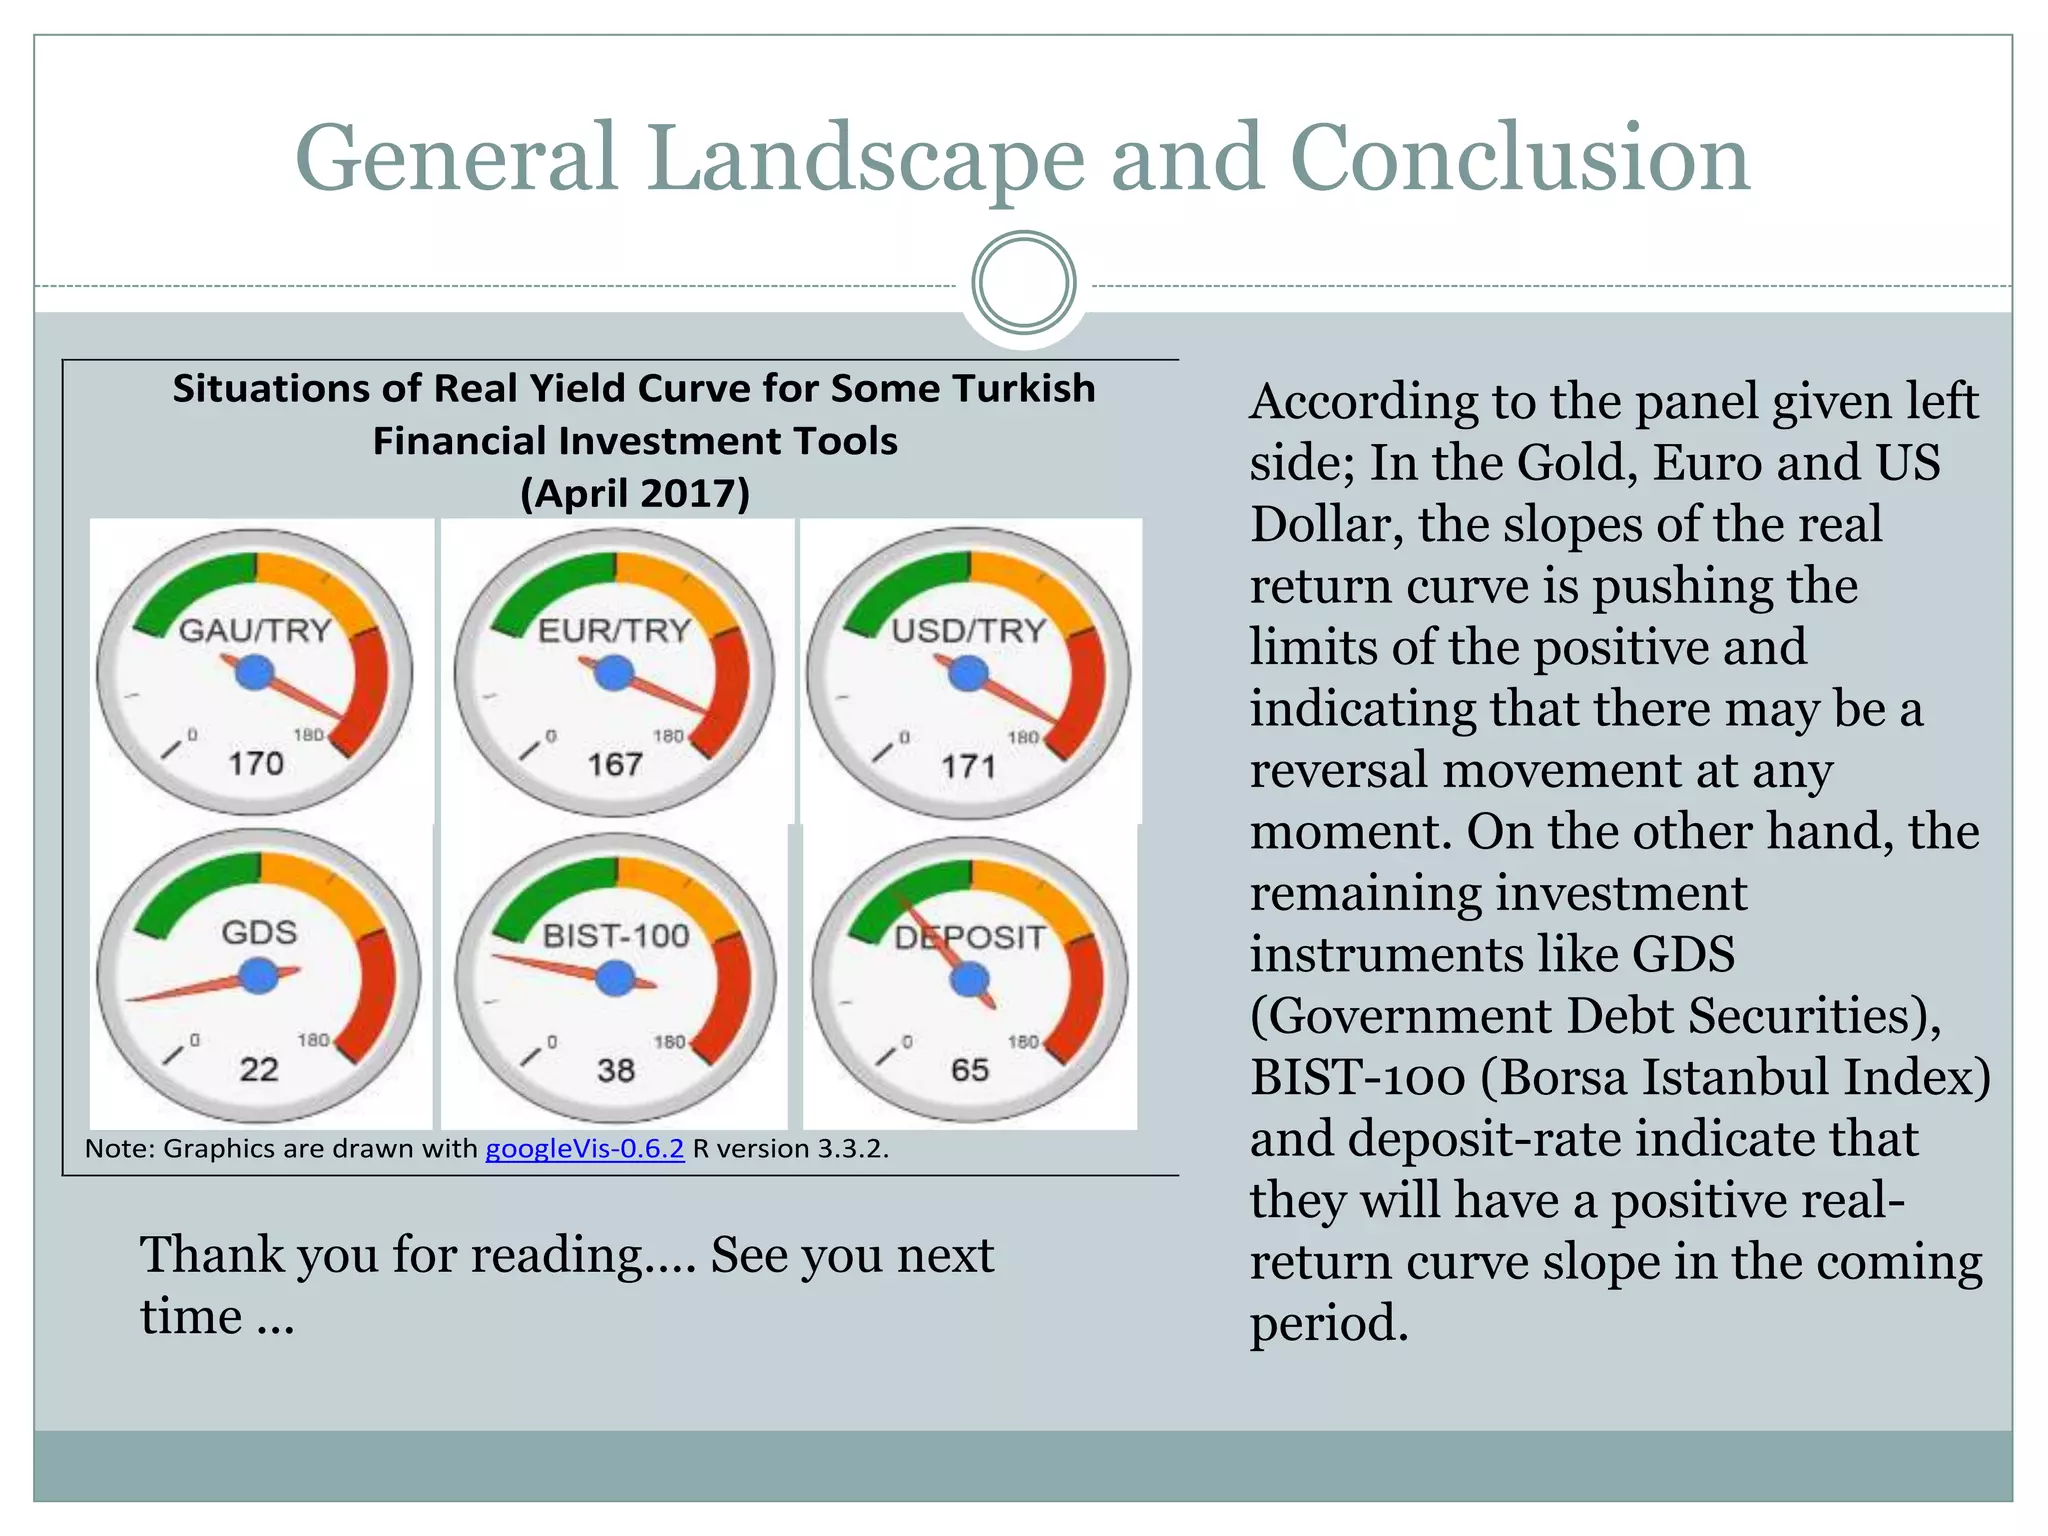
N E C M E T T I N A L P A Y K O Ç A K , P H . D .
1 2 / 5 / 2 0 1 7
A PROPOSAL FOR WARNING
MECHANISM OF FINANCIAL
INVESTMENT INSTRUMENTS
Definition
 Roughly, the relationship between the maturity and
return rates of investment instruments such as US
Dollar, Euro, deposit interest or gold is expressed as
"yield curve". When its trend is positive, it means that the
investment instrument provides higher yields in the long
run, and it yields higher returns in the short run in the
reverse case. Now, I feel like you are saying "what kind of
thing is that yield curve" or "how to predict the US
dollar's yield curve?", but I will not give the answers of
those questions here. Detailed information about it is in
the literature, of course. I would like to share with you
one or two more steps ahead! Using the slopes of the real
yield curves of financial investment instruments to try for
a warning mechanism ...
The Method
 I will explain “the method” with the following
example; Assume that we have real (ie inflation-
adjusted) rates of returns for 1 month, 3 month, 6
month and 12 month, commodities for April 2017 in
the US Dollar. Using these rates of return, we
estimate the slope of real yield curve for April 2017.
Then we find the angular counterpart of the slope of
that curve in a 180 degree plane. For example, in
April 2017, the slope of the US Dollar's real yield
curve is 6.6, and this slope has an angle of 171
degrees in a plane between 0-180 degrees.
Application
 I guess I hear you say now “Well???”. It turns out that there is
a cycle when I analyze the angular counterparts of the slopes
of the real yield curves of not only the US dollar but also many
investment instruments since 2005. These cycles is periodic
but not systematic. I mean, the turns follow each other, but
the cycle times are not exact, just like "business cycles".
However, even the knowledge of the existence of rotations
through the periodic structure can make it possible to forecast
the next movement. For example, I gave the following image
for the US Dollar. If we talk about the last data point, that is to
say in April of 2017, the slope is very high in this month and it
can be expected that high yield will be obtained in the short
term as months progresses since the slope will fall to negative
due its periodic structure. But who knows how many months
later will it be happen?
Angular counterparts of the slope of US dollar
yield curve (January 2005 - April 2017)
0
45
90
135
180
Jan/05
Apr/05
Jul/05
Oct/05
Jan/06
Apr/06
Jul/06
Oct/06
Jan/07
Apr/07
Jul/07
Oct/07
Jan/08
Apr/08
Jul/08
Oct/08
Jan/09
Apr/09
Jul/09
Oct/09
Jan/10
Apr/10
Jul/10
Oct/10
Jan/11
Apr/11
Jul/11
Oct/11
Jan/12
Apr/12
Jul/12
Oct/12
Jan/13
Apr/13
Jul/13
Oct/13
Jan/14
Apr/14
Jul/14
Oct/14
Jan/15
Apr/15
Jul/15
Oct/15
Jan/16
Apr/16
Jul/16
Oct/16
Jan/17
Apr/17
In this chart, the negative slope
represented by the values
between 0 and 90, the positive
slope represented by the values
between 90 and 180.
Demonstration
 This section moves like the window ornament . I
tried to show this measure I construct using the
slopes of the real return curves of the financial
investment instruments usign by a different visual.
With the pressure gauges on the boilers in the
houses, ie "Gauge" graphs.
The example chart given in the right side shows that when
the arrow moves clockwise from the white slice toward the
red slice, the real yield of the US dollar increases from
short to long term. Of course, we wait for a periodic
movement, so after each red, the arrow is back again to
white slice, like we are waiting for a cooling after the
increase of the heat. But when will it be, not clear!
General Landscape and Conclusion
Situations of Real Yield Curve for Some Turkish
Financial Investment Tools
(April 2017)
Note: Graphics are drawn with googleVis-0.6.2 R version 3.3.2.
According to the panel given left
side; In the Gold, Euro and US
Dollar, the slopes of the real
return curve is pushing the
limits of the positive and
indicating that there may be a
reversal movement at any
moment. On the other hand, the
remaining investment
instruments like GDS
(Government Debt Securities),
BIST-100 (Borsa Istanbul Index)
and deposit-rate indicate that
they will have a positive real-
return curve slope in the coming
period.
Thank you for reading…. See you next
time ...
N E C M E T T I N A L P A Y K O Ç A K , P H . D .
1 2 / 5 / 2 0 1 7
A PROPOSAL FOR WARNING
MECHANISM OF FINANCIAL
INVESTMENT INSTRUMENTS

A PROPOSAL FOR WARNING MECHANISM OF FINANCIAL INVESTMENT INSTRUMENTS

  • 1.
    N E CM E T T I N A L P A Y K O Ç A K , P H . D . 1 2 / 5 / 2 0 1 7 A PROPOSAL FOR WARNING MECHANISM OF FINANCIAL INVESTMENT INSTRUMENTS
  • 2.
    Definition  Roughly, therelationship between the maturity and return rates of investment instruments such as US Dollar, Euro, deposit interest or gold is expressed as "yield curve". When its trend is positive, it means that the investment instrument provides higher yields in the long run, and it yields higher returns in the short run in the reverse case. Now, I feel like you are saying "what kind of thing is that yield curve" or "how to predict the US dollar's yield curve?", but I will not give the answers of those questions here. Detailed information about it is in the literature, of course. I would like to share with you one or two more steps ahead! Using the slopes of the real yield curves of financial investment instruments to try for a warning mechanism ...
  • 3.
    The Method  Iwill explain “the method” with the following example; Assume that we have real (ie inflation- adjusted) rates of returns for 1 month, 3 month, 6 month and 12 month, commodities for April 2017 in the US Dollar. Using these rates of return, we estimate the slope of real yield curve for April 2017. Then we find the angular counterpart of the slope of that curve in a 180 degree plane. For example, in April 2017, the slope of the US Dollar's real yield curve is 6.6, and this slope has an angle of 171 degrees in a plane between 0-180 degrees.
  • 4.
    Application  I guessI hear you say now “Well???”. It turns out that there is a cycle when I analyze the angular counterparts of the slopes of the real yield curves of not only the US dollar but also many investment instruments since 2005. These cycles is periodic but not systematic. I mean, the turns follow each other, but the cycle times are not exact, just like "business cycles". However, even the knowledge of the existence of rotations through the periodic structure can make it possible to forecast the next movement. For example, I gave the following image for the US Dollar. If we talk about the last data point, that is to say in April of 2017, the slope is very high in this month and it can be expected that high yield will be obtained in the short term as months progresses since the slope will fall to negative due its periodic structure. But who knows how many months later will it be happen?
  • 5.
    Angular counterparts ofthe slope of US dollar yield curve (January 2005 - April 2017) 0 45 90 135 180 Jan/05 Apr/05 Jul/05 Oct/05 Jan/06 Apr/06 Jul/06 Oct/06 Jan/07 Apr/07 Jul/07 Oct/07 Jan/08 Apr/08 Jul/08 Oct/08 Jan/09 Apr/09 Jul/09 Oct/09 Jan/10 Apr/10 Jul/10 Oct/10 Jan/11 Apr/11 Jul/11 Oct/11 Jan/12 Apr/12 Jul/12 Oct/12 Jan/13 Apr/13 Jul/13 Oct/13 Jan/14 Apr/14 Jul/14 Oct/14 Jan/15 Apr/15 Jul/15 Oct/15 Jan/16 Apr/16 Jul/16 Oct/16 Jan/17 Apr/17 In this chart, the negative slope represented by the values between 0 and 90, the positive slope represented by the values between 90 and 180.
  • 6.
    Demonstration  This sectionmoves like the window ornament . I tried to show this measure I construct using the slopes of the real return curves of the financial investment instruments usign by a different visual. With the pressure gauges on the boilers in the houses, ie "Gauge" graphs. The example chart given in the right side shows that when the arrow moves clockwise from the white slice toward the red slice, the real yield of the US dollar increases from short to long term. Of course, we wait for a periodic movement, so after each red, the arrow is back again to white slice, like we are waiting for a cooling after the increase of the heat. But when will it be, not clear!
  • 7.
    General Landscape andConclusion Situations of Real Yield Curve for Some Turkish Financial Investment Tools (April 2017) Note: Graphics are drawn with googleVis-0.6.2 R version 3.3.2. According to the panel given left side; In the Gold, Euro and US Dollar, the slopes of the real return curve is pushing the limits of the positive and indicating that there may be a reversal movement at any moment. On the other hand, the remaining investment instruments like GDS (Government Debt Securities), BIST-100 (Borsa Istanbul Index) and deposit-rate indicate that they will have a positive real- return curve slope in the coming period. Thank you for reading…. See you next time ...
  • 8.
    N E CM E T T I N A L P A Y K O Ç A K , P H . D . 1 2 / 5 / 2 0 1 7 A PROPOSAL FOR WARNING MECHANISM OF FINANCIAL INVESTMENT INSTRUMENTS