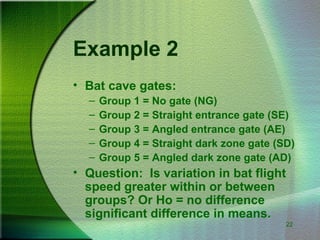
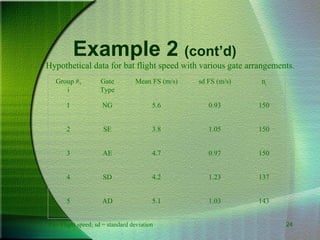
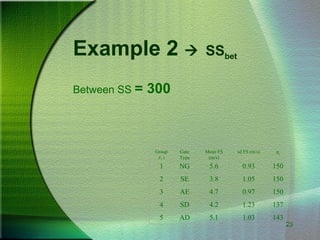
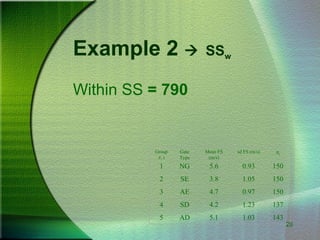
Downloaded 94 times


![11
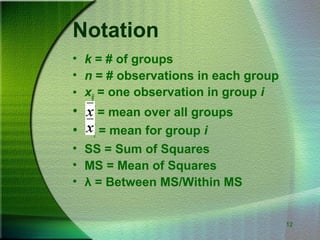
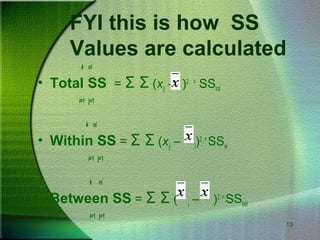
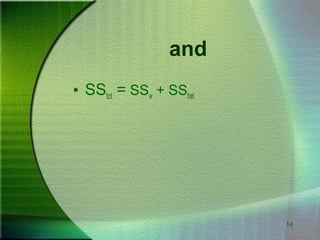
Remember that…
• Standard deviation (s)
n
s = √[(Σ (xi
– X)2
)/(n-1)]
i = 1
• In this case: Degrees of freedom (df)
df = Number of observations or groups - 1](https://image.slidesharecdn.com/9-150606182231-lva1-app6891/85/9-basic-concepts_of_one_way_analysis_of_variance_-anova-11-320.jpg)


This document provides an overview of one-way analysis of variance (ANOVA), including definitions, assumptions, calculations, examples, and limitations. ANOVA allows researchers to determine if variability between groups is greater than expected by chance. The document explains how to calculate sums of squares, F-ratios, and p-values to test the null hypothesis that means are equal across groups.