Download to read offline


![Boland et al. • Neuronal Autophagy and Its Involvement in AD J. Neurosci., July 2, 2008 • 28(27):6926 – 6937 • 6927
against apoptosis by degrading nonessential cell constituents for Neurobasal medium ensured minimal growth of glial cells (Ͻ5%) after
energy (Boland and Nixon, 2006; Finn and Dice, 2006). Autoph- 5 d in culture.
agy contributes to cell remodeling during differentiation but After 5 d in vitro, cultured neurons were treated for 1, 6, and 24 h
strong induction during development initiates a form of “auto- before fixation or harvesting. Treatment conditions and compounds
used included rapamycin (10 nM; LC Laboratories), vinblastine (10 M;
phagic” programmed cell death in some cell populations (Levine
Sigma-Aldrich), leupeptin (20 M; Sigma-Aldrich), pepstatin A (20 M;
and Klionsky, 2004). Overactive or dysfunctional autophagy may Sigma-Aldrich), and Earle’s balanced salt solution (EBSS) (Invitrogen)
also promote neuronal cell death in disease states (Nixon, 2006). Electron microscopy and postembedding. Cortical biopsy specimens
The scarcity of recognizable autophagosomes and other auto- were studied from a 74-year-old male with a clinical diagnosis of demen-
phagic vacuole (AV) intermediates in healthy neurons has raised tia and prominent dyspraxia. The patient underwent surgery for place-
the possibility that baseline autophagy in neurons is normally low ment of a ventricular shunt, and frontal cortex tissue obtained next to the
and that the frequent presence of AVs in neurodegenerative states shunt penetration site revealed numerous neurofibrillary tangles and
reflects an induction of autophagy (Boellaard et al., 1989; Ang- cored amyloid plaques consistent with the neuropathologic diagnosis of
lade et al., 1997; Kegel et al., 2000; Ko et al., 2005; Nixon et al., Alzheimer’s disease as previously described (Nixon et al., 2005). Tissue
2005). For example, in Alzheimer’s disease, AVs accumulate in was fixed in 3% glutaraldehyde/0.1 M phosphate buffer, pH 7.4, and
enormous numbers within grossly distended, “dystrophic” neu- postfixed in 1% osmium tetroxide in Sorensen’s phosphate buffer. After
dehydration in ethyl alcohol, the tissue was embedded in Epon (Electron
rites of affected neurons and also appear in other parts of neu-
Microscopy Sciences). Tissue blocks were cut serially into ultrathin (0.06
rons. The relative contribution of heightened autophagy induc- m) sections. Ultrathin sections were stained with uranyl acetate and
tion to the robust AV expansion in Alzheimer’s disease is lead citrate. Transgenic mice expressing the Swedish mutation of human
uncertain, because it is also possible that AVs might accumulate APP (APPK670M/N671L) and mutant PS1 (PS1M146L) (Duff et al., 1996)
to high numbers when autophagosomal digestion is impaired. An were studied at 16 months of age. Ultrathin sections of the cerebral cortex
equilibrium exists between autophagosome formation and clear- were cut from Epon-embedded blocks and placed on copper grids for
ance by lysosomes (Chu, 2006), termed autophagic flux, and it is structural analysis.
now known that terminal stages of autophagosomal degradation Neurons were fixed for electron microscopy (EM) by removing cul-
require uncompromised vesicular trafficking, heterotypic or- ture medium, washing (three times) in 37°C supplement-free Neuro-
ganelle fusion and lysosomal function (Kovacs et al., 1982;
´ basal medium, and adding 4% paraformaldehyde and 1% glutaraldehyde
in 0.1 M sodium cacodylate buffer, pH 7.2 (Electron Microscopy Sci-
Takeshige et al., 1992; Tanida et al., 2005; Kiselyov et al., 2007).
ences), for 3 h at RT. After fixation, neurons were washed (three times) in
Interestingly, a number of recent studies on various lysosomal cacodylate buffer, postfixed in 1% osmium tetroxide, progressively de-
storage disorders have found evidence of impaired AV clearance hydrated in a graded series of ethanol (50 –100%), and embedded in
(Kiselyov et al., 2007; Settembre et al., 2008). Little is known Epon. Thin sections of 1 m were cut from the polymer, followed by
about the responsiveness of neurons to modulation of the auto- ultrathin sections (70 – 80 nm) using a Recheirt Ultracut S microtome,
phagic system. To begin to understand the underlying molecular and placed on copper grids for structural analysis. Grids were briefly
basis for pathological autophagic patterns in neurodegenerative stained with uranyl acetate and lead citrate before being examined with a
disease states, we investigated responses of primary cortical neu- Philips electron microscope (model CM 10). Images were captured on a
rons to robust induction of autophagy. Alternatively, we inter- digital camera (Hamamatsu; model C4742-95) using Advantage CCD
fered with clearance of autophagosomes by (1) impeding auto- Camera System software (Advanced Microscopy Techniques
Corporation).
phagosome trafficking and subsequent fusion with lysosomes or
Transient DsRed–LC3 and green fluorescent protein–Endo transfection.
by (2) inhibiting lysosomal proteolysis. Morphological and bio- PCR-amplified coding sequences of LC3 in green fluorescent protein
chemical indices of autophagic states revealed that in healthy (GFP)-LC3 (provided by Noboru Mizushima, Tokyo Medical and Den-
neurons autophagosomes are actively formed and efficiently tal University, Tokyo, Japan) was subcloned into a pDsRed-
cleared. Interference with AV clearance, rather than induction of monomer-C1 vector (Clontech) to create DsRed-LC3, and verified by
autophagy alone, gives rise to patterns of autophagy pathology sequencing. The pEGFP-Endo reporter vector, which encodes a fusion
resembling those seen in Alzheimer’s disease. protein containing the human RhoB GTPase, was obtained from Clon-
tech. Primary cortical neurons 3– 4 d in vitro (DIV) plated in 35 mm
glass-bottom dishes were transfected using Lipofectamine 2000 (Invitro-
Materials and Methods gen) according to the manufacturer’s suggested conditions. Briefly, 2 ml
Culturing and treatment of primary cortical neurons. Primary cortical neu- of conditioned (pretransfection) medium was replaced with transfection
rons were derived from day 0 (0 –12 h postnatal) Sprague Dawley rat medium consisting of 1 g of DNA, 5 l of Lipofectamine 2000, 500 l of
pups (Charles River). Pup brains were harvested and placed in ice-cold Opti-Mem (Invitrogen), and 1.5 ml of Neurobasal medium without B27.
Hibernate-E medium (BrainBits) where the meninges were removed and Neurons were incubated with transfection media for 30 min at 37°C,
the cerebral cortices were dissected. Cortices were minced using a scalpel followed by replacement (three times) with fresh Neurobasal medium.
and dissociated by incubating the tissue in Hibernate-E medium con- Conditioned medium was readded to the transfected neurons and main-
taining 15 U/ml papain (Worthington Biochemicals) for 30 min at 37°C tained in the incubator for least 24 h before treatments.
before triturating in Neurobasal medium (Invitrogen) containing 20% BODIPY-pepstatin-FL labeling. DsRed-LC3 transfected primary corti-
fetal bovine serum (HyClone) and DNase (0.2 g/ml). Undissociated cal neurons were incubated with 1 M BODIPY-pepstatin-FL (Invitro-
brain tissue was removed by passing the cell suspension through a 40 m gen) in Neurobasal medium for 1 h at 37°C followed by replacement with
cell strainer (Thermo Fisher Scientific). Dissociated neurons were cen- fresh Neurobasal medium (two times). Subsequently, Neurobasal me-
trifuged at 200 ϫ g for 3 min at room temperature (RT), and the pellet dium was replaced with low-fluorescence Hibernate medium (BrainBits)
was resuspended in Neurobasal medium supplemented with B27 (2%), to reduce fluorescent background, and cultures were placed in a 37°C
penicillin (100 U/ml), streptomycin (100 U/ml), and glutamine (0.5 mM; humidified chamber with 5% CO2 on a Zeiss LSM510 confocal micro-
all Invitrogen). Viable neurons were plated at a density of 100,000 cells scope. Z-stack images were acquired using LSM 520 software.
per 13 mm circular cover glass and 250,000 cells per well in six-well tissue Neuron harvesting and immunoblot analyses. Neurons (DIV 5) grown
culture dishes, precoated with poly-D-lysine (50 g/ml; Sigma-Aldrich), in six-well plastic dishes (BD Biosciences) were washed (three times) in
and incubated in a humidified atmosphere containing 5% CO2/95% PBS, pH 7.4, at RT, and then scraped in 200 l/well of ice-cold lysis buffer
atmosphere at 37°C. One-half of the plating medium was replaced with [M-PER buffer containing Halt Protease Inhibitor Cocktail (1:100) and
fresh pen/strep-free medium after 3 d. Serum-free, B27-supplemented 50 M EDTA; Pierce]. Protein concentration was determined using the](https://image.slidesharecdn.com/6926-full-130320105051-phpapp01/85/6926-full-2-320.jpg)
![Boland et al. • Neuronal Autophagy and Its Involvement in AD J. Neurosci., July 2, 2008 • 28(27):6926 – 6937 • 6929
tion in fixative without Neurobasal at 4°C for 24 h. Preembedding and
postembedding immuno-EM were done in parallel, using the same pri-
mary antibody. For preembedding, cells were incubated with 0.1% so-
dium borohydride in PBS for 15 min and washed (four times) in PBS for
10 min. Cells were permeabilized with 0.05% Triton X-100 in PBS for 30
min, washed in PBS (four times) for 10 min, and then blocked with 5%
BSA and 5% normal goat serum in PBS for 1 h at 4°C. Cells were incu-
bated with primary antibody polyclonal cathepsin D (1:2000 in blocking
buffer) at 4°C overnight followed by washing and incubation with ultras-
mall gold-conjugated goat anti-rabbit secondary antibody (1:100 in
blocking buffer) for 2 h at RT. Ultrasmall gold was silver-enhanced with
Custom Ultra Small kit (Electron Microscopy Sciences) using the man-
ufacturer’s guidelines. After silver enhancement, cells were postfixed
with osmium tetroxide and processed for EM, as described previously
(Yu et al., 2005). For postembedding immuno-EM, cells were fixed with
freshly made 3% paraformaldehyde containing 0.1% glutaraldehyde and
4% sucrose in 0.1 M sodium cacodylate buffer. After fixation, cells were
washed, dehydrated, and embedded in Lowicryl K4M (Polysciences) and
polymerized under UV light (360 nm) at Ϫ35°C. Ultrathin sections were
cut and mounted on Formvar and carbon coated nickel grids. After
incubation with primary antibodies at 4°C overnight, gold-conjugated
secondary antibodies [18 nm Colloidal Gold-AffiniPure Goat Anti-
Rabbit IgG(HϩL); Jackson ImmunoResearch Laboratories; 15 nm Pro-
tein A Gold; Cell Microscopy Center, University Medical Center Utrecht,
Utrecht, The Netherlands] were applied and stained with uranyl acetate
and lead citrate by standard methods. Postembedding immunogold elec-
tron microscopy on human brain was performed as previously described
(Nixon et al., 2005).
Morphometric analysis. The number of autophagic vacuoles per cell
body were counted using EM images at direct magnification of 10,500ϫ
(64 m 2) for the various treatment conditions. Electron micrographs
(25–100 images per treatment condition) were examined, and values are
expressed as AVs per field. For our analysis, we identified AVs as com-
partments of 0.5 m in diameter or larger. Autophagic vacuoles were
further classified according to whether they were autophagosomes or
autolysosomes based on two qualities: autophagosomes have double
membranes and uncompacted cytoplasmic material including organelles
such as mitochondria and ribosomes, whereas autolysosomes are single-
or double-membrane-limited vesicles with densely compacted amor-
phous or multilamellar contents. All numerical values are expressed as
mean Ϯ SEM.
Results
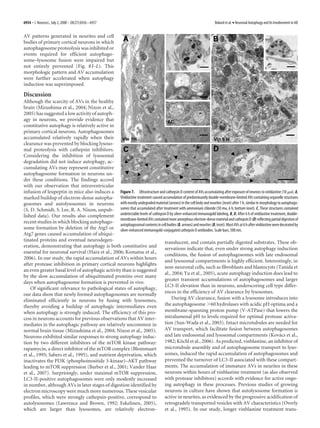
Autophagy induction in neurons
As a baseline for studies of autophagy induction, we used neurons
from postnatal rat pups [postnatal day 0 (P0)] grown for 5 d in a
nutrient-rich condition in the presence of serum supplement,
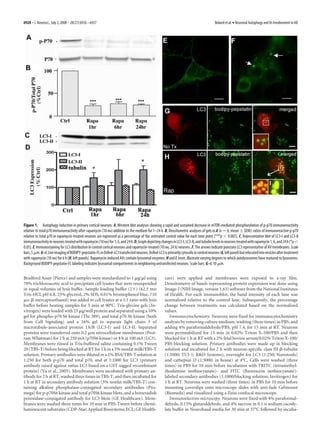
B27. Exposure of these cells to rapamycin (10 nM) for 1 h rapidly
induced autophagy, as evidenced by a 78 Ϯ 4.5% decrease in
mammalian target of rapamycin (mTOR)-mediated phosphory-
lation of p70 S6 kinase (ratio of phosphorylated p70 to total p70)
compared with untreated neurons (Fig. 1 A, B). Decreased mTOR
activity was sustained during rapamycin treatment for 6 –24 h
(Fig. 1 A, B). Posttranslational modification of cytosolic LC3-I to
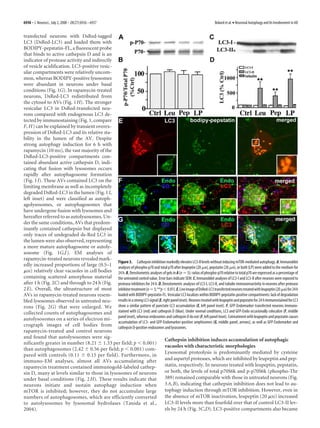
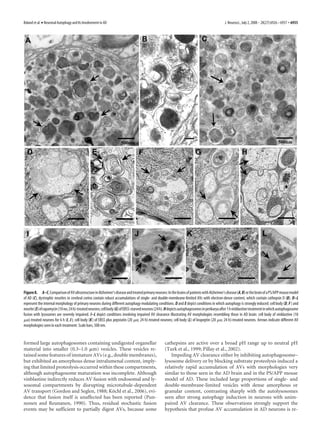
Figure 2. A, B, AV ultrastructure in neurons during autophagy induction: 5-d-old primary LC3-II is followed by LC3-II translocation to nascent autophago-
cortical neurons displayed few AVs in their cell bodies (A) (scale bar, 2 m) and neurites (B). C, somal membranes, which is a useful index of autophagosome
Appearance of large clear autophagic fusion compartments in the cell body after rapamycin (10 formation (Mizushima, 2004). Rapamycin elevated LC3-II levels
nM) treatment for 1 h. D, Electron-dense sequestered material was observed in neurites after by 55 Ϯ 3% at 1 h and by 80 –90% from 6 to 24 h (Fig. 1 D).
rapamycin (10 nM) treatment for 1 h. E, F, Prolonged activation of autophagy with rapamycin Tubulin levels, serving as an additional independent control pro-
(10 nM; 24 h) revealed multiple autophagic compartments in both cell bodies (E) and neurites tein, did not change significantly under any of the conditions of
(F ). G, H, Ultrastructural localization of cathepsin D in control (G) and rapamycin (10 nM; 6 h)- analysis in this study.
treated neurons by silver-enhanced immunogold labeling with cathepsin D antibody (H ). In Cortical neurons cultured in nutrient-rich media for 5 d rarely
control neurons, cathepsin D is abundant in lysosomes with relatively little electron-dense
contained autophagosomes identified by LC3 labeling or by ul-
content (arrows). Most AVs in rapamycin-treated neurons are decorated with silver-enhanced
immunogold (arrows), indicating the presence of cathepsin D. Scale bars, 500 nm (except as
trastructural analysis (Figs. 1 E, 2 A, B). Rapamycin (10 nM) treat-
otherwise noted). ment of neurons for 24 h caused LC3 immunoreactivity in
perikarya to redistribute from the cytosol to vesicular structures
(Fig. 1 F). To visualize the maturation of autophagic vacuoles, we](https://image.slidesharecdn.com/6926-full-130320105051-phpapp01/85/6926-full-4-320.jpg)
![6932 • J. Neurosci., July 2, 2008 • 28(27):6926 – 6937 Boland et al. • Neuronal Autophagy and Its Involvement in AD
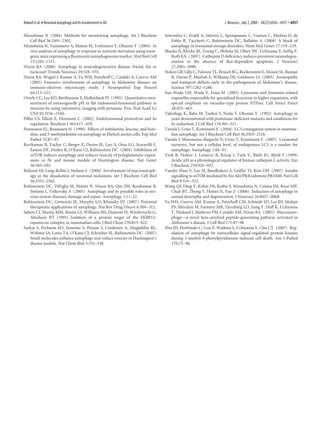
change in LC3-I levels. LC3 immunoreac-
tivity also redistributed to abundant punc-
tate structures in the cell body and neurites
in the presence of vinblastine. Vinblastine
treatment for 24 h caused extensive AV ac-
cumulation and neuritic degeneration ev-
ident in immunolabeling studies with class
III -tubulin antibody (Fig. 6 H). In con-
trast, exposure of neurons to rapamycin or
leupeptin had no discernable effects on
microtubule integrity (Fig. 6 F, G).
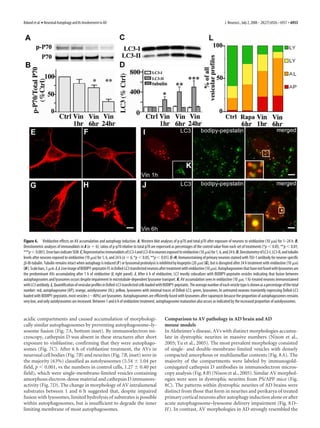
AVs accumulating within 1 h of vin-
blastine in DsRed-LC3 transfected neu-
rons resembled endogenous LC3 immu-
nolabeling after the same vinblastine
treatment (Fig. 6 I, left panel and inset).
These AVs were autophagosomes that ap-
peared red and lacked BODIPY-pepstatin
(Fig. 6 I, right panel inset, arrowhead) or
autolysosomes that appear orange (red
vesicle containing green BODIPY-
pepstatin in the lumen; arrows) where
AV–lysosome fusion has already occurred.
In contrast, DsRed-LC3 vesicles contain-
ing BODIPY-pepstatin increased after 6 h
of vinblastine (Fig. 6 J, K ), indicating that
some extent of fusion with lysosomes oc-
curs in the presence of vinblastine. To
quantify the degree of delayed AV matura-
tion caused by vinblastine, vesicular pro-
files of DsRed-LC3/BODIPY-pepstatin la-
beled neurons were quantified after
rapamycin (10 nM, 6 h) and vinblastine (10
M) for 1 and 6 h (Fig. 6 L). DsRed-LC3
vesicles lacking any BODIPY-pepstatin
were identified as autophagosomes (red;
AP), whereas DsRed-LC3 positive vesicles
containing BODIPY-pepstatin in the lu-
men were classified as autolysosomes (or-
ange; AL). BODIPY-pepstatin-positive
vesicles containing traces of DsRed-LC3
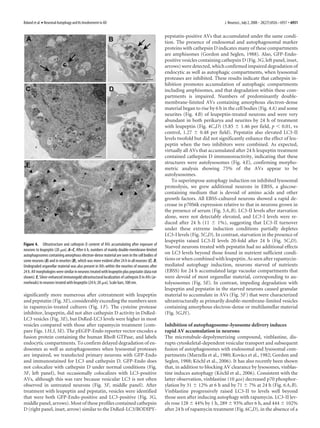
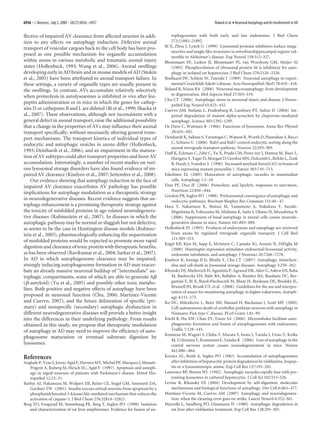
(yellow; LY) and BODIPY-pepstatin-only Figure 5. Autophagy induction by serum starvation with or without cathepsin inhibition. A, Western blot analyses of p-p70
vesicles (green; LY) were characterized as and total p70 in neurons grown in EBSS in the absence [no inhibitor (NI)] or presence of pepstatin (Pep, P; 20 M), leupeptin (Leu,
lysosomes. Total vesicle counts per neuron L; 20 M), or both (LP) for 24 h. B, Densitometric analyses of multiple gels in A (n ϭ 5): ratios of p-p70 and p70 immunoreactivity
were made for at least 15 cells under each are expressed as a percentage of the untreated control (C) value shown at 100% ( p Ͻ 0.0001 for 1 h, p Ͻ 0.001 for 6 h, and p Ͻ
condition and the fraction of each profile 0.05 for 24 h treatments in EBSS culture media). Error bars indicate SEM. C, Representative immunoblots of LC3-I and LC3-II
immunoreactivity in neurons grown in EBSS in the absence or presence of protease inhibitors for 24 h. D, Densitometric analyses
was reflected as a percentage of the total of LC3-I and LC3-II levels after neurons grown in EBSS in the absence or presence of protease inhibitors for 24 h. In B and D,
number of LC3 and BODIPY-pepstatin- densitometric values are expressed as ratios of immunoreactivity levels after each inhibitor treatment relative to the correspond-
positive vesicles. Efficient AV maturation ing ratio for untreated control neurons grown in NBM/B27. E, Ultrastructure of AVs in neuronal perikaryon after growth in EBSS for
was found in rapamycin-treated neurons, 24 h (F ) EBSS with leupeptin (20 M) and pepstatin (20 M) for 6 h. Scale bar, 500 nm. G, H, Cell body (G) and neurite (H ) of
whose AV profiles were mostly autolyso- neurons cultured in EBSS with leupeptin (20 M) and pepstatin (20 M) for 24 h. Arrows indicate different AV morphologies seen
somal (Fig. 6 L, orange bar) (39.4%) and in each treatment. Scale bars, 500 nm.
autophagosomes were rare (Ͻ1%). In
contrast, vinblastine-mediated impairment of AV transport/fu- ment, but the impaired fusion efficiency between AVs and lyso-
sion at 1 h increased the proportion of autophagosomes (red bar) somes are such that incompletely degraded autolysosomes accu-
(22.7%), whereas similar proportions of autolysosomes were mulate. At the ultrastructural level, the morphology of AVs that
maintained (39%). Extending vinblastine treatment for 6 h did rapidly accumulated within the cell bodies (Fig. 7A) and neurites
not increase the relative proportion of autophagosomes, but in- (Fig. 7A, inset) after 1 h of vinblastine treatment corresponded
creased the percentage of autolysosomes (57.3%) and decreased frequently (44%) to autophagosomes (5.46 Ϯ 0.86 per field, p Ͻ
the proportion of lysosomes. In contrast to rapamycin treatment, 0.001, vs control, 0.11 Ϯ 0.15 per field), containing undigested
vinblastine reduced the proportion of lysosomes, which may in- uncompacted organellar material within single- and double-
dicate a delayed completion of proteolysis from autolysosome to membrane-limited vesicles (Fig. 7A, middle panel). Lysosomo-
lysosome. Initial maturation steps occur with vinblastine treat- tropic agents such as ammonium chloride (NH4Cl) neutralize](https://image.slidesharecdn.com/6926-full-130320105051-phpapp01/85/6926-full-7-320.jpg)

This study investigates autophagy in neurons and its relationship to Alzheimer's disease pathology. The study finds that: 1) In healthy neurons, autophagosomes are rapidly cleared through fusion with lysosomes, keeping autophagic vacuole levels low. 2) Impeding late stage autophagosome clearance, such as by inhibiting lysosomal proteolysis, causes autophagic vacuoles to accumulate in neurons resembling pathology in Alzheimer's disease. 3) The autophagic pathology observed in Alzheimer's disease likely arises from impaired autophagosome clearance rather than strong induction of autophagy alone.


![Autophagy [1].pptx](https://cdn.slidesharecdn.com/ss_thumbnails/autophagy1-251004162856-93ca1670-thumbnail.jpg?width=640&height=640&fit=bounds)


