55) Moore, OK EF5 Supercell at 19.56.00 Z (0 Sec During Tornado) - DRC Wraps Into RFD Occlusion As Tornado Begins - Cells Approach Flanking Line.pdf
•
1 like•12 views
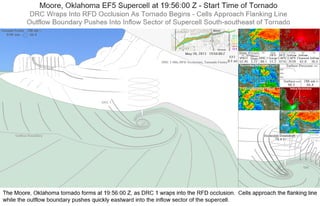
The Moore, Oklahoma tornado forms as DRC 1 wraps into the RFD occlusion. Cells approach the flanking line while the outflow boundary pushes quickly eastward into the inflow sector of the supercell.
Report
Share
Report
Share
Download to read offline
Recommended
Supercell Schematic with Violent Tornado over Farmland Including Tornadogenes...
This is the first supplementary graphic that came from work done for the Tornadogenesis papers of Part 1, Part 2 and Part 3. This hypothetical schematic shows a violent tornado, along with the different features of a supercell including the rear flank downdraft, forward flank downdraft, RFD boundary, FFD boundary, inflow, inflow channel, descending reflectivity core, occlusion downdraft, streamwise vorticity current, overshooting top and back anvil.
Supercell Schematic with Violent Tornado Near Trees and Lakes Including Torna...
This is the second supplementary graphic that came from work done for the Tornadogenesis papers of Part 1, Part 2 and Part 3. This hypothetical schematic shows a violent tornado, along with the different features of a supercell including the rear flank downdraft, forward flank downdraft, RFD boundary, FFD boundary, inflow, inflow channel, descending reflectivity core, occlusion downdraft, streamwise vorticity current, overshooting top and back anvil.
1) Tornadogenesis In High-end Tornadic Supercells (Part 1) - The RFD Surge, R...
This is the title slide for paper 1, "Tornadogenesis In High-end Tornadic Supercells (Part 1) - The RFD Surge, RFD Occlusion and Cell Mergers".
2) Project Goal, Database Collection and RFD Occlusion Identification Method ...
In order to put together the puzzle pieces of high-end tornadogenesis, we determined that a relatively large sample of supercells with high-end tornadoes would be needed. High-resolution radar would be analyzed for measuring as many characteristics of these supercells as possible. An archive
of WSR-88D high-resolution radar, at the Storm Prediction
Center, would be used to satisfy most requirements for data collection. Other data, including surface observations and soundings, would be used to analyze environmental information. It was determined that about a decade of radar data would be sufficient for the needs of this project. The period in the archive from May 22, 2008 to December 31, 2019 was examined. Before a tornado event was added to the study, seven criteria must be met. They are listed in this graphic.
3) Four Examples - Inflow Restriction into the Low-level Mesocyclone.pdf
The pre-tornadic RFD occlusion signature, which commonly occurred about five minutes prior to the tornado start time. This signature is an indication that the RFD occlusion has matured and occurs about two-thirds of the way through tornadogenesis.
4) Data Gathered For Seven Key Elements of Tornadogenesis.pdf
After analyzing the RFD occlusion, each storm was examined in detail to identify as many characteristics as possible for the 208 high-end tornadic supercells.
By the end of the project, the total amount of time to analyze the 208 supercells was about 1,500 hours. The following seven categories were considered the most important for each supercell, although much more data was collected.
5) Schematic of Supercell at Violent Tornado Stage (Adapted From Lemon 1979).pdf
Schematic of a supercell at the violent tornado stage (adapted from Lemon and Doswell 1979). The rear flank downdraft is red, forward flank downdraft is blue, updraft is brown and tornado is purple. The inflow channel is the narrow corridor (brown) north and west of the tornado. The inflection point (blue to red) is located north of the inflow channel. Streamlines are at 300 meters above ground level.
6) Salyersville, KY Tornadic Supercell on March 2, 2012 - FFD, RFD, Tornado, ...
The supercell that produced the EF3 at Salyersville, Kentucky on March 2, 2012. The RFD boundary is purple and occlusion downdraft is encircled in maroon just southeast of the tornado. The nose of the occlusion downdraft is circled in blue just east-northeast of the tornado. Davies-Jones 2006, Markowski 2002, Lee et al. 2011, 2012 explain more about the occlusion downdraft.
6a) RFD-FFD Boundary Locations For Six Well-organized HIgh-end Supercells.pdf
Estimated locations for the RFD boundary (blue) and FFD boundary (purple) for six notable high-end tornadic supercells. These supercells were at peak organization with the inflection point washed out.
6b) Reflectivity Boundary Position Estimate.pdf
Estimate of RFD boundary position (black) using the reflectivity image for Moore, Oklahoma on May 10, 2010. For every RFD boundary estimate, both reflectivity and base velocity were used together, but one was chosen as primary.
6c) Schematic of a Classic Rear Flank Downdraft.pdf
A schematic showing the rear flank downdraft of a tornadic supercell. The RFD occlusion or tornado is at the center of rotational convergence within the RFD. The curved dashed line is the outline of the hook echo. The white area is inflow to the updraft. Gray indicates relatively warm downdraft outflow. An unstable RFD is favorable for tornadogenesis. A couple hundred meters above the surface, winds generally turn south-southwest or southwesterly in the area south of the hook. Graphic obtained from Markowski et al. 2002.
6d) Base Velocity Estimate Overlaid on Reflectivity Base Velocity RFD Boundar...
An example showing the location of the RFD occlusion associated with the Moore, Oklahoma EF5 tornado on May 20, 2013. Base velocity (right) was used as primary to draw the RFD boundary. This location in black was super-imposed onto reflectivity (left). Even though base velocity was the primary indicator for the estimate, reflectivity also shows the RFD boundary well.
7) Estimated Tornado Start Location Relative To RFD Boundary Location For 208...
The distribution of tornadoes relative to the RFD boundary near the tornado start time. 201 of the 208 tornado start locations (96.6%) were more than a quarter nautical mile to the west of the RFD boundary. Seven of the 208 cases (3.4%) were located near the RFD boundary, with three of the seven (1.4%) located on the RFD boundary itself.
8) Tornado Start Location Frequency Relative To RFD Boundary Position For 208...
Contoured estimate of tornado start location relative to the position of the RFD boundary for 208 high-end tornadic supercells. The highest tornado incidence occurred 1.65 nautical miles west and 1.07 nautical miles south of the RFD boundary.
8a) Tornado Start Location Frequency Relative To RFD Boundary Position For 20...
Estimated tornado start locations relative to the RFD boundary for the first and second half of the dataset (left), and east and west of the Mississippi River (middle). The distribution of points is shown for the reflectivity and base velocity scans (right), depending upon which one was used as the primary indicator.
9) EF5 Tornado Frequency Relative To RFD Boundary and EF4-EF5 Tornado Frequen...
Frequency of EF4-EF5 tornadoes (left) and EF5 tornadoes (right), relative to the position of the RFD boundary.
10) Hypothesis - Critical Role of the RFD Surge, Schematic Created and Modifi...
A schematic showing the process of tornadogenesis involving an RFD surge beginning just over 13 minutes before the tornado start time. The RFD surge creates the inflow channel, as the RFD surge impinges on the inflow sector. This likely induces a pressure drop due to the Bernoulli Effect, which strengthens the RFD occlusion. The tornado forms after the RFD occlusion matures beneath the low-level mesocyclone, most often in the RFD’s northeast quadrant.
10a) Schematic of RFD Surging Beneath Mesocyclone with Rapid Intensification ...
RFD boundary surges northeastward toward the forward flank. As the RFD boundary impinges on the supercell’s inflow sector, an inflow channel is created. This induces a pressure drop due to the Bernoulli Effect, which strengthens the RFD occlusion. Also, restriction within the inflow channel causes the RFD occlusion to rapidly deepen as air is evacuated upward through the mesocyclone at a faster rate than can be replaced below. The tornado forms after the RFD occlusion matures beneath the low-level meso, most often in the RFD’s northeast quadrant. The descending reflectivity core (DRC) is in dark gray, which wraps around the RFD occlusion near the tornado start time (see Part 2).
11) RFD Surge Identification Method.pdf
An RFD surge was found for all 208 cases. The following method was used to identify the start and end points of the RFD surge, and to measure the RFD surge’s speed relative to the supercell’s speed.
First, the case was loaded and studied for about 15 minutes. The tornado start location was marked. Then, the RFD boundary location was estimated at high confidence times before and after the tornado start time. The examination paid close attention to the movement of precipitation behind the RFD boundary. Four questions listed below, were asked in order to determine when the RFD surge started and ended.
1) When did the precipitation gradient, just behind the RFD boundary, begin to accelerate relative to the storm’s movement?
2) When did the precipitation gradient, just behind the RFD boundary, obtain a bowed or curved appearance?
3) When did the precipitation gradient, just behind the RFD boundary, reach the forward flank?
4) When did the precipitation gradient, just behind the RFD boundary, decelerate relative to the storm’s movement?
Reflectivity data were used exclusively to determine when the RFD surge began and ended. The RFD surge was considered a time period when the leading edge of precipitation, just behind the RFD boundary, moved at a speed faster than the supercell’s speed. This involved an acceleration and then deceleration of the leading edge of precipitation.
11a) RFD Surge Analysis - Sibley, Iowa EF4 Tornado on June 25, 2010.pdf
RFD surge analysis for the Sibley, Iowa EF4 tornado on June 25, 2010. A cell merger ongoing in panel 1, instigates the RFD surge. The RFD surge starting point (panel 2) and ending point (panel 6), are marked. During the RFD surge, the reflectivity structure bulges and rapidly expands (panel 3 and 4). A bowing shape develops in panel 5. The RFD surge ends when it reaches the forward flank (panel 6).
12) Average RFD Surge Times Relative To Tornado Start Time For All 208 Superc...
Sorted distribution of RFD surge storm relative speed for all 208 supercells. The average RFD surge storm relative speed ranged from just under two knots to just over 20 knots. The RFD’s primary role during tornadogenesis is to move the RFD boundary toward the FFD boundary, in order to create an inflow channel. A fast storm relative speed is not necessary to accomplish this task.
13) RFD Surge Type 1 (66.3 Percent) Rozel, KS EF4 - 5-19-2013.pdf
Type 1 RFD surge (at right), in which the low-level mesocyclone is initially above the RFD. During the RFD surge, the RFD boundary moves toward the supercell’s forward flank. The RFD occlusion develops and matures, which is followed by tornado formation in the RFD occlusion. The tornado most often forms in the northeast quadrant of the RFD.
For the Rozel, Kansas EF4 tornado on May 19, 2013 (at right), a prominent cell merger started the RFD surge. The mesocyclone was located to the west of the RFD boundary (panel 1). The cell merger caused an enhanced downdraft to move southeast, creating a long pendant (panel 2). The RFD occlusion developed at the pendant’s southeast end. The tornado formed as the RFD boundary surged northeastward toward the forward flank. This created a narrow inflow channel (panel 3 and 4). 300 meter ground-relative flow is estimated based on cell movement and outflow.
14) RFD Surge Type (30.3 Percent) Fackler, AL EF4 - 4-27-2011.pdf
Type 2 RFD surge (at right), in which the RFD surge is initially ahead of the RFD boundary. The RFD boundary moves underneath the low-level mesocyclone and then away toward the forward flank. The RFD occlusion develops and matures after the low-level mesocyclone has been undercut. This is followed by tornado formation within the RFD occlusion.
For the Fackler, Alabama EF4 tornado on April 27, 2011 (to right), the RFD surge was instigated by cell mergers to the southwest of the RFD boundary. The RFD surge was very strong, with a 117 knot max outbound noted in panel two. The inflow channel became narrow as the RFD boundary pushed toward the forward flank (panel 3). Reflectors quickly disappear around the new tornado (panel 4), likely due to absorption by the rapidly strengthening tornado. 300 meter ground-relative flow is estimated based on cell movement and outflow.
15) RFD Surge Type (3.4 Percent) Ravanna, KS EF3 - 5-24-2016.pdf
Type 3 RFD surge (at right), in which the low-level mesocyclone is initially ahead of the RFD boundary. The RFD boundary surges toward the supercell’s forward flank, and to the center of the low-level mesocyclone. An RFD occlusion forms on the RFD boundary, underneath the low-level mesocyclone. The tornado develops within the RFD occlusion, on the RFD boundary, eventually moving southwestward into the RFD.
For the Ravanna, Kansas EF3 tornado on May 24, 2016 (at right), the mesocyclone was initially to the east of the RFD boundary. The RFD surge was instigated by outflow associated with cell mergers west of the boundary (panel 2). As the RFD surged toward the forward flank, the RFD occlusion developed on the RFD boundary (panel 2 and 3). Then, the tornado formed in the RFD occlusion (panel 4). 300 meter ground-relative flow is estimated based on cell movement and outflow.
16) Northward-moving Wave Disrupts RFD and EF4 Tornado near Goldsby, OK on Ma...
An example showing the Goldsby, Oklahoma EF4 tornado on May 24, 2011, in which the RFD was disrupted by a northward-moving wave. First, a left-moving supercell from north Texas approached the Goldsby supercell at near 65 nautical miles per hour. Outflow associated with the cell merger enhances vertical vorticity, causing the tornado to strengthen and reach peak intensity (panel 2). After the cell merger, a northward-moving wave associated with the left-mover, hit the Goldsby supercell’s RFD. The back edge of the RFD retreated northward (panels 4, 5 and 6), and eventually the backed flow associated with the northward-moving wave pushed the flanking line precipitation away from the mesocyclone (panels 7 and 8). This disrupted the RFD causing the tornado to dissipate.
17) EF3 Forms After 2nd RFD Surge Undercuts Low-level Meso at Hillsboro, ND o...
An example showing the Hillsboro, North Dakota EF3 tornadic supercell on August 27, 2016, in which there were two RFD surges. The first RFD surge did not produce a tornado, while the second did. The first RFD surge pushed southward and did not undercut the low-level mesocyclone. Veered flow at 700 mb and a lack of cell mergers were limiting factors, keeping the first RFD surge to the west of the low-level meso. The second RFD surge pushed eastward, undercutting the low-level meso. The second RFD surge was aided by cell outflow and cell mergers during the 15 minutes preceding the tornado. Veered low to mid-level flow, associated with northwest flow aloft, can contribute to a problem in which a supercell’s RFD surge takes place too far west. When this happens, it can be difficult for the RFD to undercut the low-level mesocyclone. This problem makes tornadogenesis more unlikely in summer.
18) Times of Cell Mergers Associated with Tornadogenesis Relative To Tornado ...
During the cell merger analysis, all 208 cases were examined twice. The first examination pass identified cell mergers that occurred closer to the tornado start time. Within this first pass, clustering within the distribution was found at two time periods. The first was found to occur just a few minutes prior to the tornado start time. A second was found further out in time, generally between five and ten minutes prior to the tornado. During the first examination, it was observed that another cell merger was commonly occurring more than 10 minutes prior to the tornado start time. And this cell merger was often happening just before the start of the RFD surge. As a result, a second pass through the 208 cases was completed to identify cell mergers further out before the tornado start time. The cell merger that was identified during the second pass was called cell merger one, while the two cell mergers that were identified during the first pass were called cell merger two and three. After all the analysis was done, a cell merger two was found in more cases than a cell merger one. This is because a cell merger midway through the tornadogenesis process was slightly more common than a cell merger near the beginning of the tornadogenesis process. The first and second examinations were completely independent of each other, which revealed more detail concerning the distribution.
Using the three periods of cell merger clustering, average times prior to the tornado start time were computed. The 208 case average of those times are listed below, with the number of cases identified for each time, and the percent of occurrence listed in Table 1.
19) Location of 77 Cell Mergers That Instigated RFD Surges Relative To Pendan...
The locations of cell merger one for 77 cell mergers relative to the pendant, that likely instigated RFD surges prior to high-end tornadogenesis from June 5, 2010 to March 15, 2012.
Holsinger, Bruce W. - Music, body and desire in medieval culture [2001].pdf
Music and Medieval History
TOPIC OF DISCUSSION: CENTRIFUGATION SLIDESHARE.pptx
Centrifugation is a powerful technique used in laboratories to separate components of a heterogeneous mixture based on their density. This process utilizes centrifugal force to rapidly spin samples, causing denser particles to migrate outward more quickly than lighter ones. As a result, distinct layers form within the sample tube, allowing for easy isolation and purification of target substances.
More Related Content
More from JohnChrisBroyles
6a) RFD-FFD Boundary Locations For Six Well-organized HIgh-end Supercells.pdf
Estimated locations for the RFD boundary (blue) and FFD boundary (purple) for six notable high-end tornadic supercells. These supercells were at peak organization with the inflection point washed out.
6b) Reflectivity Boundary Position Estimate.pdf
Estimate of RFD boundary position (black) using the reflectivity image for Moore, Oklahoma on May 10, 2010. For every RFD boundary estimate, both reflectivity and base velocity were used together, but one was chosen as primary.
6c) Schematic of a Classic Rear Flank Downdraft.pdf
A schematic showing the rear flank downdraft of a tornadic supercell. The RFD occlusion or tornado is at the center of rotational convergence within the RFD. The curved dashed line is the outline of the hook echo. The white area is inflow to the updraft. Gray indicates relatively warm downdraft outflow. An unstable RFD is favorable for tornadogenesis. A couple hundred meters above the surface, winds generally turn south-southwest or southwesterly in the area south of the hook. Graphic obtained from Markowski et al. 2002.
6d) Base Velocity Estimate Overlaid on Reflectivity Base Velocity RFD Boundar...
An example showing the location of the RFD occlusion associated with the Moore, Oklahoma EF5 tornado on May 20, 2013. Base velocity (right) was used as primary to draw the RFD boundary. This location in black was super-imposed onto reflectivity (left). Even though base velocity was the primary indicator for the estimate, reflectivity also shows the RFD boundary well.
7) Estimated Tornado Start Location Relative To RFD Boundary Location For 208...
The distribution of tornadoes relative to the RFD boundary near the tornado start time. 201 of the 208 tornado start locations (96.6%) were more than a quarter nautical mile to the west of the RFD boundary. Seven of the 208 cases (3.4%) were located near the RFD boundary, with three of the seven (1.4%) located on the RFD boundary itself.
8) Tornado Start Location Frequency Relative To RFD Boundary Position For 208...
Contoured estimate of tornado start location relative to the position of the RFD boundary for 208 high-end tornadic supercells. The highest tornado incidence occurred 1.65 nautical miles west and 1.07 nautical miles south of the RFD boundary.
8a) Tornado Start Location Frequency Relative To RFD Boundary Position For 20...
Estimated tornado start locations relative to the RFD boundary for the first and second half of the dataset (left), and east and west of the Mississippi River (middle). The distribution of points is shown for the reflectivity and base velocity scans (right), depending upon which one was used as the primary indicator.
9) EF5 Tornado Frequency Relative To RFD Boundary and EF4-EF5 Tornado Frequen...
Frequency of EF4-EF5 tornadoes (left) and EF5 tornadoes (right), relative to the position of the RFD boundary.
10) Hypothesis - Critical Role of the RFD Surge, Schematic Created and Modifi...
A schematic showing the process of tornadogenesis involving an RFD surge beginning just over 13 minutes before the tornado start time. The RFD surge creates the inflow channel, as the RFD surge impinges on the inflow sector. This likely induces a pressure drop due to the Bernoulli Effect, which strengthens the RFD occlusion. The tornado forms after the RFD occlusion matures beneath the low-level mesocyclone, most often in the RFD’s northeast quadrant.
10a) Schematic of RFD Surging Beneath Mesocyclone with Rapid Intensification ...
RFD boundary surges northeastward toward the forward flank. As the RFD boundary impinges on the supercell’s inflow sector, an inflow channel is created. This induces a pressure drop due to the Bernoulli Effect, which strengthens the RFD occlusion. Also, restriction within the inflow channel causes the RFD occlusion to rapidly deepen as air is evacuated upward through the mesocyclone at a faster rate than can be replaced below. The tornado forms after the RFD occlusion matures beneath the low-level meso, most often in the RFD’s northeast quadrant. The descending reflectivity core (DRC) is in dark gray, which wraps around the RFD occlusion near the tornado start time (see Part 2).
11) RFD Surge Identification Method.pdf
An RFD surge was found for all 208 cases. The following method was used to identify the start and end points of the RFD surge, and to measure the RFD surge’s speed relative to the supercell’s speed.
First, the case was loaded and studied for about 15 minutes. The tornado start location was marked. Then, the RFD boundary location was estimated at high confidence times before and after the tornado start time. The examination paid close attention to the movement of precipitation behind the RFD boundary. Four questions listed below, were asked in order to determine when the RFD surge started and ended.
1) When did the precipitation gradient, just behind the RFD boundary, begin to accelerate relative to the storm’s movement?
2) When did the precipitation gradient, just behind the RFD boundary, obtain a bowed or curved appearance?
3) When did the precipitation gradient, just behind the RFD boundary, reach the forward flank?
4) When did the precipitation gradient, just behind the RFD boundary, decelerate relative to the storm’s movement?
Reflectivity data were used exclusively to determine when the RFD surge began and ended. The RFD surge was considered a time period when the leading edge of precipitation, just behind the RFD boundary, moved at a speed faster than the supercell’s speed. This involved an acceleration and then deceleration of the leading edge of precipitation.
11a) RFD Surge Analysis - Sibley, Iowa EF4 Tornado on June 25, 2010.pdf
RFD surge analysis for the Sibley, Iowa EF4 tornado on June 25, 2010. A cell merger ongoing in panel 1, instigates the RFD surge. The RFD surge starting point (panel 2) and ending point (panel 6), are marked. During the RFD surge, the reflectivity structure bulges and rapidly expands (panel 3 and 4). A bowing shape develops in panel 5. The RFD surge ends when it reaches the forward flank (panel 6).
12) Average RFD Surge Times Relative To Tornado Start Time For All 208 Superc...
Sorted distribution of RFD surge storm relative speed for all 208 supercells. The average RFD surge storm relative speed ranged from just under two knots to just over 20 knots. The RFD’s primary role during tornadogenesis is to move the RFD boundary toward the FFD boundary, in order to create an inflow channel. A fast storm relative speed is not necessary to accomplish this task.
13) RFD Surge Type 1 (66.3 Percent) Rozel, KS EF4 - 5-19-2013.pdf
Type 1 RFD surge (at right), in which the low-level mesocyclone is initially above the RFD. During the RFD surge, the RFD boundary moves toward the supercell’s forward flank. The RFD occlusion develops and matures, which is followed by tornado formation in the RFD occlusion. The tornado most often forms in the northeast quadrant of the RFD.
For the Rozel, Kansas EF4 tornado on May 19, 2013 (at right), a prominent cell merger started the RFD surge. The mesocyclone was located to the west of the RFD boundary (panel 1). The cell merger caused an enhanced downdraft to move southeast, creating a long pendant (panel 2). The RFD occlusion developed at the pendant’s southeast end. The tornado formed as the RFD boundary surged northeastward toward the forward flank. This created a narrow inflow channel (panel 3 and 4). 300 meter ground-relative flow is estimated based on cell movement and outflow.
14) RFD Surge Type (30.3 Percent) Fackler, AL EF4 - 4-27-2011.pdf
Type 2 RFD surge (at right), in which the RFD surge is initially ahead of the RFD boundary. The RFD boundary moves underneath the low-level mesocyclone and then away toward the forward flank. The RFD occlusion develops and matures after the low-level mesocyclone has been undercut. This is followed by tornado formation within the RFD occlusion.
For the Fackler, Alabama EF4 tornado on April 27, 2011 (to right), the RFD surge was instigated by cell mergers to the southwest of the RFD boundary. The RFD surge was very strong, with a 117 knot max outbound noted in panel two. The inflow channel became narrow as the RFD boundary pushed toward the forward flank (panel 3). Reflectors quickly disappear around the new tornado (panel 4), likely due to absorption by the rapidly strengthening tornado. 300 meter ground-relative flow is estimated based on cell movement and outflow.
15) RFD Surge Type (3.4 Percent) Ravanna, KS EF3 - 5-24-2016.pdf
Type 3 RFD surge (at right), in which the low-level mesocyclone is initially ahead of the RFD boundary. The RFD boundary surges toward the supercell’s forward flank, and to the center of the low-level mesocyclone. An RFD occlusion forms on the RFD boundary, underneath the low-level mesocyclone. The tornado develops within the RFD occlusion, on the RFD boundary, eventually moving southwestward into the RFD.
For the Ravanna, Kansas EF3 tornado on May 24, 2016 (at right), the mesocyclone was initially to the east of the RFD boundary. The RFD surge was instigated by outflow associated with cell mergers west of the boundary (panel 2). As the RFD surged toward the forward flank, the RFD occlusion developed on the RFD boundary (panel 2 and 3). Then, the tornado formed in the RFD occlusion (panel 4). 300 meter ground-relative flow is estimated based on cell movement and outflow.
16) Northward-moving Wave Disrupts RFD and EF4 Tornado near Goldsby, OK on Ma...
An example showing the Goldsby, Oklahoma EF4 tornado on May 24, 2011, in which the RFD was disrupted by a northward-moving wave. First, a left-moving supercell from north Texas approached the Goldsby supercell at near 65 nautical miles per hour. Outflow associated with the cell merger enhances vertical vorticity, causing the tornado to strengthen and reach peak intensity (panel 2). After the cell merger, a northward-moving wave associated with the left-mover, hit the Goldsby supercell’s RFD. The back edge of the RFD retreated northward (panels 4, 5 and 6), and eventually the backed flow associated with the northward-moving wave pushed the flanking line precipitation away from the mesocyclone (panels 7 and 8). This disrupted the RFD causing the tornado to dissipate.
17) EF3 Forms After 2nd RFD Surge Undercuts Low-level Meso at Hillsboro, ND o...
An example showing the Hillsboro, North Dakota EF3 tornadic supercell on August 27, 2016, in which there were two RFD surges. The first RFD surge did not produce a tornado, while the second did. The first RFD surge pushed southward and did not undercut the low-level mesocyclone. Veered flow at 700 mb and a lack of cell mergers were limiting factors, keeping the first RFD surge to the west of the low-level meso. The second RFD surge pushed eastward, undercutting the low-level meso. The second RFD surge was aided by cell outflow and cell mergers during the 15 minutes preceding the tornado. Veered low to mid-level flow, associated with northwest flow aloft, can contribute to a problem in which a supercell’s RFD surge takes place too far west. When this happens, it can be difficult for the RFD to undercut the low-level mesocyclone. This problem makes tornadogenesis more unlikely in summer.
18) Times of Cell Mergers Associated with Tornadogenesis Relative To Tornado ...
During the cell merger analysis, all 208 cases were examined twice. The first examination pass identified cell mergers that occurred closer to the tornado start time. Within this first pass, clustering within the distribution was found at two time periods. The first was found to occur just a few minutes prior to the tornado start time. A second was found further out in time, generally between five and ten minutes prior to the tornado. During the first examination, it was observed that another cell merger was commonly occurring more than 10 minutes prior to the tornado start time. And this cell merger was often happening just before the start of the RFD surge. As a result, a second pass through the 208 cases was completed to identify cell mergers further out before the tornado start time. The cell merger that was identified during the second pass was called cell merger one, while the two cell mergers that were identified during the first pass were called cell merger two and three. After all the analysis was done, a cell merger two was found in more cases than a cell merger one. This is because a cell merger midway through the tornadogenesis process was slightly more common than a cell merger near the beginning of the tornadogenesis process. The first and second examinations were completely independent of each other, which revealed more detail concerning the distribution.
Using the three periods of cell merger clustering, average times prior to the tornado start time were computed. The 208 case average of those times are listed below, with the number of cases identified for each time, and the percent of occurrence listed in Table 1.
19) Location of 77 Cell Mergers That Instigated RFD Surges Relative To Pendan...
The locations of cell merger one for 77 cell mergers relative to the pendant, that likely instigated RFD surges prior to high-end tornadogenesis from June 5, 2010 to March 15, 2012.
More from JohnChrisBroyles (20)
6a) RFD-FFD Boundary Locations For Six Well-organized HIgh-end Supercells.pdf
6a) RFD-FFD Boundary Locations For Six Well-organized HIgh-end Supercells.pdf
6c) Schematic of a Classic Rear Flank Downdraft.pdf
6c) Schematic of a Classic Rear Flank Downdraft.pdf
6d) Base Velocity Estimate Overlaid on Reflectivity Base Velocity RFD Boundar...
6d) Base Velocity Estimate Overlaid on Reflectivity Base Velocity RFD Boundar...
7) Estimated Tornado Start Location Relative To RFD Boundary Location For 208...
7) Estimated Tornado Start Location Relative To RFD Boundary Location For 208...
8) Tornado Start Location Frequency Relative To RFD Boundary Position For 208...
8) Tornado Start Location Frequency Relative To RFD Boundary Position For 208...
8a) Tornado Start Location Frequency Relative To RFD Boundary Position For 20...
8a) Tornado Start Location Frequency Relative To RFD Boundary Position For 20...
9) EF5 Tornado Frequency Relative To RFD Boundary and EF4-EF5 Tornado Frequen...
9) EF5 Tornado Frequency Relative To RFD Boundary and EF4-EF5 Tornado Frequen...
10) Hypothesis - Critical Role of the RFD Surge, Schematic Created and Modifi...
10) Hypothesis - Critical Role of the RFD Surge, Schematic Created and Modifi...
10a) Schematic of RFD Surging Beneath Mesocyclone with Rapid Intensification ...
10a) Schematic of RFD Surging Beneath Mesocyclone with Rapid Intensification ...
11a) RFD Surge Analysis - Sibley, Iowa EF4 Tornado on June 25, 2010.pdf
11a) RFD Surge Analysis - Sibley, Iowa EF4 Tornado on June 25, 2010.pdf
12) Average RFD Surge Times Relative To Tornado Start Time For All 208 Superc...
12) Average RFD Surge Times Relative To Tornado Start Time For All 208 Superc...
13) RFD Surge Type 1 (66.3 Percent) Rozel, KS EF4 - 5-19-2013.pdf
13) RFD Surge Type 1 (66.3 Percent) Rozel, KS EF4 - 5-19-2013.pdf
14) RFD Surge Type (30.3 Percent) Fackler, AL EF4 - 4-27-2011.pdf
14) RFD Surge Type (30.3 Percent) Fackler, AL EF4 - 4-27-2011.pdf
15) RFD Surge Type (3.4 Percent) Ravanna, KS EF3 - 5-24-2016.pdf
15) RFD Surge Type (3.4 Percent) Ravanna, KS EF3 - 5-24-2016.pdf
16) Northward-moving Wave Disrupts RFD and EF4 Tornado near Goldsby, OK on Ma...
16) Northward-moving Wave Disrupts RFD and EF4 Tornado near Goldsby, OK on Ma...
17) EF3 Forms After 2nd RFD Surge Undercuts Low-level Meso at Hillsboro, ND o...
17) EF3 Forms After 2nd RFD Surge Undercuts Low-level Meso at Hillsboro, ND o...
18) Times of Cell Mergers Associated with Tornadogenesis Relative To Tornado ...
18) Times of Cell Mergers Associated with Tornadogenesis Relative To Tornado ...
19) Location of 77 Cell Mergers That Instigated RFD Surges Relative To Pendan...
19) Location of 77 Cell Mergers That Instigated RFD Surges Relative To Pendan...
Recently uploaded
Holsinger, Bruce W. - Music, body and desire in medieval culture [2001].pdf
Music and Medieval History
TOPIC OF DISCUSSION: CENTRIFUGATION SLIDESHARE.pptx
Centrifugation is a powerful technique used in laboratories to separate components of a heterogeneous mixture based on their density. This process utilizes centrifugal force to rapidly spin samples, causing denser particles to migrate outward more quickly than lighter ones. As a result, distinct layers form within the sample tube, allowing for easy isolation and purification of target substances.
Evidence of Jet Activity from the Secondary Black Hole in the OJ 287 Binary S...
Wereport the study of a huge optical intraday flare on 2021 November 12 at 2 a.m. UT in the blazar OJ287. In the binary black hole model, it is associated with an impact of the secondary black hole on the accretion disk of the primary. Our multifrequency observing campaign was set up to search for such a signature of the impact based on a prediction made 8 yr earlier. The first I-band results of the flare have already been reported by Kishore et al. (2024). Here we combine these data with our monitoring in the R-band. There is a big change in the R–I spectral index by 1.0 ±0.1 between the normal background and the flare, suggesting a new component of radiation. The polarization variation during the rise of the flare suggests the same. The limits on the source size place it most reasonably in the jet of the secondary BH. We then ask why we have not seen this phenomenon before. We show that OJ287 was never before observed with sufficient sensitivity on the night when the flare should have happened according to the binary model. We also study the probability that this flare is just an oversized example of intraday variability using the Krakow data set of intense monitoring between 2015 and 2023. We find that the occurrence of a flare of this size and rapidity is unlikely. In machine-readable Tables 1 and 2, we give the full orbit-linked historical light curve of OJ287 as well as the dense monitoring sample of Krakow.
Gadgets for management of stored product pests_Dr.UPR.pdf
Insectsplayamajorroleinthedeteriorationoffoodgrainscausingbothquantitativeandqualitativelosses
Wellprovedthatnogranariescanbefilledwithgrainswithoutinsectsastheharvestedproducecontainegg(or)larvae(or)pupae(or)adultinsectinthembecauseoffieldcarryoverinfestationwhichcannotbeavoidedindevelopingcountrieslikeIndia
Simpletechnologiesfortimelydetectionofinsectsinthestoredproduceandtherebyplantimelycontrolmeasures
Call Girls Noida🔥9873777170🔥Gorgeous Escorts in Noida Available 24/7
Call Girls Noida🔥9873777170🔥Gorgeous Escorts in Noida Available 24/7
Sexuality - Issues, Attitude and Behaviour - Applied Social Psychology - Psyc...
A proprietary approach developed by bringing together the best of learning theories from Psychology, design principles from the world of visualization, and pedagogical methods from over a decade of training experience, that enables you to: Learn better, faster!
Discovery of An Apparent Red, High-Velocity Type Ia Supernova at 𝐳 = 2.9 wi...
We present the JWST discovery of SN 2023adsy, a transient object located in a host galaxy JADES-GS
+
53.13485
−
27.82088
with a host spectroscopic redshift of
2.903
±
0.007
. The transient was identified in deep James Webb Space Telescope (JWST)/NIRCam imaging from the JWST Advanced Deep Extragalactic Survey (JADES) program. Photometric and spectroscopic followup with NIRCam and NIRSpec, respectively, confirm the redshift and yield UV-NIR light-curve, NIR color, and spectroscopic information all consistent with a Type Ia classification. Despite its classification as a likely SN Ia, SN 2023adsy is both fairly red (
�
(
�
−
�
)
∼
0.9
) despite a host galaxy with low-extinction and has a high Ca II velocity (
19
,
000
±
2
,
000
km/s) compared to the general population of SNe Ia. While these characteristics are consistent with some Ca-rich SNe Ia, particularly SN 2016hnk, SN 2023adsy is intrinsically brighter than the low-
�
Ca-rich population. Although such an object is too red for any low-
�
cosmological sample, we apply a fiducial standardization approach to SN 2023adsy and find that the SN 2023adsy luminosity distance measurement is in excellent agreement (
≲
1
�
) with
Λ
CDM. Therefore unlike low-
�
Ca-rich SNe Ia, SN 2023adsy is standardizable and gives no indication that SN Ia standardized luminosities change significantly with redshift. A larger sample of distant SNe Ia is required to determine if SN Ia population characteristics at high-
�
truly diverge from their low-
�
counterparts, and to confirm that standardized luminosities nevertheless remain constant with redshift.
Methods of grain storage Structures in India.pdf
•Post-harvestlossesaccountforabout10%oftotalfoodgrainsduetounscientificstorage,insects,rodents,micro-organismsetc.,
•Totalfoodgrainproductioninindiais311milliontonnesandstorageis145mt.InIndia,annualstoragelosseshavebeenestimated14mtworthofRs.7,000croreinwhichinsectsaloneaccountfornearlyRs.1,300crores.
•InIndiaoutofthetotalproduction,about30%ismarketablesurplus
•Remaining70%isretainedandstoredbyfarmersforconsumption,seed,feed.Hence,growerneedstoragefacilitytoholdaportionofproducetosellwhenthemarketingpriceisfavourable
•TradersandCo-operativesatmarketcentresneedstoragestructurestoholdgrainswhenthetransportfacilityisinadequate
Signatures of wave erosion in Titan’s coasts
The shorelines of Titan’s hydrocarbon seas trace flooded erosional landforms such as river valleys; however, it isunclear whether coastal erosion has subsequently altered these shorelines. Spacecraft observations and theo-retical models suggest that wind may cause waves to form on Titan’s seas, potentially driving coastal erosion,but the observational evidence of waves is indirect, and the processes affecting shoreline evolution on Titanremain unknown. No widely accepted framework exists for using shoreline morphology to quantitatively dis-cern coastal erosion mechanisms, even on Earth, where the dominant mechanisms are known. We combinelandscape evolution models with measurements of shoreline shape on Earth to characterize how differentcoastal erosion mechanisms affect shoreline morphology. Applying this framework to Titan, we find that theshorelines of Titan’s seas are most consistent with flooded landscapes that subsequently have been eroded bywaves, rather than a uniform erosional process or no coastal erosion, particularly if wave growth saturates atfetch lengths of tens of kilometers.
Firoozeh Kashani-Sabet - An Esteemed Professor
Dr. Firoozeh Kashani-Sabet is an innovator in Middle Eastern Studies and approaches her work, particularly focused on Iran, with a depth and commitment that has resulted in multiple book publications. She is notable for her work with the University of Pennsylvania, where she serves as the Walter H. Annenberg Professor of History.
Candidate young stellar objects in the S-cluster: Kinematic analysis of a sub...
Context. The observation of several L-band emission sources in the S cluster has led to a rich discussion of their nature. However, a definitive answer to the classification of the dusty objects requires an explanation for the detection of compact Doppler-shifted Brγ emission. The ionized hydrogen in combination with the observation of mid-infrared L-band continuum emission suggests that most of these sources are embedded in a dusty envelope. These embedded sources are part of the S-cluster, and their relationship to the S-stars is still under debate. To date, the question of the origin of these two populations has been vague, although all explanations favor migration processes for the individual cluster members. Aims. This work revisits the S-cluster and its dusty members orbiting the supermassive black hole SgrA* on bound Keplerian orbits from a kinematic perspective. The aim is to explore the Keplerian parameters for patterns that might imply a nonrandom distribution of the sample. Additionally, various analytical aspects are considered to address the nature of the dusty sources. Methods. Based on the photometric analysis, we estimated the individual H−K and K−L colors for the source sample and compared the results to known cluster members. The classification revealed a noticeable contrast between the S-stars and the dusty sources. To fit the flux-density distribution, we utilized the radiative transfer code HYPERION and implemented a young stellar object Class I model. We obtained the position angle from the Keplerian fit results; additionally, we analyzed the distribution of the inclinations and the longitudes of the ascending node. Results. The colors of the dusty sources suggest a stellar nature consistent with the spectral energy distribution in the near and midinfrared domains. Furthermore, the evaporation timescales of dusty and gaseous clumps in the vicinity of SgrA* are much shorter ( 2yr) than the epochs covered by the observations (≈15yr). In addition to the strong evidence for the stellar classification of the D-sources, we also find a clear disk-like pattern following the arrangements of S-stars proposed in the literature. Furthermore, we find a global intrinsic inclination for all dusty sources of 60 ± 20◦, implying a common formation process. Conclusions. The pattern of the dusty sources manifested in the distribution of the position angles, inclinations, and longitudes of the ascending node strongly suggests two different scenarios: the main-sequence stars and the dusty stellar S-cluster sources share a common formation history or migrated with a similar formation channel in the vicinity of SgrA*. Alternatively, the gravitational influence of SgrA* in combination with a massive perturber, such as a putative intermediate mass black hole in the IRS 13 cluster, forces the dusty objects and S-stars to follow a particular orbital arrangement. Key words. stars: black holes– stars: formation– Galaxy: center– galaxies: star formation
MICROBIAL INTERACTION PPT/ MICROBIAL INTERACTION AND THEIR TYPES // PLANT MIC...
MICROBIAL INTERACTION PPT/ MICROBIAL INTERACTION AND THEIR TYPES // PLANT MIC...ABHISHEK SONI NIMT INSTITUTE OF MEDICAL AND PARAMEDCIAL SCIENCES , GOVT PG COLLEGE NOIDA
Microbial interaction
Microorganisms interacts with each other and can be physically associated with another organisms in a variety of ways.
One organism can be located on the surface of another organism as an ectobiont or located within another organism as endobiont.
Microbial interaction may be positive such as mutualism, proto-cooperation, commensalism or may be negative such as parasitism, predation or competition
Types of microbial interaction
Positive interaction: mutualism, proto-cooperation, commensalism
Negative interaction: Ammensalism (antagonism), parasitism, predation, competition
I. Mutualism:
It is defined as the relationship in which each organism in interaction gets benefits from association. It is an obligatory relationship in which mutualist and host are metabolically dependent on each other.
Mutualistic relationship is very specific where one member of association cannot be replaced by another species.
Mutualism require close physical contact between interacting organisms.
Relationship of mutualism allows organisms to exist in habitat that could not occupied by either species alone.
Mutualistic relationship between organisms allows them to act as a single organism.
Examples of mutualism:
i. Lichens:
Lichens are excellent example of mutualism.
They are the association of specific fungi and certain genus of algae. In lichen, fungal partner is called mycobiont and algal partner is called
II. Syntrophism:
It is an association in which the growth of one organism either depends on or improved by the substrate provided by another organism.
In syntrophism both organism in association gets benefits.
Compound A
Utilized by population 1
Compound B
Utilized by population 2
Compound C
utilized by both Population 1+2
Products
In this theoretical example of syntrophism, population 1 is able to utilize and metabolize compound A, forming compound B but cannot metabolize beyond compound B without co-operation of population 2. Population 2is unable to utilize compound A but it can metabolize compound B forming compound C. Then both population 1 and 2 are able to carry out metabolic reaction which leads to formation of end product that neither population could produce alone.
Examples of syntrophism:
i. Methanogenic ecosystem in sludge digester
Methane produced by methanogenic bacteria depends upon interspecies hydrogen transfer by other fermentative bacteria.
Anaerobic fermentative bacteria generate CO2 and H2 utilizing carbohydrates which is then utilized by methanogenic bacteria (Methanobacter) to produce methane.
ii. Lactobacillus arobinosus and Enterococcus faecalis:
In the minimal media, Lactobacillus arobinosus and Enterococcus faecalis are able to grow together but not alone.
The synergistic relationship between E. faecalis and L. arobinosus occurs in which E. faecalis require folic acid
JAMES WEBB STUDY THE MASSIVE BLACK HOLE SEEDS
The pathway(s) to seeding the massive black holes (MBHs) that exist at the heart of galaxies in the present and distant Universe remains an unsolved problem. Here we categorise, describe and quantitatively discuss the formation pathways of both light and heavy seeds. We emphasise that the most recent computational models suggest that rather than a bimodal-like mass spectrum between light and heavy seeds with light at one end and heavy at the other that instead a continuum exists. Light seeds being more ubiquitous and the heavier seeds becoming less and less abundant due the rarer environmental conditions required for their formation. We therefore examine the different mechanisms that give rise to different seed mass spectrums. We show how and why the mechanisms that produce the heaviest seeds are also among the rarest events in the Universe and are hence extremely unlikely to be the seeds for the vast majority of the MBH population. We quantify, within the limits of the current large uncertainties in the seeding processes, the expected number densities of the seed mass spectrum. We argue that light seeds must be at least 103 to 105 times more numerous than heavy seeds to explain the MBH population as a whole. Based on our current understanding of the seed population this makes heavy seeds (Mseed > 103 M⊙) a significantly more likely pathway given that heavy seeds have an abundance pattern than is close to and likely in excess of 10−4 compared to light seeds. Finally, we examine the current state-of-the-art in numerical calculations and recent observations and plot a path forward for near-future advances in both domains.
Mites,Slug,Snail_Infesting agricultural crops.pdf
Order : Trombidiformes (Acarina) Class : Arachnida
Mites normally feed on the undersurface of the leaves but the symptoms are more easily seen on the uppersurface.
Tetranychids produce blotching (Spots) on the leaf-surface.
Tarsonemids and Eriophyids produce distortion (twist), puckering (Folds) or stunting (Short) of leaves.
Eriophyids produce distinct galls or blisters (fluid-filled sac in the outer layer)
Recently uploaded (20)
Holsinger, Bruce W. - Music, body and desire in medieval culture [2001].pdf
Holsinger, Bruce W. - Music, body and desire in medieval culture [2001].pdf
TOPIC OF DISCUSSION: CENTRIFUGATION SLIDESHARE.pptx
TOPIC OF DISCUSSION: CENTRIFUGATION SLIDESHARE.pptx
Evidence of Jet Activity from the Secondary Black Hole in the OJ 287 Binary S...
Evidence of Jet Activity from the Secondary Black Hole in the OJ 287 Binary S...
Gadgets for management of stored product pests_Dr.UPR.pdf
Gadgets for management of stored product pests_Dr.UPR.pdf
acanthocytes_causes_etiology_clinical sognificance-future.pptx
acanthocytes_causes_etiology_clinical sognificance-future.pptx
Call Girls Noida🔥9873777170🔥Gorgeous Escorts in Noida Available 24/7
Call Girls Noida🔥9873777170🔥Gorgeous Escorts in Noida Available 24/7
Sexuality - Issues, Attitude and Behaviour - Applied Social Psychology - Psyc...
Sexuality - Issues, Attitude and Behaviour - Applied Social Psychology - Psyc...
Discovery of An Apparent Red, High-Velocity Type Ia Supernova at 𝐳 = 2.9 wi...
Discovery of An Apparent Red, High-Velocity Type Ia Supernova at 𝐳 = 2.9 wi...
Candidate young stellar objects in the S-cluster: Kinematic analysis of a sub...
Candidate young stellar objects in the S-cluster: Kinematic analysis of a sub...
MICROBIAL INTERACTION PPT/ MICROBIAL INTERACTION AND THEIR TYPES // PLANT MIC...
MICROBIAL INTERACTION PPT/ MICROBIAL INTERACTION AND THEIR TYPES // PLANT MIC...