Starting a startup can be an exciting and challenging endeavor. Here are some key considerations and steps to help you navigate the startup process:
Idea Generation: Start by generating and refining your business idea. Identify a problem or need in the market that your startup can address. Conduct market research to validate the demand and viability of your idea.
Business Plan: Create a comprehensive business plan that outlines your vision, target market, product or service offering, marketing strategy, financial projections, and competitive analysis. A well-structured business plan will guide your startup's growth and help attract investors or partners.
Market Analysis: Conduct a thorough analysis of your target market. Understand your potential customers, their preferences, and their pain points. Identify your unique selling proposition and differentiate your startup from competitors.
Funding: Determine the financial resources needed to launch and sustain your startup. Explore various funding options such as bootstrapping, loans, angel investors, venture capital, or crowdfunding. Develop a compelling pitch and business case to secure funding.
Legal and Regulatory Considerations: Understand the legal and regulatory requirements for operating your startup. Register your business, obtain necessary licenses or permits, and protect your intellectual property through patents, trademarks, or copyrights if applicable.
Team Building: Assemble a skilled and dedicated team to support your startup. Look for individuals who share your vision and bring complementary skills and expertise to the table. Foster a positive and collaborative work culture.
Minimum Viable Product (MVP): Develop a minimum viable product or prototype that demonstrates the core functionality of your product or service. Gather feedback from early adopters and iterate based on their input.
Marketing and Customer Acquisition: Create a marketing strategy to reach and acquire customers. Utilize various channels such as social media, content marketing, SEO, partnerships, and advertising. Focus on building brand awareness and customer engagement.
Agile Execution and Iteration: Embrace an agile approach to product development and business operations. Continuously gather feedback, analyze data, and iterate on your product, marketing, and business strategies. Adapt quickly to market changes and customer needs.
Scalability and Growth: Plan for scalability and long-term growth. Identify opportunities to expand your market reach, develop strategic partnerships, and explore new revenue streams. Continuously monitor and measure key performance indicators (KPIs) to track progress and make data-driven decisions.
This is a ppt paid template. This is free download for you here. Download and enjoy and make your presentation beautiful. This is very beneficial for you if your topic based on leadership or such type of content.
Approach For System Analysis PowerPoint Presentation SlidesSlideTeam
This PPT deck displays seventeen slides with in depth research. Our Approach For System Analysis PowerPoint Presentation Slides presentation deck is a helpful tool to plan, prepare, document and analyse the topic with a clear approach. We provide a ready to use deck with all sorts of relevant topics subtopics templates, charts and graphs, overviews, analysis templates. Outline all the important aspects without any hassle. It showcases of all kind of editable templates infographics for an inclusive and comprehensive Approach For System Analysis PowerPoint Presentation Slides presentation. Professionals, managers, individual and team involved in any company organization from any field can use them as per requirement. http://bit.ly/3bgb5Xx
Business Review PowerPoint Templates | Business Review PPT Slide Designs | Sl...SlideUpLift
http://bit.ly/2Qy3PfE - Use these 100% editable Business Review PowerPoint Templates to share your business results and highlights with the team or senior management. Build your Business Quarterly Reports and Annual Business Review Reports using these Professional PPT Templates. You can graphically explain your business reports using these creative PPT slide designs.
About us - SlideUpLift is a utility to help business professionals create powerful presentations using ready to use 100% editable PowerPoint tools and templates.
Control System PowerPoint Presentation SlidesSlideTeam
This deck consists of total of seventeen slides. It has PPT slides highlighting important topics of Control System PowerPoint Presentation Slides. This deck comprises of amazing visuals with thoroughly researched content. Each template is well crafted and designed by our PowerPoint experts. Our designers have included all the necessary PowerPoint layouts in this deck. From icons to graphs, this PPT deck has it all. The best part is that these templates are easily customizable. Just click the DOWNLOAD button shown below. Edit the colour, text, font size, add or delete the content as per the requirement. Download this deck now and engage your audience with this ready made presentation. http://bit.ly/39ixPVf
SIPOC Model PowerPoint Presentation SlidesSlideTeam
This complete deck covers various topics and highlights important concepts. It has PPT slides which cater to your business needs. This complete deck presentation emphasizes Sipoc Model Powerpoint Presentation Slides and has templates with professional background images and relevant content. This deck consists of total of seventeen slides. Our designers have created customizable templates, keeping your convenience in mind. You can edit the colour, text and font size with ease. Not just this, you can also add or delete the content if needed. Get access to this fully editable complete presentation by clicking the download button below. http://bit.ly/2Orhs0v
Input Process Output PowerPoint Presentation Slides SlideTeam
Display your business model with our input process output PowerPoint template. Our designing team has crafted this overwhelming presentation design for you. To accomplish what you desire can only be possible if you have planned it in the right way. Managers always find it difficult to maintain the balance in their life. Our input process output Presentation deck enables you to focus on your daily activities in a chronological manner by following an input process output cycle. Inputs are the resources invested in accomplishing a task including time, money, and effort. Process refers to what is done in order to accomplish a task. The output is the accomplishment of the task itself. You can use the slide show to highlight your work order processes and what time you need to work on the other aspects. So, download this presentation graphic slide to achieve the best results and then share it with your audience. Ensure that coins continue to flow in with our Input Process Output PowerPoint Presentation Slides. You will always hear a jingle.
Keep your audience glued to their seats with professionally designed PPT slides. This deck comprises of total of seventeen slides. It has PPT templates with creative visuals and well researched content. Not just this, our PowerPoint professionals have crafted this deck with appropriate diagrams, layouts, icons, graphs, charts and more. This content ready presentation deck is fully editable. Just click the DOWNLOAD button below. Change the colour, text and font size. You can also modify the content as per your need. Get access to this well crafted complete deck presentation and leave your audience stunned. http://bit.ly/376LEEp
A business plan is a comprehensive document that outlines the goals, strategies, and financial projections for a business. It serves as a roadmap for the company's operations and provides guidance for decision-making and attracting investors. Here are the key components typically included in a business plan:
Executive Summary: This section provides an overview of the business, including its mission, vision, and key highlights. It should be concise, engaging, and capture the reader's attention.
Company Description: Describe the nature of your business, its legal structure, products or services offered, target market, and competitive advantages. Explain the problem or need your business addresses and how your solution is unique.
Market Analysis: Conduct thorough market research to understand your target market, industry trends, customer demographics, and competitors. Analyze market size, growth potential, and any barriers to entry. Identify your target customers and their buying behaviors.
Organization and Management: Outline the organizational structure of your business, including key team members, their roles, and relevant experience. Highlight their strengths and how they contribute to the success of the business.
Product or Service Line: Provide detailed information about your products or services, including features, benefits, pricing, and intellectual property. Explain how your offerings fulfill customer needs and differentiate from competitors.
Marketing and Sales Strategy: Describe your marketing and sales approach, including channels you will use to reach your target customers, marketing campaigns, pricing strategy, and distribution methods. Include a sales forecast and customer acquisition plan.
Financial Projections: Present financial projections, including income statements, balance sheets, and cash flow statements. Include details such as revenue projections, anticipated expenses, break-even analysis, and return on investment. Provide realistic assumptions and highlight key financial indicators.
Funding Request: If seeking funding, clearly state the amount of funding required, how it will be used, and the potential return on investment for investors. Describe your funding strategy, whether it's through equity investment, loans, or grants.
Implementation Plan: Outline the steps and timeline for launching and operating your business. Identify key milestones, deliverables, and responsibilities. Include operational details such as location, facilities, production processes, and technology requirements.
Risk Analysis: Identify potential risks and challenges that could impact your business and explain how you plan to mitigate them. This includes legal, financial, operational, and market risks. Show that you have considered various scenarios and have contingency plans in place.
Conclusion: Summarize the key points of your business plan and reiterate the value proposition of your business. Convey confidence in the viability and grow
Certainly! Here's an overview of the pros and cons of using infographics:
Pros of Infographics:
Visual Appeal: Infographics are visually engaging and can quickly grab the attention of viewers. They use colors, icons, illustrations, and typography to present information in an aesthetically pleasing manner.
Simplifies Complex Information: Infographics are effective at simplifying complex data or concepts. They can condense large amounts of information into easily understandable and digestible visuals, making it easier for viewers to grasp the main points.
Enhances Retention and Comprehension: Visual elements in infographics help enhance information retention and comprehension. By combining text with visuals, infographics engage both the visual and verbal parts of the brain, making it easier for viewers to remember and understand the content.
Increases Information Sharing: Infographics are highly shareable on social media platforms, blogs, websites, and presentations. Their visual appeal makes them more likely to be shared, increasing the reach and visibility of the information or message being conveyed.
Grabs Attention in a Time-Efficient Manner: In today's fast-paced world, infographics can quickly convey key information within seconds or a few glances. They are ideal for capturing the attention of busy viewers who may be scanning through content.
Cons of Infographics:
Simplification Can Lead to Oversimplification: While infographics excel at simplifying complex information, there is a risk of oversimplification. Important nuances and details may be left out in favor of brevity, potentially leading to a loss of accuracy or depth.
Design Challenges: Creating visually appealing and effective infographics requires design skills or access to design tools. Without the necessary design expertise, infographics may not be as impactful or well-executed.
Limited Amount of Information: Due to their visual nature, infographics have limited space to convey information. They are best suited for presenting high-level or summary data, rather than detailed or comprehensive information.
Dependency on Visual Appeal: Infographics heavily rely on visual elements to communicate information. If the visuals are not well-designed or fail to engage viewers, the effectiveness of the infographic may be diminished.
Potential Misinterpretation: Misinterpretation can occur if the information presented in the infographic is not clear, accurate, or properly labeled. Viewers may draw incorrect conclusions or misunderstand the data if it is not presented with clarity and accuracy.
Overall, infographics are a powerful tool for presenting information in a visually appealing and easily understandable format. While they have numerous benefits, it's important to carefully design and present the information to ensure accuracy, clarity, and effectiveness.
Motivation refers to the internal or external factors that drive and energize individuals to take action, set goals, and persist in achieving them. It plays a crucial role in personal and professional growth, productivity, and overall well-being. Here are some key aspects of motivation:
Intrinsic and Extrinsic Motivation: Motivation can be categorized into two types: intrinsic and extrinsic. Intrinsic motivation comes from within and is driven by personal satisfaction, enjoyment, or a sense of fulfillment. Extrinsic motivation, on the other hand, comes from external rewards or incentives such as recognition, money, or praise.
Needs and Goals: Motivation often arises from needs and goals. Maslow's Hierarchy of Needs suggests that individuals are motivated by a progression of needs, starting from basic physiological needs (e.g., food, shelter) to higher-level needs such as belongingness, self-esteem, and self-actualization. Setting clear and meaningful goals that align with these needs can provide direction and drive motivation.
Self-Determination Theory: Self-Determination Theory proposes that intrinsic motivation is fostered by three psychological needs: autonomy, competence, and relatedness. Autonomy refers to the need for control and choice in one's actions, competence is the need to feel capable and effective, and relatedness is the need for social connections and belongingness.
Goal Setting: Setting specific, challenging, and achievable goals is a powerful motivator. Goals provide a clear target, create a sense of purpose, and help individuals track their progress. Implementing strategies like SMART (Specific, Measurable, Achievable, Relevant, Time-bound) goals can enhance motivation and increase the likelihood of success.
Positive Reinforcement: Positive reinforcement involves providing rewards, recognition, or praise for desired behaviors or achievements. It can enhance motivation by reinforcing positive actions and outcomes, making individuals more likely to continue those behaviors.
Growth Mindset: Adopting a growth mindset, as proposed by psychologist Carol Dweck, can enhance motivation. A growth mindset is the belief that abilities and intelligence can be developed through effort, learning, and perseverance. It encourages embracing challenges, seeing failures as learning opportunities, and persisting in the face of setbacks.
Self-Efficacy: Self-efficacy refers to an individual's belief in their ability to succeed in specific tasks or situations. When individuals have a high level of self-efficacy, they are more motivated to take on challenges, exert effort, and persevere, leading to increased performance and achievement.
Environment and Support: The environment and social support play a significant role in motivation. Creating a supportive and positive environment, fostering collaboration and teamwork, providing feedback and constructive criticism, and offering resources and opportunities for growth can enhance motivation and en
Certainly! Here's an overview of the pros and cons of using infographics:
Pros of Infographics:
Visual Appeal: Infographics are visually engaging and can quickly grab the attention of viewers. They use colors, icons, illustrations, and typography to present information in an aesthetically pleasing manner.
Simplifies Complex Information: Infographics are effective at simplifying complex data or concepts. They can condense large amounts of information into easily understandable and digestible visuals, making it easier for viewers to grasp the main points.
Enhances Retention and Comprehension: Visual elements in infographics help enhance information retention and comprehension. By combining text with visuals, infographics engage both the visual and verbal parts of the brain, making it easier for viewers to remember and understand the content.
Increases Information Sharing: Infographics are highly shareable on social media platforms, blogs, websites, and presentations. Their visual appeal makes them more likely to be shared, increasing the reach and visibility of the information or message being conveyed.
Grabs Attention in a Time-Efficient Manner: In today's fast-paced world, infographics can quickly convey key information within seconds or a few glances. They are ideal for capturing the attention of busy viewers who may be scanning through content.
Cons of Infographics:
Simplification Can Lead to Oversimplification: While infographics excel at simplifying complex information, there is a risk of oversimplification. Important nuances and details may be left out in favor of brevity, potentially leading to a loss of accuracy or depth.
Design Challenges: Creating visually appealing and effective infographics requires design skills or access to design tools. Without the necessary design expertise, infographics may not be as impactful or well-executed.
Limited Amount of Information: Due to their visual nature, infographics have limited space to convey information. They are best suited for presenting high-level or summary data, rather than detailed or comprehensive information.
Dependency on Visual Appeal: Infographics heavily rely on visual elements to communicate information. If the visuals are not well-designed or fail to engage viewers, the effectiveness of the infographic may be diminished.
Potential Misinterpretation: Misinterpretation can occur if the information presented in the infographic is not clear, accurate, or properly labeled. Viewers may draw incorrect conclusions or misunderstand the data if it is not presented with clarity and accuracy.
Buy Verified PayPal Account | Buy Google 5 Star Reviewsusawebmarket
Buy Verified PayPal Account
Looking to buy verified PayPal accounts? Discover 7 expert tips for safely purchasing a verified PayPal account in 2024. Ensure security and reliability for your transactions.
PayPal Services Features-
🟢 Email Access
🟢 Bank Added
🟢 Card Verified
🟢 Full SSN Provided
🟢 Phone Number Access
🟢 Driving License Copy
🟢 Fasted Delivery
Client Satisfaction is Our First priority. Our services is very appropriate to buy. We assume that the first-rate way to purchase our offerings is to order on the website. If you have any worry in our cooperation usually You can order us on Skype or Telegram.
24/7 Hours Reply/Please Contact
usawebmarketEmail: support@usawebmarket.com
Skype: usawebmarket
Telegram: @usawebmarket
WhatsApp: +1(218) 203-5951
USA WEB MARKET is the Best Verified PayPal, Payoneer, Cash App, Skrill, Neteller, Stripe Account and SEO, SMM Service provider.100%Satisfection granted.100% replacement Granted.
Personal Brand Statement:
As an Army veteran dedicated to lifelong learning, I bring a disciplined, strategic mindset to my pursuits. I am constantly expanding my knowledge to innovate and lead effectively. My journey is driven by a commitment to excellence, and to make a meaningful impact in the world.
Premium MEAN Stack Development Solutions for Modern BusinessesSynapseIndia
Stay ahead of the curve with our premium MEAN Stack Development Solutions. Our expert developers utilize MongoDB, Express.js, AngularJS, and Node.js to create modern and responsive web applications. Trust us for cutting-edge solutions that drive your business growth and success.
Know more: https://www.synapseindia.com/technology/mean-stack-development-company.html
Putting the SPARK into Virtual Training.pptxCynthia Clay
This 60-minute webinar, sponsored by Adobe, was delivered for the Training Mag Network. It explored the five elements of SPARK: Storytelling, Purpose, Action, Relationships, and Kudos. Knowing how to tell a well-structured story is key to building long-term memory. Stating a clear purpose that doesn't take away from the discovery learning process is critical. Ensuring that people move from theory to practical application is imperative. Creating strong social learning is the key to commitment and engagement. Validating and affirming participants' comments is the way to create a positive learning environment.
VAT Registration Outlined In UAE: Benefits and Requirementsuae taxgpt
Vat Registration is a legal obligation for businesses meeting the threshold requirement, helping companies avoid fines and ramifications. Contact now!
https://viralsocialtrends.com/vat-registration-outlined-in-uae/
Top mailing list providers in the USA.pptxJeremyPeirce1
Discover the top mailing list providers in the USA, offering targeted lists, segmentation, and analytics to optimize your marketing campaigns and drive engagement.
Recruiting in the Digital Age: A Social Media MasterclassLuanWise
In this masterclass, presented at the Global HR Summit on 5th June 2024, Luan Wise explored the essential features of social media platforms that support talent acquisition, including LinkedIn, Facebook, Instagram, X (formerly Twitter) and TikTok.
B2B payments are rapidly changing. Find out the 5 key questions you need to be asking yourself to be sure you are mastering B2B payments today. Learn more at www.BlueSnap.com.
Company Valuation webinar series - Tuesday, 4 June 2024FelixPerez547899
This session provided an update as to the latest valuation data in the UK and then delved into a discussion on the upcoming election and the impacts on valuation. We finished, as always with a Q&A
Authentically Social by Corey Perlman - EO Puerto Rico
3C4753E6.pptx
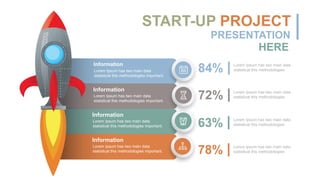
1. Lorem Ipsum has two main data
statistical this methodologies important.
Information
Lorem Ipsum has two main data
statistical this methodologies important.
Information
Lorem Ipsum has two main data
statistical this methodologies important.
Information
Lorem Ipsum has two main data
statistical this methodologies important.
Information
84% Lorem Ipsum has two main data
statistical this methodologies
72% Lorem Ipsum has two main data
statistical this methodologies
63% Lorem Ipsum has two main data
statistical this methodologies
78% Lorem Ipsum has two main data
statistical this methodologies
START-UP PROJECT
PRESENTATION
HERE
2. Lorem Ipsum has two main data
statistical this methodologies. A
Lorem Ipsum has two main data
statistical this methodologies. C
Lorem Ipsum has two main data
statistical this methodologies.
B
Lorem Ipsum has two main data
statistical this methodologies.
D
Lorem Ipsum has two main data
statistical this methodologies. E
Lorem Ipsum has two main data
statistical this methodologies.
F
Your great subtitle in this line
START-UP
PRESENT
Lorem Ipsum has two main data statistical this
methodologies important Data analysis which
summarizes.
DESCRIPTION HERE
3. Your great subtitle in this line
START-UP
PRESENT
68% Lorem Ipsum has two main data statistical this methodologies
important Data analysis which summarizes.
63%
Lorem Ipsum has two main data statistical this methodologies
important Data analysis which summarizes.
78%
Lorem Ipsum has two main data statistical this methodologies
important Data analysis which summarizes.
94%
Lorem Ipsum has two main data statistical this methodologies
important Data analysis which summarizes.
Lorem Ipsum has two main data statistical this methodologies important Data analysis which
summarizes.
DESCRIPTION HERE
4. Your great subtitle in this line
START-UP
PRESENT
Option 1
Lorem Ipsum has two main data
statistical this methodologies.
Option 2
Lorem Ipsum has two main data
statistical this methodologies.
Option 3
Lorem Ipsum has two main data
statistical this methodologies.
Option 4
Lorem Ipsum has two main data
statistical this methodologies.
5. Your great subtitle in this line
START-UP
PRESENT
Lorem Ipsum has two main data statistical
this methodologies important.
Information
Lorem Ipsum has two main data statistical
this methodologies important.
Information
Lorem Ipsum has two main data statistical
this methodologies important.
Information
Lorem Ipsum has two main data statistical
this methodologies important.
Information
Lorem Ipsum has two main data statistical this methodologies important Data
analysis which summarizes.
Description Here
6. Your great subtitle in this line
START-UP
PRESENT
Lorem
Ipsum
has
two
main
data
statistical
this
methodologies
important
Data
analysis.
DESCRIPTION
HERE
Lorem
Ipsum
has
two
main
data
statistical
this
methodologies
important
Data
analysis.
DESCRIPTION
HERE
Lorem
Ipsum
has
two
main
data
statistical
this
methodologies
important
Data
analysis.
DESCRIPTION
HERE
Lorem
Ipsum
has
two
main
data
statistical
this
methodologies
important
Data
analysis.
DESCRIPTION
HERE
7. Your great subtitle in this line
START-UP
PRESENT
Lorem Ipsum has two main data statistical this methodologies
important Data analysis which summarizes. A
Lorem Ipsum has two main data statistical this methodologies
important Data analysis which summarizes. B
Lorem Ipsum has two main data statistical this
methodologies important Data analysis. C
Lorem Ipsum has two main data
statistical this methodologies. D
Lorem Ipsum has two main data statistical this
methodologies important Data analysis which
summarizes.
Description Here
Lorem Ipsum has two
main data statistical
Lorem Ipsum has two
main data statistical
Lorem Ipsum has two
main data statistical
Lorem Ipsum has two
main data statistical
TOTAL 75%
Lorem Ipsum has two main data statistical this
methodologies important Data analysis which
summarizes.
8. Your great subtitle in this line
START-UP
PRESENT
Lorem Ipsum has two main data
statistical this methodologies
important Data analysis which
summarizes.
DESCRIPTION HERE
87%
Lorem Ipsum has two main data
statistical this methodologies
important Data analysis which
summarizes.
DESCRIPTION HERE
43%
Lorem Ipsum has two main data
statistical this methodologies
important Data analysis which
summarizes.
DESCRIPTION HERE
92%
Lorem Ipsum has two main data
statistical this methodologies
important Data analysis which
summarizes.
DESCRIPTION HERE
71%
9. Lorem Ipsum has two main data statistical this methodologies
important Data analysis which summarizes.
DESCRIPTION HERE
Lorem Ipsum has two main data statistical this methodologies
important Data analysis which summarizes.
DESCRIPTION HERE
Lorem Ipsum has two main data statistical this methodologies
important Data analysis which summarizes.
DESCRIPTION HERE
73%
62%
78%
Your great subtitle in this line
START-UP
PRESENT
INVESTOR : 75%
Lorem Ipsum has two main data statistical
this methodologies important Data analysis
which summarizes.
10. Your great subtitle in this line
START-UP
PRESENT
PROCESS
75%
Lorem Ipsum has
two main data
STRATEGY
37%
Lorem Ipsum has
two main data
PLANNING
78%
Lorem Ipsum has
two main data
SUCCESS
89%
Lorem Ipsum has
two main data
Lorem Ipsum has two main
data statistical
Lorem Ipsum has two main
data statistical
Lorem Ipsum has two main
data statistical
Lorem Ipsum has two main
data statistical
11. Your great subtitle in this line
START-UP
PRESENT
Event
Lorem Ipsum has two main data
statistical important.
Global
Lorem Ipsum has two main data
statistical important.
Database
Lorem Ipsum has two main data
statistical important.
Research
Lorem Ipsum has two main data
statistical important.
Lorem Ipsum has two main data statistical this
methodologies important Data analysis which
summarizes.
BRAINSTORM
12. Your great subtitle in this line
START-UP
PRESENT
Lorem Ipsum has two main
data statistical important.
Lorem Ipsum has two main
data statistical important.
45%
75%
Lorem Ipsum has two main
data statistical important.
Lorem Ipsum has two main
data statistical important.
62%
43%
Lorem Ipsum has two
main data statistical
Lorem Ipsum has two
main data statistical
Lorem Ipsum has two
main data statistical
Lorem Ipsum has two
main data statistical
13. Lorem Ipsum has two main data statistical this
methodologies important Data analysis which
summarizes.
DESCRIPTION HERE
Lorem Ipsum has two main data statistical this
methodologies important Data analysis which
summarizes.
DESCRIPTION HERE
Lorem Ipsum has two
main data statistical
this methodologies.
Description
87%
Lorem Ipsum has two
main data statistical
Lorem Ipsum has two
main data statistical
Your great subtitle in this line
START-UP
PRESENT
14. Lorem Ipsum has two main data statistical this
methodologies important Data analysis which
summarizes.
DESCRIPTION HERE
Lorem Ipsum has two main data statistical this
methodologies important Data analysis which
summarizes.
DESCRIPTION HERE
Lorem Ipsum has two
main data statistical
this methodologies.
Description
52%
Lorem Ipsum has two
main data statistical
Lorem Ipsum has two
main data statistical
Your great subtitle in this line
START-UP
PRESENT
15. Your great subtitle in this line
START-UP
PRESENT
Lorem ipsum dolor sit amet, consectetur adipiscing elit. Ut efficitur ipsum vitae tortor accumsan, a pulvinar lorem lacinia. Donec eu arcu justo.
Fusce eget consequat risus Proin est lacus, interdum vitae feugiat quis, faucibus vel mi. Vivamus accumsan nisi vel nulla viverra semper.
Lorem ipsum dolor sit amet, consectetur adipiscing elit. Ut efficitur ipsum vitae tortor accumsan, a pulvinar lorem lacinia.
Lorem Ipsum has two main data
statistical this methodologies
important Data analysis which
summarizes.
Lorem Ipsum has two main
data statistical this
methodologies important Data
analysis which summarizes.
Lorem Ipsum has two main data
statistical this methodologies
important Data analysis which
summarizes.
16. Your great subtitle in this line
START-UP
PRESENT
Lorem Ipsum has two main
data statistical this
methodologies important.
Information
Lorem Ipsum has two main
data statistical this
methodologies important.
Information
Lorem Ipsum has two main
data statistical this
methodologies important.
Information
Lorem Ipsum has two main
data statistical this
methodologies important.
Information
Lorem Ipsum has two
main data statistical
Lorem Ipsum has two
main data statistical
Lorem Ipsum has two
main data statistical
Lorem Ipsum has two
main data statistical
Lorem ipsum dolor sit amet, consectetur adipiscing elit. Ut
efficitur ipsum vitae tortor accumsan, a pulvinar lorem
lacinia. Donec eu arcu justo. Fusce eget consequat risus
Proin est lacus, interdum vitae feugiat quis, faucibus vel
mi. Vivamus accumsan
BUSINESSMAN HERE
Lorem ipsum dolor sit amet, consectetur adipiscing elit. Ut
efficitur ipsum vitae tortor accumsan, a pulvinar lorem
lacinia. Donec eu arcu justo. Fusce eget consequat risus
Proin est lacus,
Lorem ipsum dolor sit amet, consectetur adipiscing elit. Ut
efficitur ipsum vitae tortor accumsan, a pulvinar lorem
lacinia. Donec eu arcu justo. Fusce eget consequat risus
Proin est lacus, interdum vitae feugiat quis, faucibus vel
mi. Vivamus accumsan
17. Your great subtitle in this line
START-UP
PRESENT
Lorem ipsum dolor sit amet, consectetur adipiscing elit. Ut efficitur
ipsum vitae tortor accumsan, a pulvinar lorem lacinia. Donec eu arcu
justo. Fusce eget consequat risus Proin est lacus, interdum vitae
feugiat quis, faucibus vel mi. Vivamus accumsan
SUCCESSULL
Step 1
Lorem Ipsum has two main data
statistical this methodologies
important Data analysis which
summarizes.
Step 2
Lorem Ipsum has two main data
statistical this methodologies
important Data analysis which
summarizes.
Step 3
Lorem Ipsum has two main
data statistical this
methodologies important Data
analysis which summarizes.
Step 4
Lorem Ipsum has two
main data statistical this
methodologies important
Data analysis which
summarizes.
18. Your great subtitle in this line
START-UP
PRESENT
Lorem Ipsum has two
main data statistical this
methodologies
summarizes.
Feature Name
Lorem Ipsum has two
main data statistical this
methodologies
summarizes.
Lorem Ipsum has two
main data statistical this
methodologies
summarizes.
Feature Name
Lorem Ipsum has two
main data statistical this
methodologies
summarizes.
DATA 01
74%
Lorem ipsum dolor sit amet,
consectetur adipiscing elit.
Aliquam tincidunt.
DATA 02
82%
Lorem ipsum dolor sit amet,
consectetur adipiscing elit.
Aliquam tincidunt.
Lorem Ipsum has two main data
statistical this methodologies
important Data analysis which
summarizes.
FINANCIAL
19. Your great subtitle in this line
START-UP
PRESENT
Lorem ipsum dolor sit amet, consectetur adipiscing elit. Ut efficitur ipsum vitae tortor accumsan, a pulvinar lorem
lacinia. Donec eu arcu justo. Fusce eget consequat risus Proin est lacus, interdum vitae feugiat quis, faucibus vel
mi. Vivamus accumsan
PRODUCT MANAGEMENT
Lorem ipsum dolor sit amet, consectetur adipiscing elit. Ut
efficitur ipsum vitae tortor accumsan, a pulvinar lorem
lacinia. Donec eu arcu justo. Fusce eget consequat risus
Proin est lacus,
Lorem ipsum dolor sit amet, consectetur adipiscing elit. Ut
efficitur ipsum vitae tortor accumsan, a pulvinar lorem
lacinia. Donec eu arcu justo. Fusce eget consequat risus
Proin est lacus, interdum vitae feugiat quis, faucibus vel
mi. Vivamus accumsan
Lorem Ipsum has two
main data statistical
Lorem Ipsum has two
main data statistical
Lorem Ipsum has two
main data statistical
Lorem Ipsum has two
main data statistical
20. Your great subtitle in this line
START-UP
PRESENT
Lorem Ipsum has two
main data statistical
important.
Lorem Ipsum has two
main data statistical
important.
Lorem Ipsum has two
main data statistical
important.
Lorem Ipsum has two
main data statistical
important.
Advertise
Lorem Ipsum has two main
data statistical important.
Time
Lorem Ipsum has two main
data statistical important.
Security
Lorem Ipsum has two main
data statistical important.
Research
Lorem Ipsum has two main
data statistical important.
21. Your great subtitle in this line
START-UP
PRESENT
76%
Lorem Ipsum has two
main data statistical
43%
Lorem Ipsum has two
main data statistical
Lorem Ipsum has two main data statistical
this methodologies.
Data Here A
Lorem Ipsum has two main data statistical
this methodologies.
Data Here B
Lorem Ipsum has two
main data statistical
Lorem Ipsum has two
main data statistical
Lorem Ipsum has two
main data statistical
Lorem Ipsum has two
main data statistical
22. Your great subtitle in this line
START-UP
PRESENT
59%
78%
39%
74%
Lorem Ipsum has two main data
methodologies .
DESCRIPTION HERE
Lorem Ipsum has two main data
methodologies .
DESCRIPTION HERE
Lorem Ipsum has two main data
methodologies .
DESCRIPTION HERE
Lorem Ipsum has two main data
methodologies .
DESCRIPTION HERE
Lorem Ipsum has
two main data
statistical
Lorem Ipsum has
two main data
statistical
Lorem Ipsum has
two main data
statistical
Lorem Ipsum has
two main data
statistical
23. Your great subtitle in this line
START-UP
PRESENT
Lorem Ipsum has two main data statistical this methodologies important Data analysis which summarizes. Lorem Ipsum has two main data statistical this
methodologies important Data analysis which summarizes.
SUBMIT LOAN
Lorem Ipsum has two main data statistical
this methodologies important Data
analysis which summarizes.
Lorem Ipsum has two main data statistical
this methodologies important Data
analysis which summarizes.
Lorem Ipsum has two main data statistical
this methodologies important Data
analysis which summarizes.
Lorem Ipsum has two main data statistical
this methodologies important Data
analysis which summarizes.
24. Your great subtitle in this line
START-UP
PRESENT
Lorem Ipsum has
two main data
statistical this
methodologies
Data Here
Lorem Ipsum has
two main data
statistical this
methodologies
Data Here
Lorem Ipsum has
two main data
statistical this
methodologies
Data Here
Lorem Ipsum has
two main data
statistical this
methodologies
Data Here
TAKE PARTNER
70%
25. Your great subtitle in this line
START-UP
PRESENT
Lorem Ipsum has two
main data statistical
important.
Lorem Ipsum has two
main data statistical
important.
Lorem Ipsum has two
main data statistical
important.
Lorem Ipsum has two
main data statistical
important.
TARGETING
78%
ADVERTISE
54%
TARGETING
87%
ADVERTISE
69%
26. Your great subtitle in this line
START-UP
PRESENT
Lorem ipsum dolor sit amet, consectetur adipiscing elit. Ut efficitur ipsum vitae tortor accumsan, a pulvinar lorem lacinia. Donec eu arcu justo.
Fusce eget consequat risus Proin est lacus, interdum vitae feugiat quis, faucibus vel mi. Vivamus accumsan nisi vel nulla viverra semper.
Lorem ipsum dolor sit amet, consectetur adipiscing elit. Ut efficitur ipsum vitae tortor accumsan, a pulvinar lorem lacinia.
Lorem Ipsum has two main data statistical this methodologies important Data
analysis which summarizes.
EXPANDIN G BRANCHES
Lorem Ipsum has two main
data statistical
Lorem Ipsum has two main
data statistical
Lorem Ipsum has two main
data statistical
Lorem Ipsum has two main
data statistical
DATA 89%
Lorem Ipsum has two main
data statistical this
methodologies important
Data analysis which
summarizes.
DESCRIPTION HERE
27. Your great subtitle in this line
START-UP
PRESENT
Lorem Ipsum has two
main data statistical
Lorem Ipsum has two
main data statistical
Lorem Ipsum has two
main data statistical
Lorem Ipsum has two
main data statistical
Lorem Ipsum has two
main data statistical this
methodologies important
Data analysis which
summarizes.
Lorem Ipsum has two
main data statistical this
methodologies important
Data analysis which
summarizes.
Lorem Ipsum has two
main data statistical this
methodologies important
Data analysis which
summarizes.
DATA 75%
Lorem Ipsum has two main data
statistical this methodologies important
Data analysis which summarizes.
DESCRIPTION HERE
Lorem Ipsum has two main data statistical this
methodologies important Data analysis which
summarizes.
DESCRIPTION HERE
28. Lorem Ipsum has two
main data statistical this
methodologies important
Data analysis which
summarizes.
Lorem Ipsum has two
main data statistical this
methodologies important
Data analysis which
summarizes.
Lorem Ipsum has two
main data statistical this
methodologies important
Data analysis which
summarizes.
INFOGRAPHICS
Your great subtitle in this line
Lorem ipsum dolor sit amet, consectetur adipiscing elit. Ut efficitur ipsum vitae tortor
accumsan, a pulvinar lorem lacinia. Donec eu arcu justo. Fusce eget consequat risus Proin
est lacus, interdum vitae feugiat quis, faucibus vel mi. Vivamus accumsan
DESCRIPTION HERE
Lorem Ipsum has two
main data statistical this
methodologies
summarizes.
Feature Name
Lorem Ipsum has two
main data statistical this
methodologies
summarizes.
Lorem Ipsum has two
main data statistical this
methodologies
summarizes.
Feature Name
Lorem Ipsum has two
main data statistical this
methodologies
summarizes.
Lorem Ipsum has two
main data statistical this
methodologies
summarizes.
Feature Name
Lorem Ipsum has two
main data statistical this
methodologies
summarizes.