QNBFS Daily Technical Trader - Qatar for December 20, 2017 Inbox x QNB Group
The Index added another 3.79% to its recent gains (11.21% since November’s low); the Index reached the upper side of the down trend channel. In addition, it will test the resistance stemming from the 100 daily SMA. As a result, we may see the Index correcting around here.
QNBFS Daily Technical Trader - Qatar June 06, 2016QNB Group
The Index created a bullish Hammer
candlestick after a longer down
movement. That candlestick indicates a
possible change in participants’
psychology to a bullish one, at least on
the short term. But for that to occur, the
Index needs to break and stay above the
9,600 level with higher volumes.
QNBFS Daily Technical Trader - Qatar August 16, 2016QNB Group
The Index has been moving up for the
past 8 weeks and could continue further
because the trend remains up. The risk we
are facing is the overbought status seen
on the RSI on both charts. The
possibilities are becoming higher for a
correction
QNBFS Daily Technical Trader - Qatar June 02, 2016QNB Group
The Index inched up in the previous
session, but remains in a downtrend. That
been said, the Index reached the lower
border of the downtrend channel. As a
result, a relief rally may transpire, but
against the main direction of the Index
QNBFS Daily Technical Trader - Qatar March 01, 2017QNB Group
The Index closed sharply down as selling
pressure increased at the end of the last
session. The Index is now testing the
50SMA (as seen on the daily chart) that
may act as a support level. Otherwise, the
Index could be heading down to the
10,500 level.
QNBFS Daily Technical Trader - Qatar May 29, 2017QNB Group
The Index remains flat as seen on the daily chart; the moving averages are flat and the RSI is also neutral. On the Intraday chart, we see the Index trying to breakout above the downtrend channel.
QNBFS Daily Market Report December 24, 2023QNB Group
The QE Index rose 0.8% to close at 10,285.3. Gains were led by the Transportation and Banks & Financial Services indices, gaining 1.4% and 1.2%, respectively.
QNBFS Daily Market Report October 04, 2023QNB Group
The QE Index rose 0.2% to close at 10,273.3. Gains were led by the Transportation and Consumer Goods & Services indices, gaining 1.7% and 0.1%, respectively.
QNBFS Daily Technical Trader Qatar - October 04, 2023 التحليل الفني اليومي لب...QNB Group
The General Index failed to sustain its breakout above the double-bottom formation’s neckline and continued with its decline into the formation’s territory.
QNBFS Daily Technical Trader Qatar - September 28, 2023 التحليل الفني اليومي ...QNB Group
The General Index failed to sustain its breakout above the double-bottom formation’s neckline and continued with its decline into the formation’s territory.
QNBFS Daily Market Report September 24, 2023QNB Group
The QE Index rose 0.3% to close at 10,323.0. Gains were led by the Transportation and Industrials indices, gaining 0.8% each. Top gainers were Qatar Navigation and Al Khaleej Takaful Insurance Co., rising 3.3% and 2.0%, respectively.
QNBFS Daily Technical Trader Qatar - September 24, 2023 التحليل الفني اليومي ...QNB Group
The General Index failed to sustain its breakout above the double-bottom formation’s neckline and continued with its decline into the formation’s territory.
QNBFS Daily Technical Trader Qatar - September 19, 2023 التحليل الفني اليومي ...QNB Group
The General Index failed to sustain its breakout above the double-bottom formation’s neckline and continued with its decline into the formation’s territory.
QNBFS Daily Market Report September 17, 2023QNB Group
The QE Index declined 0.5% to close at 10,319.3. Losses were led by the Industrials and Consumer Goods & Services indices, falling 1.4% and 1.1%, respectively.
QNBFS Daily Technical Trader Qatar - September 07, 2023 التحليل الفني اليومي ...QNB Group
The General Index failed to
sustain its breakout above the
double-bottom formation’s
neckline and continued with
its decline into the
formation’s territory.
QNBFS Daily Technical Trader Qatar - September 07, 2023 التحليل الفني اليومي ...
3 February Daily technical trader
1. COPYRIGHT: No part of this document may be reproduced without the explicit written permission of QNBFS Page 1 of 6
Daily Technical Trader – Qatar
Tuesday, 03 February 2015
Stocks Covered Today
Ticker Price Target
BRES* 45.80 48.00
QGTS 23.90 24.23
* Medium-term
QSE Index
Level % Ch. Vol. (mn)
Last 12,117.70 0.5 7.2
Resistance/Support
Levels 1
st
2
nd
3
rd
Resistance 12,250 12,350 12,600
Support 12,000 11,850 11,750
QSE Index Commentary
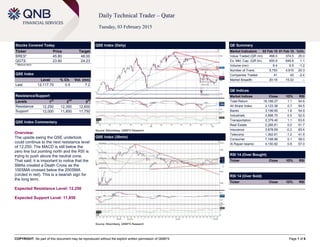
Overview:
The upside swing the QSE undertook
could continue to the next resistance level
of 12,250. The MACD is still below the
zero line but pointing north and the RSI is
trying to push above the neutral zone.
That said; it is important to notice that the
SMAs created a Death Cross as the
100SMA crossed below the 200SMA
(circled in red). This is a bearish sign for
the long term.
Expected Resistance Level: 12,250
Expected Support Level: 11,850
QSE Index (Daily)
Source: Bloomberg, QNBFS Research
QE Summary
Market Indicators 02 Feb 15 01 Feb 15 %Ch.
Value Traded (QR mn) 468.0 374.5 25.0
Ex. Mkt. Cap. (QR bn) 655.9 648.8 1.1
Volume (mn) 8.4 8.5 -1.2
Number of Trans. 5,793 4,815 20.3
Companies Traded 41 42 -2.4
Market Breadth 20:19 15:22 –
QE Indices
Market Indices Close 1D% RSI
Total Return 18,188.27 1.1 54.6
All Share Index 3,123.38 0.7 54.5
Banks 3,199.95 1.6 54.9
Industrials 3,898.75 0.5 52.5
Transportation 2,379.40 1.1 63.6
Real Estate 2,285.61 0.0 51.7
Insurance 3,878.69 -0.2 60.4
Telecoms 1,362.81 -1.2 41.5
Consumer 7,168.96 0.1 58.0
Al Rayan Islamic 4,150.82 0.8 57.0
RSI 14 (Over Bought)
Ticker Close 1D% RSI
RSI 14 (Over Sold)
Ticker Close 1D% RSI
QSE Index (30min)
Source: Bloomberg, QNBFS Research
2. COPYRIGHT: No part of this document may be reproduced without the explicit written permission of QNBFS Page 2 of 6
BRES (Medium-term)
Price % Ch. Volume
Last 45.80 1.78 865,839
Resistance/Support
Levels (QR) 1
st
2
nd
3
rd
Resistance 46.00 48.00 50.00
Support 42.00 38.50 35.00
Commentary
Overview:
The name is trading at price range
between QR42.00 and QR46.00. A
sustained break above QR46.00 could
propel the stock to QR48.00 and possibly
beyond. A break above QR46.00 is
essential because the price at that point
could penetrate the top border of the
triangle created by the price. Technical
Indicators favor that idea. Over the
medium-term, charts show the MACD
above the zero line and pointing north.
The RSI is also departing from the neutral
zone. Moreover, The same patterns are
exhibited on the weekly and the daily
charts.
Expected Target Price: QR48.00 –
QR50.00
A sustained break over the QR46.00 is
needed to trigger the buy
recommendation.
Suggested Stop-Loss Price: QR44.0
A breach below the level means the drop
could continue to the lower part of the
triangle.
(Weekly)
Source: Bloomberg, QNBFS Research
(Daily)
Source: Bloomberg, QNBFS Research
3. COPYRIGHT: No part of this document may be reproduced without the explicit written permission of QNBFS Page 3 of 6
QGTS
Price % Ch. Volume
Last 23.90 1.27 181,792
Resistance/Support
Levels (QR) 1
st
2
nd
3
rd
Resistance 24.23 24.80 25.00
Support 23.40 23.15 22.00
Commentary
Overview:
The name just broke above an ascending
triangle and closed above its moving
average which is a positive sign in the
short-term. In addition, the MACD is
pointing up and above the zero line in both
time frames. The RSI is also pointing up
on both time frames and has not reached
the overbought area yet. Thus, we
conclude that this move could continue
further on the back of the expected
continuation of the bullish momentum.
Expected Target Price: QR24.23 –
QR24.80
A break above QR23.90 is needed for the
momentum to continue upwards.
Suggested Stop-Loss Price: QR23.40
(Daily)
Source: Bloomberg, QNBFS Research
(Hourly)
Source: Bloomberg, QNBFS Research
5. COPYRIGHT: No part of this document may be reproduced without the explicit written permission of QNBFS Page 5 of 6
Definitions:
Candlestick: A chart that displays the high, low, opening and closing prices for a security in a single period. The body of the candle is made up by the opening
and the closing prices, i.e., the taller the body the greater the range between these two prices and vice versa. A colored candle denotes a closing price that is
lower than the opening price, while a white candle shows the opposite. The candlestick's shadows or wicks show the period's high and low prices and how they
compare to the opening and closing price. In general, the shape of the candle will vary upon the positions of the period's high, low, opening and closing prices.
Support: A level that could cause more buyers to step in in order to prevent the security from falling or causing the security price to head higher.
Resistance: An inverse of a support level. A resistance area or level could cause more sellers to step in in order to prevent the security from rising or causing the
security price to head lower.
SMA (Simple Moving Average): Is an arithmetic average, which calculates the average price of a security over a defined number of periods and is thus
considered a lagging indicator. SMAs used in our analysis refer to closing prices. In general, SMAs serve many purposes, such as a smoothing tool, an indicative
price direction and potential support/resistance levels.
Market Breadth: Breadth indicates the number of securities that have closed higher vs. the number of decliners in a particular exchange.
MACD (Moving Average Convergence/Divergence): Is a trading indicator, which shows changes in the strength, direction, momentum and duration of a trend in
a stock's price through a collection of three time series calculated from historical closing price data.
RSI (Relative Strength Index): Is a momentum indicator that compares a security’s price gains to its losses for a predetermined number of periods (we generally
use 14 periods). The RSI attempts to point out how a security, in relative terms, is in the overbought/oversold zone. Securities with a RSI above 70 could be
considered as overbought, and below 30 could be considered as oversold.
Pattern/Formation: Is a graphical presentation of a security’s price activity over a certain period of time. Formations come in different shapes (such as, head &
shoulders, triangles, flags, and so on). They can be used to identify potential trends, reversal of trends, price targets, entry and exit points, etc.
Fibonacci Retracements: Are horizontal lines that indicate expected areas of support/resistance for a security based on a predetermined price movement. These
levels are usually indicated by Fibonacci ratios of 23.6%, 38.2%, 50.0%, 61.8% and 100% from that particular movement.
Fibonacci Pivot and Intra-day Support/Resistance: A Pivot Point is generally used to formulate expected future support/resistance levels. From the base Pivot
Point, Fibonacci multiples of the high-low differential are added to form resistance levels and subtracted to form support levels.
6. COPYRIGHT: No part of this document may be reproduced without the explicit written permission of QNBFS Page 6 of 6
Contacts
Saugata Sarkar Abdullah Amin, CFA Shahan Keushgerian
Head of Research Senior Research Analyst Senior Research Analyst
Tel: (+974) 4476 6534 Tel: (+974) 4476 6569 Tel: (+974) 4476 6509
saugata.sarkar@qnbfs.com.qa abdullah.amin@qnbfs.com.qa shahan.keushgerian@qnbfs.com.qa
Sahbi Kasraoui Ahmed Al-Khoudary QNB Financial Services SPC
Manager – HNWI Head of Sales Trading – Institutional Contact Center: (+974) 4476 6666
Tel: (+974) 4476 6544 Tel: (+974) 4476 6548 PO Box 24025
sahbi.alkasraoui@qnbfs.com.qa ahmed.alkhoudary@qnbfs.com.qa Doha, Qatar
Disclaimer and Copyright Notice: This publication has been prepared by QNB Financial Services SPC (“QNBFS”) a wholly-owned subsidiary of QNB SAQ (“QNB”). QNBFS is regulated by the Qatar
Financial Markets Authority and the Qatar Exchange QNB SAQ is regulated by the Qatar Central Bank. This publication expresses the views and opinions of QNBFS at a given time only. It is not an offer,
promotion or recommendation to buy or sell securities or other investments, nor is it intended to constitute legal, tax, accounting, or financial advice. QNBFS accepts no liability whatsoever for any direct or
indirect losses arising from use of this report. Any investment decision should depend on the individual circumstances of the investor and be based on specifically engaged investment advice. We
therefore strongly advise potential investors to seek independent professional advice before making any investment decision. Although the information in this report has been obtained from sources that
QNBFS believes to be reliable, we have not independently verified such information and it may not be accurate or complete. QNBFS does not make any representations or warranties as to the accuracy
and completeness of the information it may contain, and declines any liability in that respect. For reports dealing with Technical Analysis, expressed opinions and/or recommendations may be different or
contrary to the opinions/recommendations of QNBFS Fundamental Research as a result of depending solely on the historical technical data (price and volume). QNBFS reserves the right to amend the
views and opinions expressed in this publication at any time. It may also express viewpoints or make investment decisions that differ significantly from, or even contradict, the views and opinions included
in this report. This report may not be reproduced in whole or in part without permission from QNBFS.