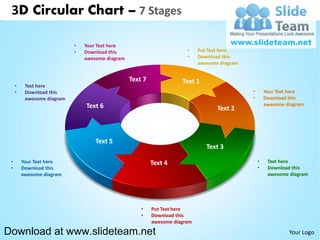
This document describes a 7-stage 3D circular chart template that can be downloaded from www.slideteam.net. The template contains 7 text boxes arranged in a circular formation that can be customized with user text and graphics. All images in the template are fully editable in PowerPoint, allowing users to change colors, sizes, and orientations. The template is designed to bring presentations to life and capture audience attention.
DevOps and Testing slides at DASA ConnectKari Kakkonen
My and Rik Marselis slides at 30.5.2024 DASA Connect conference. We discuss about what is testing, then what is agile testing and finally what is Testing in DevOps. Finally we had lovely workshop with the participants trying to find out different ways to think about quality and testing in different parts of the DevOps infinity loop.
Key Trends Shaping the Future of Infrastructure.pdfCheryl Hung
Keynote at DIGIT West Expo, Glasgow on 29 May 2024.
Cheryl Hung, ochery.com
Sr Director, Infrastructure Ecosystem, Arm.
The key trends across hardware, cloud and open-source; exploring how these areas are likely to mature and develop over the short and long-term, and then considering how organisations can position themselves to adapt and thrive.
PHP Frameworks: I want to break free (IPC Berlin 2024)Ralf Eggert
In this presentation, we examine the challenges and limitations of relying too heavily on PHP frameworks in web development. We discuss the history of PHP and its frameworks to understand how this dependence has evolved. The focus will be on providing concrete tips and strategies to reduce reliance on these frameworks, based on real-world examples and practical considerations. The goal is to equip developers with the skills and knowledge to create more flexible and future-proof web applications. We'll explore the importance of maintaining autonomy in a rapidly changing tech landscape and how to make informed decisions in PHP development.
This talk is aimed at encouraging a more independent approach to using PHP frameworks, moving towards a more flexible and future-proof approach to PHP development.
GraphRAG is All You need? LLM & Knowledge GraphGuy Korland
Guy Korland, CEO and Co-founder of FalkorDB, will review two articles on the integration of language models with knowledge graphs.
1. Unifying Large Language Models and Knowledge Graphs: A Roadmap.
https://arxiv.org/abs/2306.08302
2. Microsoft Research's GraphRAG paper and a review paper on various uses of knowledge graphs:
https://www.microsoft.com/en-us/research/blog/graphrag-unlocking-llm-discovery-on-narrative-private-data/
Accelerate your Kubernetes clusters with Varnish CachingThijs Feryn
A presentation about the usage and availability of Varnish on Kubernetes. This talk explores the capabilities of Varnish caching and shows how to use the Varnish Helm chart to deploy it to Kubernetes.
This presentation was delivered at K8SUG Singapore. See https://feryn.eu/presentations/accelerate-your-kubernetes-clusters-with-varnish-caching-k8sug-singapore-28-2024 for more details.
JMeter webinar - integration with InfluxDB and GrafanaRTTS
Watch this recorded webinar about real-time monitoring of application performance. See how to integrate Apache JMeter, the open-source leader in performance testing, with InfluxDB, the open-source time-series database, and Grafana, the open-source analytics and visualization application.
In this webinar, we will review the benefits of leveraging InfluxDB and Grafana when executing load tests and demonstrate how these tools are used to visualize performance metrics.
Length: 30 minutes
Session Overview
-------------------------------------------
During this webinar, we will cover the following topics while demonstrating the integrations of JMeter, InfluxDB and Grafana:
- What out-of-the-box solutions are available for real-time monitoring JMeter tests?
- What are the benefits of integrating InfluxDB and Grafana into the load testing stack?
- Which features are provided by Grafana?
- Demonstration of InfluxDB and Grafana using a practice web application
To view the webinar recording, go to:
https://www.rttsweb.com/jmeter-integration-webinar
GDG Cloud Southlake #33: Boule & Rebala: Effective AppSec in SDLC using Deplo...James Anderson
Effective Application Security in Software Delivery lifecycle using Deployment Firewall and DBOM
The modern software delivery process (or the CI/CD process) includes many tools, distributed teams, open-source code, and cloud platforms. Constant focus on speed to release software to market, along with the traditional slow and manual security checks has caused gaps in continuous security as an important piece in the software supply chain. Today organizations feel more susceptible to external and internal cyber threats due to the vast attack surface in their applications supply chain and the lack of end-to-end governance and risk management.
The software team must secure its software delivery process to avoid vulnerability and security breaches. This needs to be achieved with existing tool chains and without extensive rework of the delivery processes. This talk will present strategies and techniques for providing visibility into the true risk of the existing vulnerabilities, preventing the introduction of security issues in the software, resolving vulnerabilities in production environments quickly, and capturing the deployment bill of materials (DBOM).
Speakers:
Bob Boule
Robert Boule is a technology enthusiast with PASSION for technology and making things work along with a knack for helping others understand how things work. He comes with around 20 years of solution engineering experience in application security, software continuous delivery, and SaaS platforms. He is known for his dynamic presentations in CI/CD and application security integrated in software delivery lifecycle.
Gopinath Rebala
Gopinath Rebala is the CTO of OpsMx, where he has overall responsibility for the machine learning and data processing architectures for Secure Software Delivery. Gopi also has a strong connection with our customers, leading design and architecture for strategic implementations. Gopi is a frequent speaker and well-known leader in continuous delivery and integrating security into software delivery.
Software Delivery At the Speed of AI: Inflectra Invests In AI-Powered QualityInflectra
In this insightful webinar, Inflectra explores how artificial intelligence (AI) is transforming software development and testing. Discover how AI-powered tools are revolutionizing every stage of the software development lifecycle (SDLC), from design and prototyping to testing, deployment, and monitoring.
Learn about:
• The Future of Testing: How AI is shifting testing towards verification, analysis, and higher-level skills, while reducing repetitive tasks.
• Test Automation: How AI-powered test case generation, optimization, and self-healing tests are making testing more efficient and effective.
• Visual Testing: Explore the emerging capabilities of AI in visual testing and how it's set to revolutionize UI verification.
• Inflectra's AI Solutions: See demonstrations of Inflectra's cutting-edge AI tools like the ChatGPT plugin and Azure Open AI platform, designed to streamline your testing process.
Whether you're a developer, tester, or QA professional, this webinar will give you valuable insights into how AI is shaping the future of software delivery.
Search and Society: Reimagining Information Access for Radical FuturesBhaskar Mitra
The field of Information retrieval (IR) is currently undergoing a transformative shift, at least partly due to the emerging applications of generative AI to information access. In this talk, we will deliberate on the sociotechnical implications of generative AI for information access. We will argue that there is both a critical necessity and an exciting opportunity for the IR community to re-center our research agendas on societal needs while dismantling the artificial separation between the work on fairness, accountability, transparency, and ethics in IR and the rest of IR research. Instead of adopting a reactionary strategy of trying to mitigate potential social harms from emerging technologies, the community should aim to proactively set the research agenda for the kinds of systems we should build inspired by diverse explicitly stated sociotechnical imaginaries. The sociotechnical imaginaries that underpin the design and development of information access technologies needs to be explicitly articulated, and we need to develop theories of change in context of these diverse perspectives. Our guiding future imaginaries must be informed by other academic fields, such as democratic theory and critical theory, and should be co-developed with social science scholars, legal scholars, civil rights and social justice activists, and artists, among others.
LF Energy Webinar: Electrical Grid Modelling and Simulation Through PowSyBl -...DanBrown980551
Do you want to learn how to model and simulate an electrical network from scratch in under an hour?
Then welcome to this PowSyBl workshop, hosted by Rte, the French Transmission System Operator (TSO)!
During the webinar, you will discover the PowSyBl ecosystem as well as handle and study an electrical network through an interactive Python notebook.
PowSyBl is an open source project hosted by LF Energy, which offers a comprehensive set of features for electrical grid modelling and simulation. Among other advanced features, PowSyBl provides:
- A fully editable and extendable library for grid component modelling;
- Visualization tools to display your network;
- Grid simulation tools, such as power flows, security analyses (with or without remedial actions) and sensitivity analyses;
The framework is mostly written in Java, with a Python binding so that Python developers can access PowSyBl functionalities as well.
What you will learn during the webinar:
- For beginners: discover PowSyBl's functionalities through a quick general presentation and the notebook, without needing any expert coding skills;
- For advanced developers: master the skills to efficiently apply PowSyBl functionalities to your real-world scenarios.
Connector Corner: Automate dynamic content and events by pushing a buttonDianaGray10
Here is something new! In our next Connector Corner webinar, we will demonstrate how you can use a single workflow to:
Create a campaign using Mailchimp with merge tags/fields
Send an interactive Slack channel message (using buttons)
Have the message received by managers and peers along with a test email for review
But there’s more:
In a second workflow supporting the same use case, you’ll see:
Your campaign sent to target colleagues for approval
If the “Approve” button is clicked, a Jira/Zendesk ticket is created for the marketing design team
But—if the “Reject” button is pushed, colleagues will be alerted via Slack message
Join us to learn more about this new, human-in-the-loop capability, brought to you by Integration Service connectors.
And...
Speakers:
Akshay Agnihotri, Product Manager
Charlie Greenberg, Host
Connector Corner: Automate dynamic content and events by pushing a button
3 d pie chart circular with hole in center 7 stages powerpoint diagrams and powerpoint templates
1. 3D Circular Chart – 7 Stages
• Your Text here
• Download this • Put Text here
awesome diagram • Download this
awesome diagram
Text 7 Text 1
• Text here
• Download this • Your Text here
awesome diagram • Download this
Text 6 awesome diagram
Text 2
Text 5
Text 3
• Your Text here Text 4 • Text here
• Download this • Download this
awesome diagram awesome diagram
• Put Text here
• Download this
awesome diagram
Download at www.slideteam.net Your Logo
2. 3D Circular Chart – 7 Stages
Text 1 Put Text Here
• Your Text Goes here
• Download this
Text 7
awesome diagram
• Bring your
presentation to life
Text 6 Text 2 • Capture your
audience’s attention
• All images are 100%
editable in powerpoint
Text 5
Text 3 • Download this
awesome diagram
Text 4
Download at www.slideteam.net Your Logo
3. 3D Circular Chart – 7 Stages
Your Text Here
• Your Text Goes here
• Download this
Text 7 Text 1 awesome diagram
• Bring your
presentation to life
Text 6 Text 2 • Capture your
audience’s attention
• All images are 100%
editable in powerpoint
Text 5
Text 3 • Download this
awesome diagram
Text 4
Download at www.slideteam.net Your Logo
4. 3D Circular Chart – 7 Stages
Your Text Here
• Your Text Goes here
• Download this
Text 7 Text 1 awesome diagram
• Bring your
Text 2 presentation to life
Text 6
• Capture your
audience’s attention
• All images are 100%
editable in powerpoint
Text 5
Text 3 • Download this
awesome diagram
Text 4
Download at www.slideteam.net Your Logo
5. 3D Circular Chart – 7 Stages
Text Here
• Your Text Goes here
• Download this
Text 7 Text 1 awesome diagram
• Bring your
presentation to life
Text 6
• Capture your
Text 2
audience’s attention
• All images are 100%
editable in powerpoint
Text 5
Text 3 • Download this
awesome diagram
Text 4
Download at www.slideteam.net Your Logo
6. 3D Circular Chart – 7 Stages
Your Text Here
• Your Text Goes here
• Download this
Text 7 Text 1 awesome diagram
• Bring your
presentation to life
Text 6 Text 2 • Capture your
audience’s attention
• All images are 100%
editable in powerpoint
Text 5
• Download this
awesome diagram
Text 4
Text 3
Download at www.slideteam.net Your Logo
7. 3D Circular Chart – 7 Stages
Put Text Here
• Your Text Goes here
• Download this
Text 7 Text 1 awesome diagram
• Bring your
presentation to life
Text 6 Text 2 • Capture your
audience’s attention
• All images are 100%
editable in powerpoint
Text 5
Text 3 • Download this
awesome diagram
Text 4
Download at www.slideteam.net Your Logo
8. 3D Circular Chart – 7 Stages
Your Text Here
• Your Text Goes here
• Download this
awesome diagram
Text 7 Text 1 • Bring your
presentation to life
Text 6 • Capture your
Text 2 audience’s attention
• All images are 100%
editable in powerpoint
Text 5 • Download this
Text 3 awesome diagram
Text 4
Download at www.slideteam.net Your Logo
9. 3D Circular Chart – 7 Stages
Text Here
• Your Text Goes here
• Download this
Text 7 Text 1 awesome diagram
• Bring your
presentation to life
Text 6 Text 2 • Capture your
audience’s attention
• All images are 100%
editable in powerpoint
Text 5
Text 3 • Download this
awesome diagram
Text 4
Download at www.slideteam.net Your Logo
10. 3D Circular Chart – 7 Stages
Your Text Here
• Your Text Goes here
• Download this
Text 7 Text 1 awesome diagram
• Bring your
presentation to life
Text 6 Text 2 • Capture your
audience’s attention
• All images are 100%
editable in powerpoint
Text 3 • Download this
awesome diagram
Text 4
Text 5
Download at www.slideteam.net Your Logo
11. 3D Circular Chart – 7 Stages
Put Text Here
• Your Text Goes here
• Download this
Text 7 Text 1 awesome diagram
• Bring your
presentation to life
Text 6 Text 2 • Capture your
audience’s attention
• All images are 100%
editable in powerpoint
Text 5
Text 3 • Download this
awesome diagram
Text 4
Download at www.slideteam.net Your Logo
12. 3D Circular Chart – 7 Stages
Your Text Here
• Your Text Goes here
• Download this
Text 7 Text 1 awesome diagram
Text 6 • Bring your
presentation to life
Text 2 • Capture your
audience’s attention
• All images are 100%
editable in powerpoint
Text 5
Text 3 • Download this
awesome diagram
Text 4
Download at www.slideteam.net Your Logo
13. 3D Circular Chart – 7 Stages
Text Here
• Your Text Goes here
• Download this
Text 7 Text 1 awesome diagram
• Bring your
presentation to life
Text 6 Text 2 • Capture your
audience’s attention
• All images are 100%
editable in powerpoint
Text 5
Text 3 • Download this
awesome diagram
Text 4
Download at www.slideteam.net Your Logo
14. 3D Circular Chart – 7 Stages
Text 7
Put Text Here
• Your Text Goes here
• Download this
Text 1 awesome diagram
• Bring your
presentation to life
Text 6 Text 2 • Capture your
audience’s attention
• All images are 100%
editable in powerpoint
Text 5
Text 3 • Download this
awesome diagram
Text 4
Download at www.slideteam.net Your Logo
15. 3D Circular Chart – 7 Stages
Your Text Here
• Your Text Goes here
• Download this
Text 7 Text 1 awesome diagram
• Bring your
presentation to life
Text 6 Text 2 • Capture your
audience’s attention
• All images are 100%
editable in powerpoint
Text 5
Text 3 • Download this
awesome diagram
Text 4
Download at www.slideteam.net Your Logo
16. All images are 100% editable in Powerpoint
“Change color, size and orientation of any icon to your liking”
Download at www.slideteam.net
17. Ungrouping the object
2
1
3
1. Right click the object.
2. Choose Group and then Ungroup.
3. Click beside the object and drag the arrow over it.
Download at www.slideteam.net
18. Edit Color
1 2 3
1. Right click the object
2. Choose Format Shape in the dialog box
3. Choose “Fill” in the Format Shape box then “Solid” or “Gradient”
depending on the appearance of the object. Change colour as
shown in the picture.
Download at www.slideteam.net