Downloaded 276 times


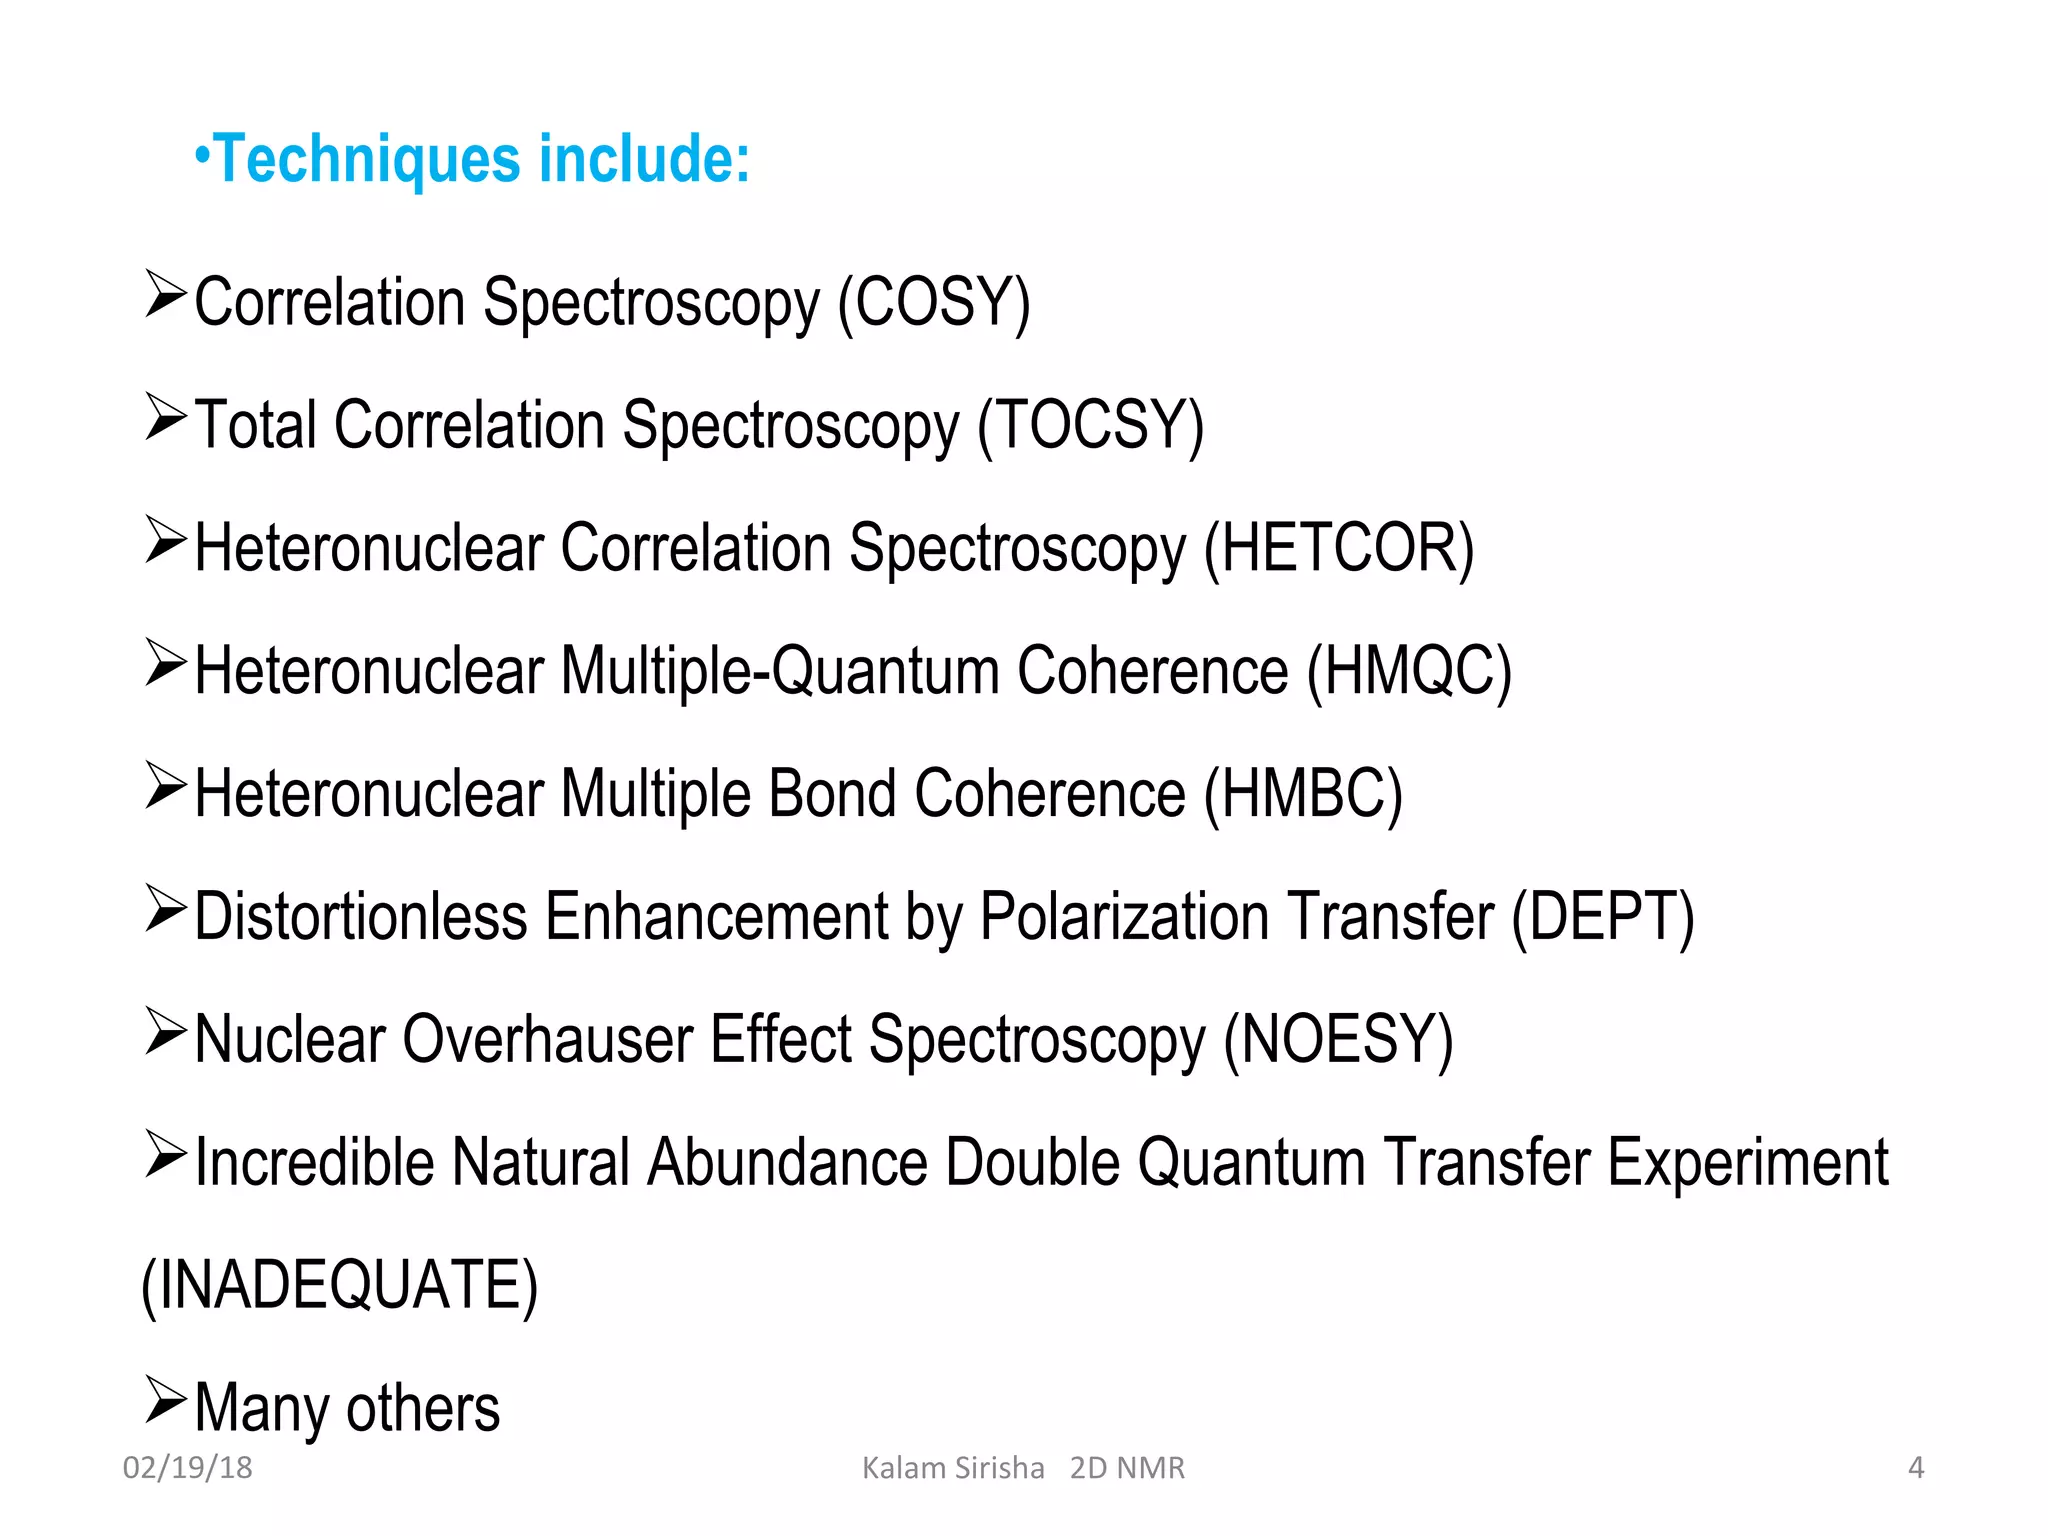


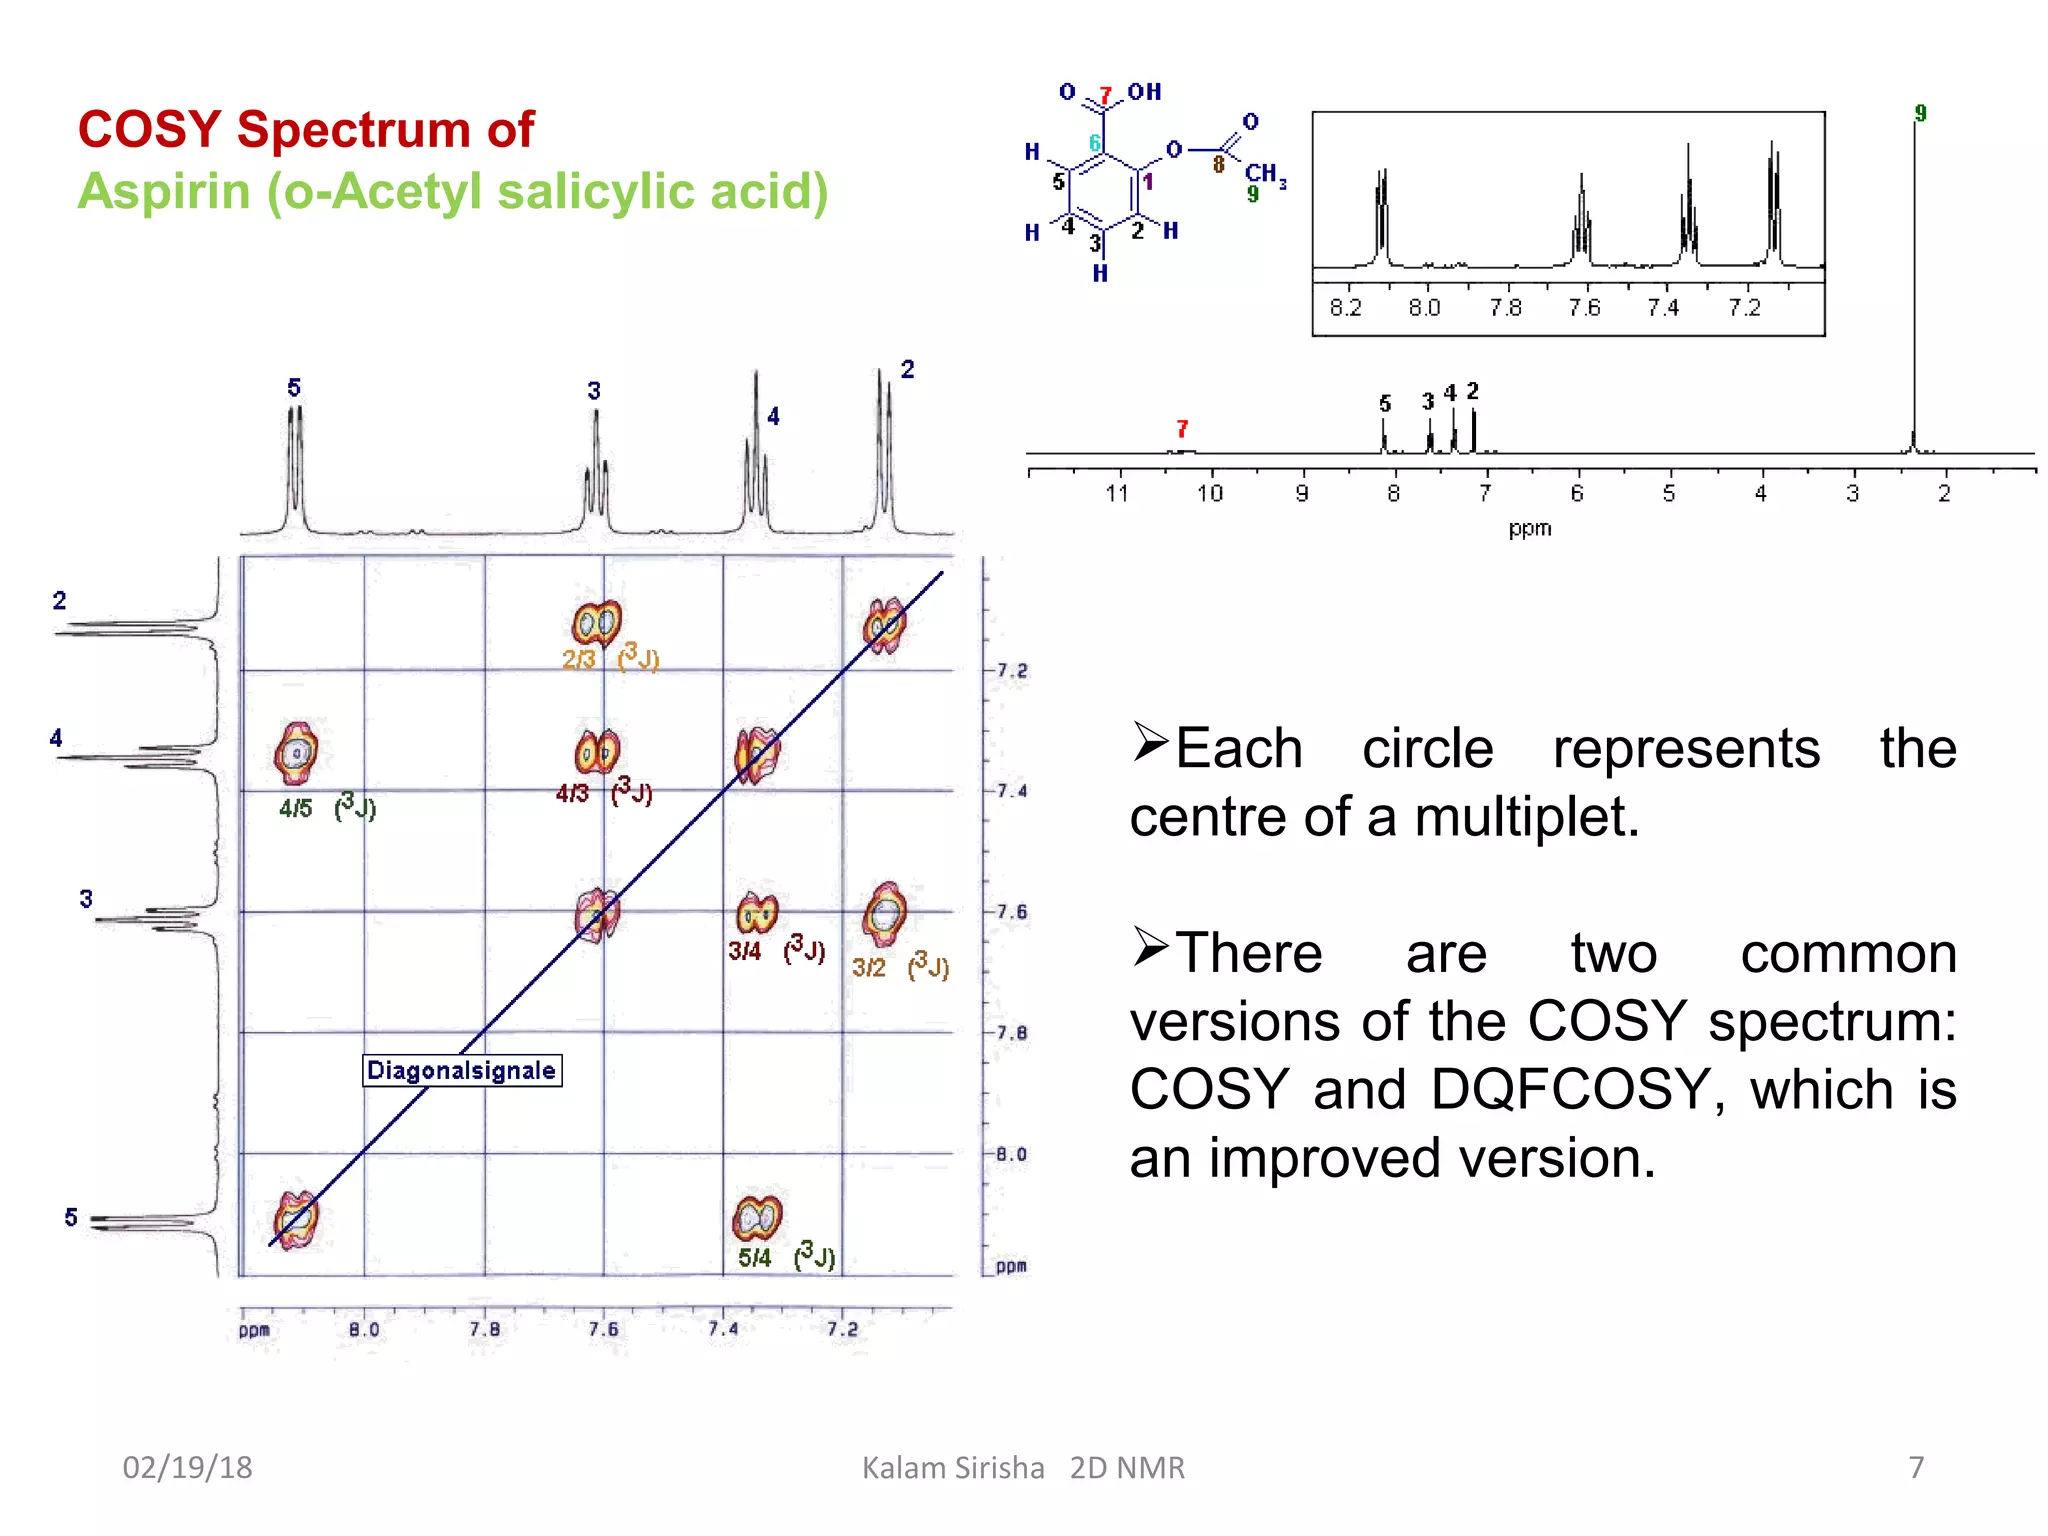
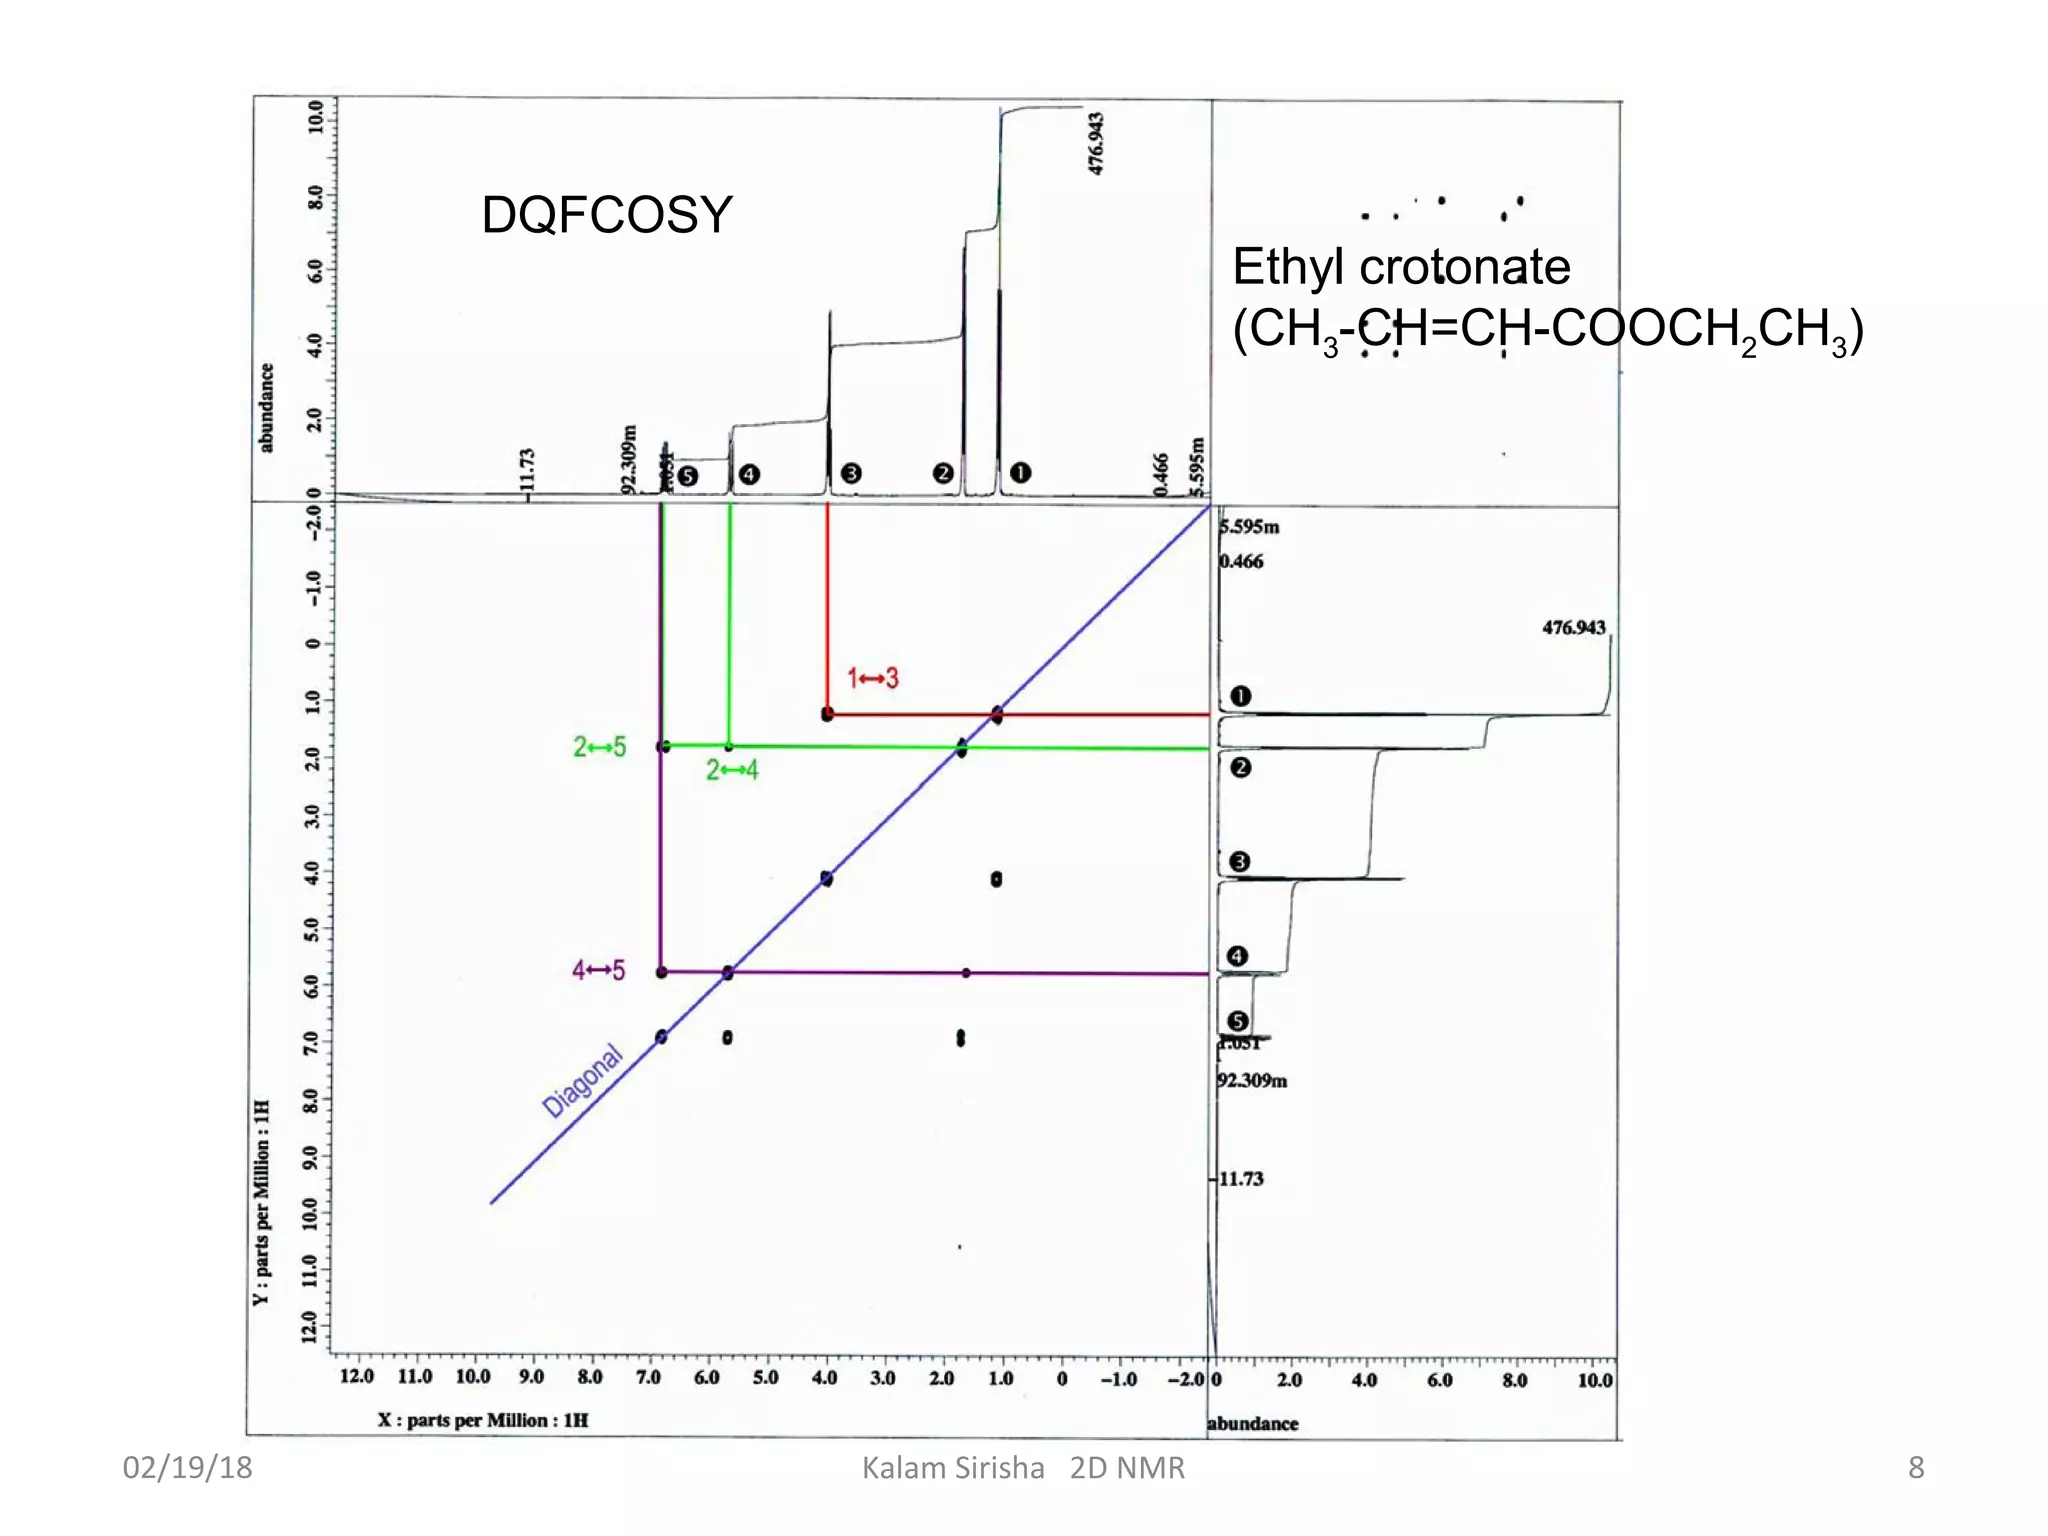

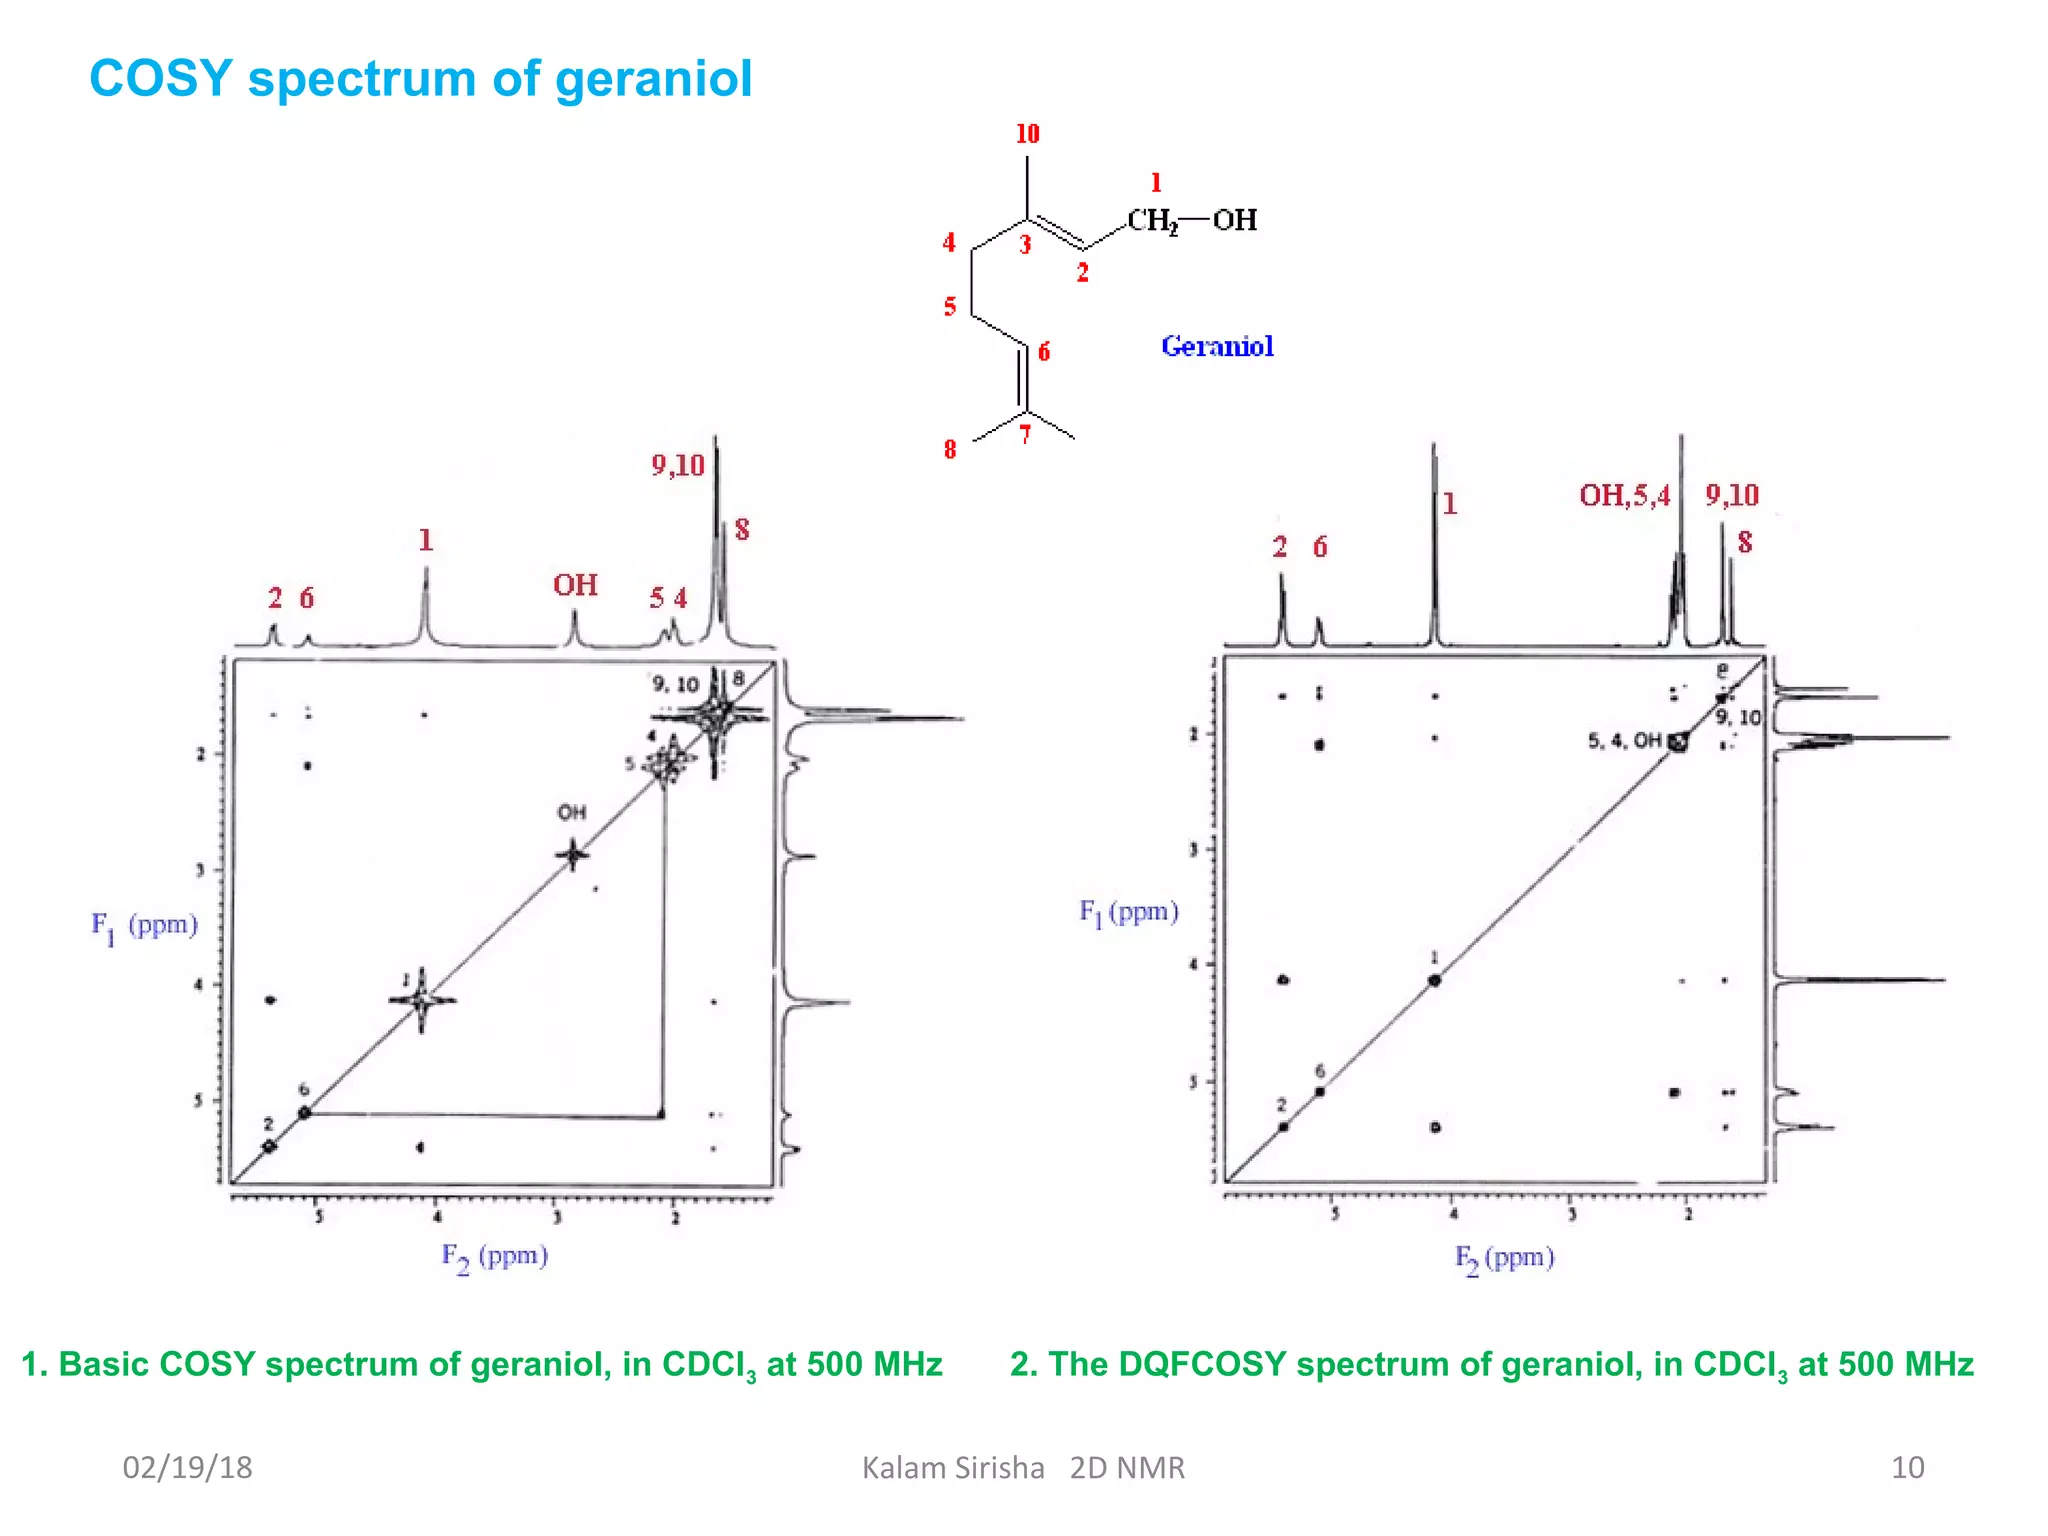


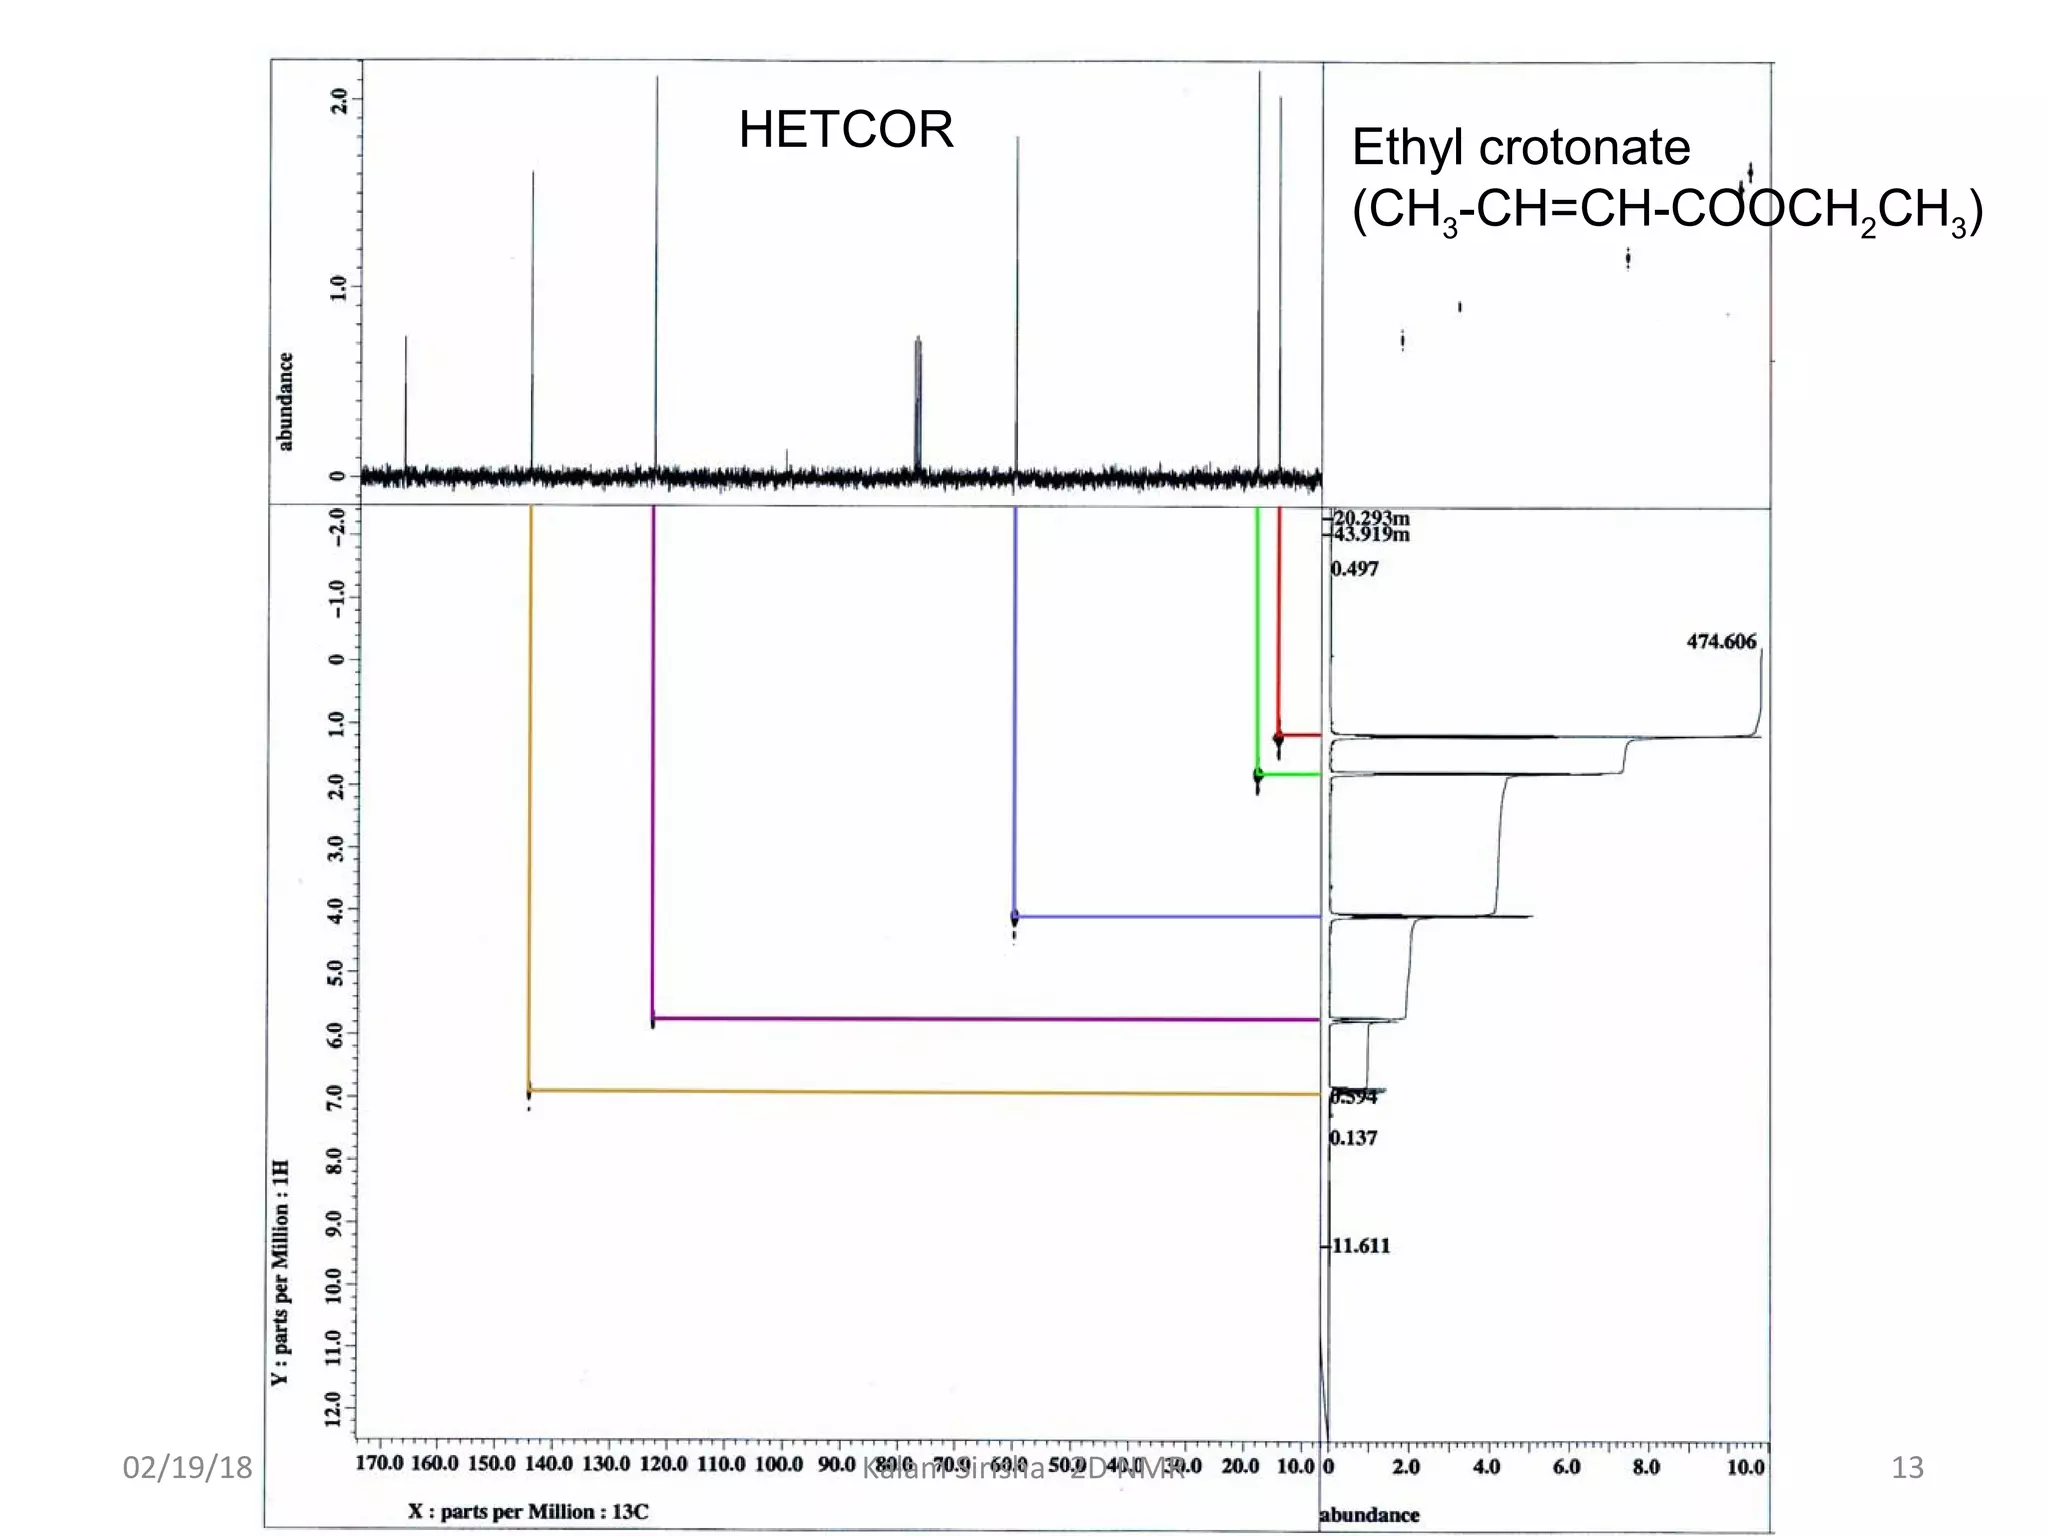
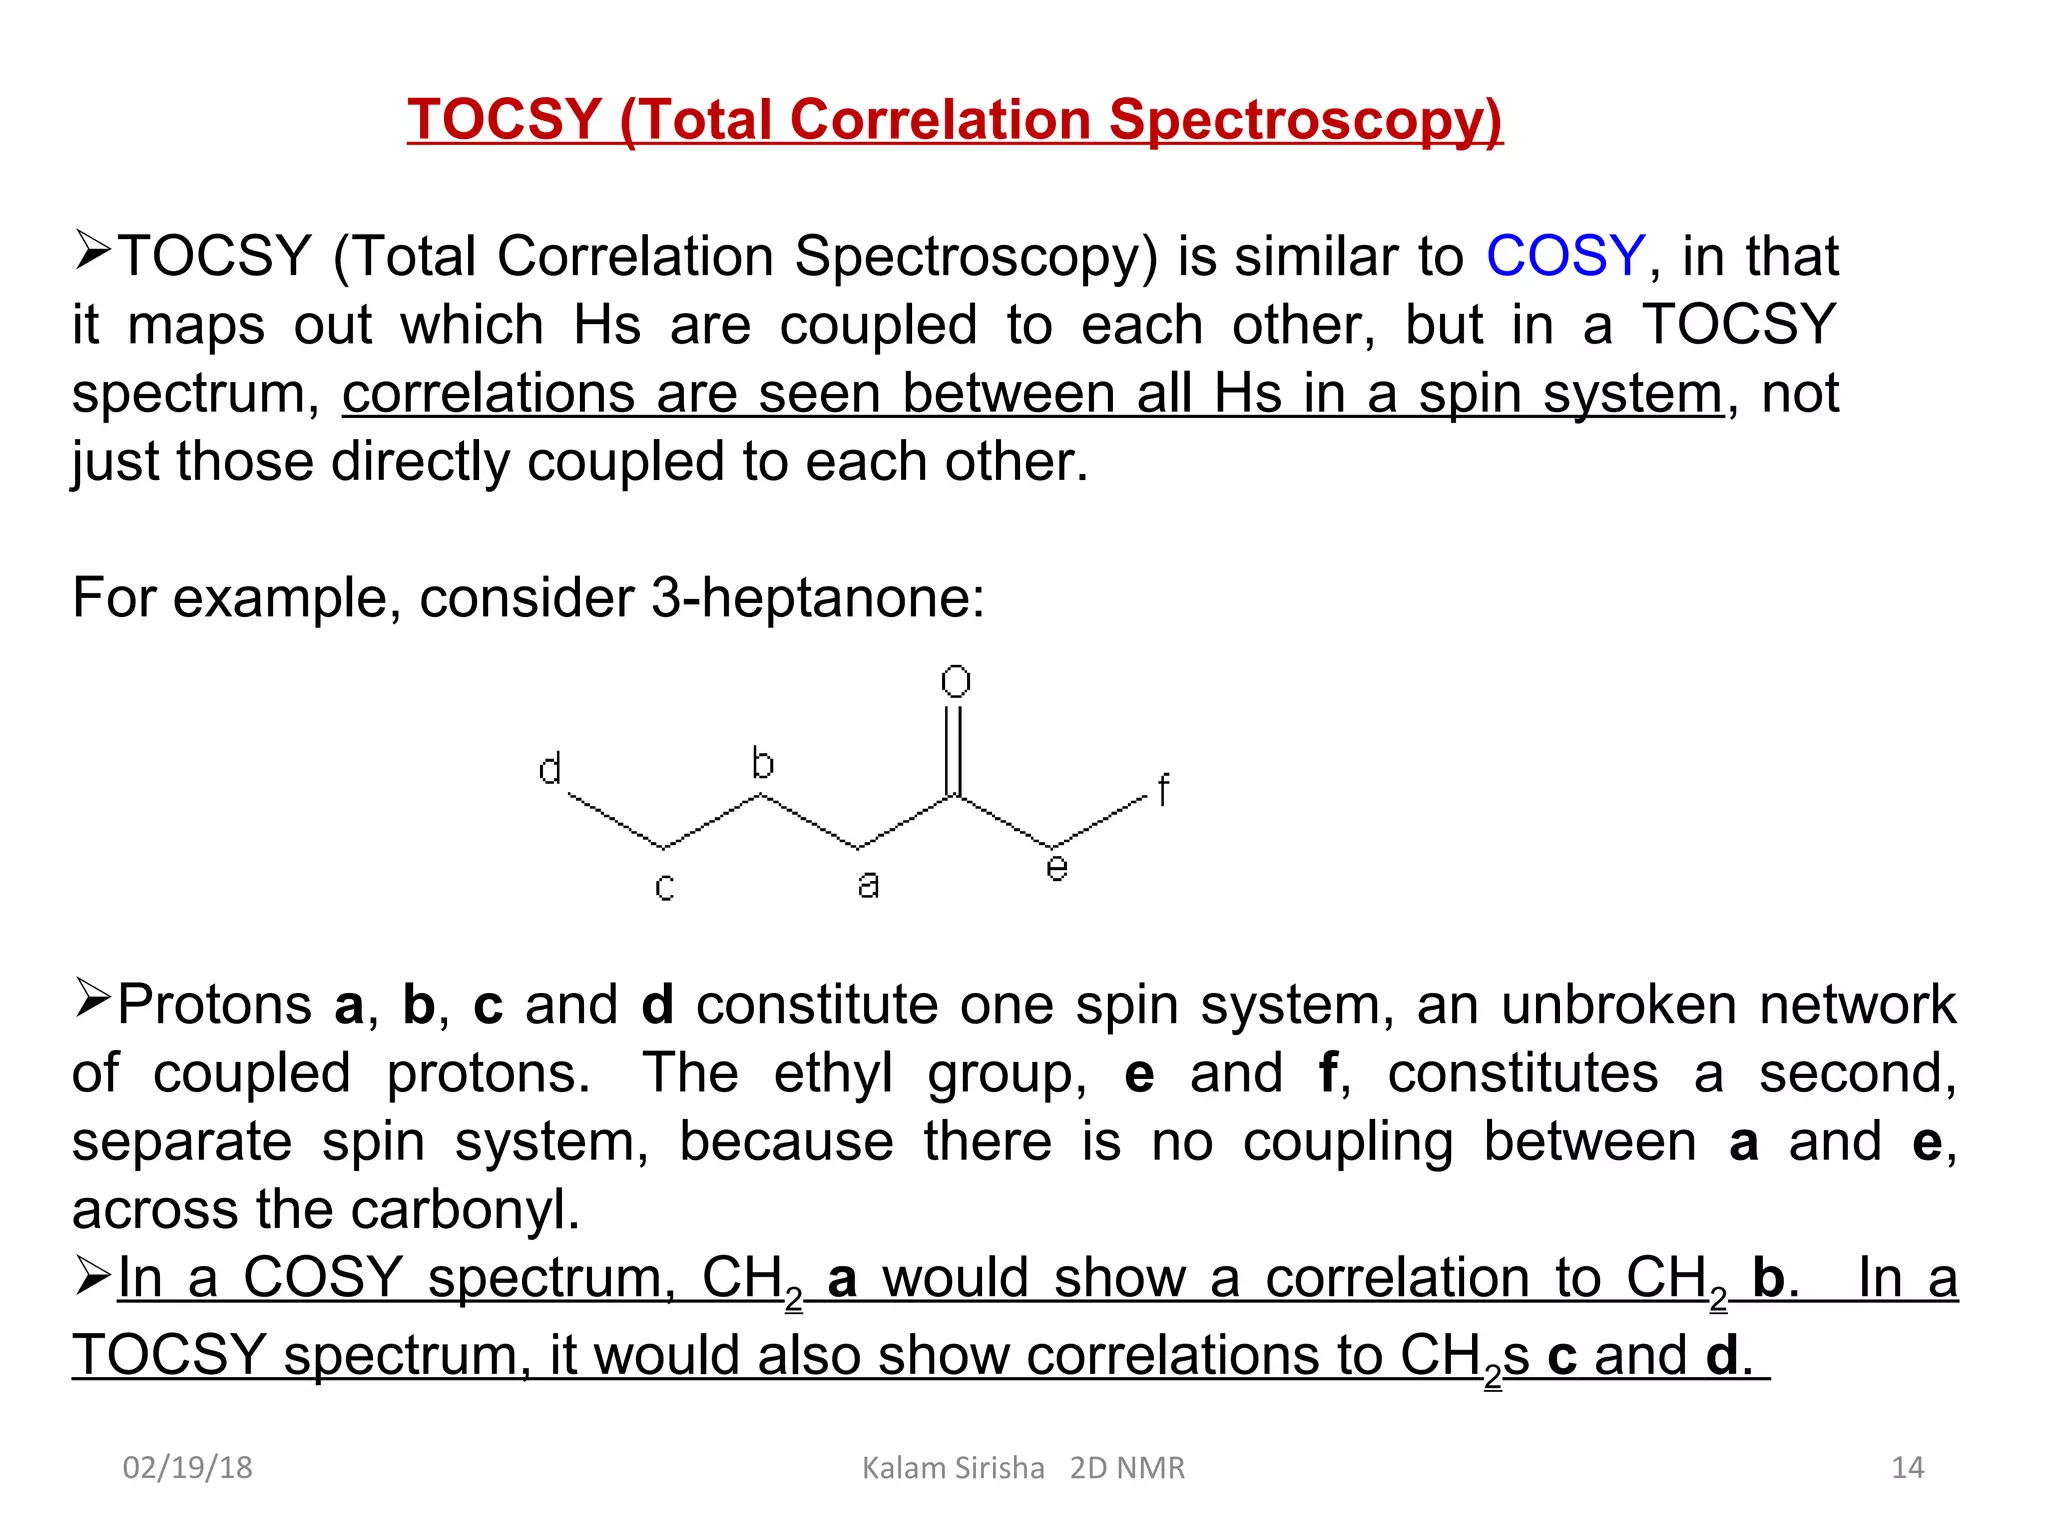


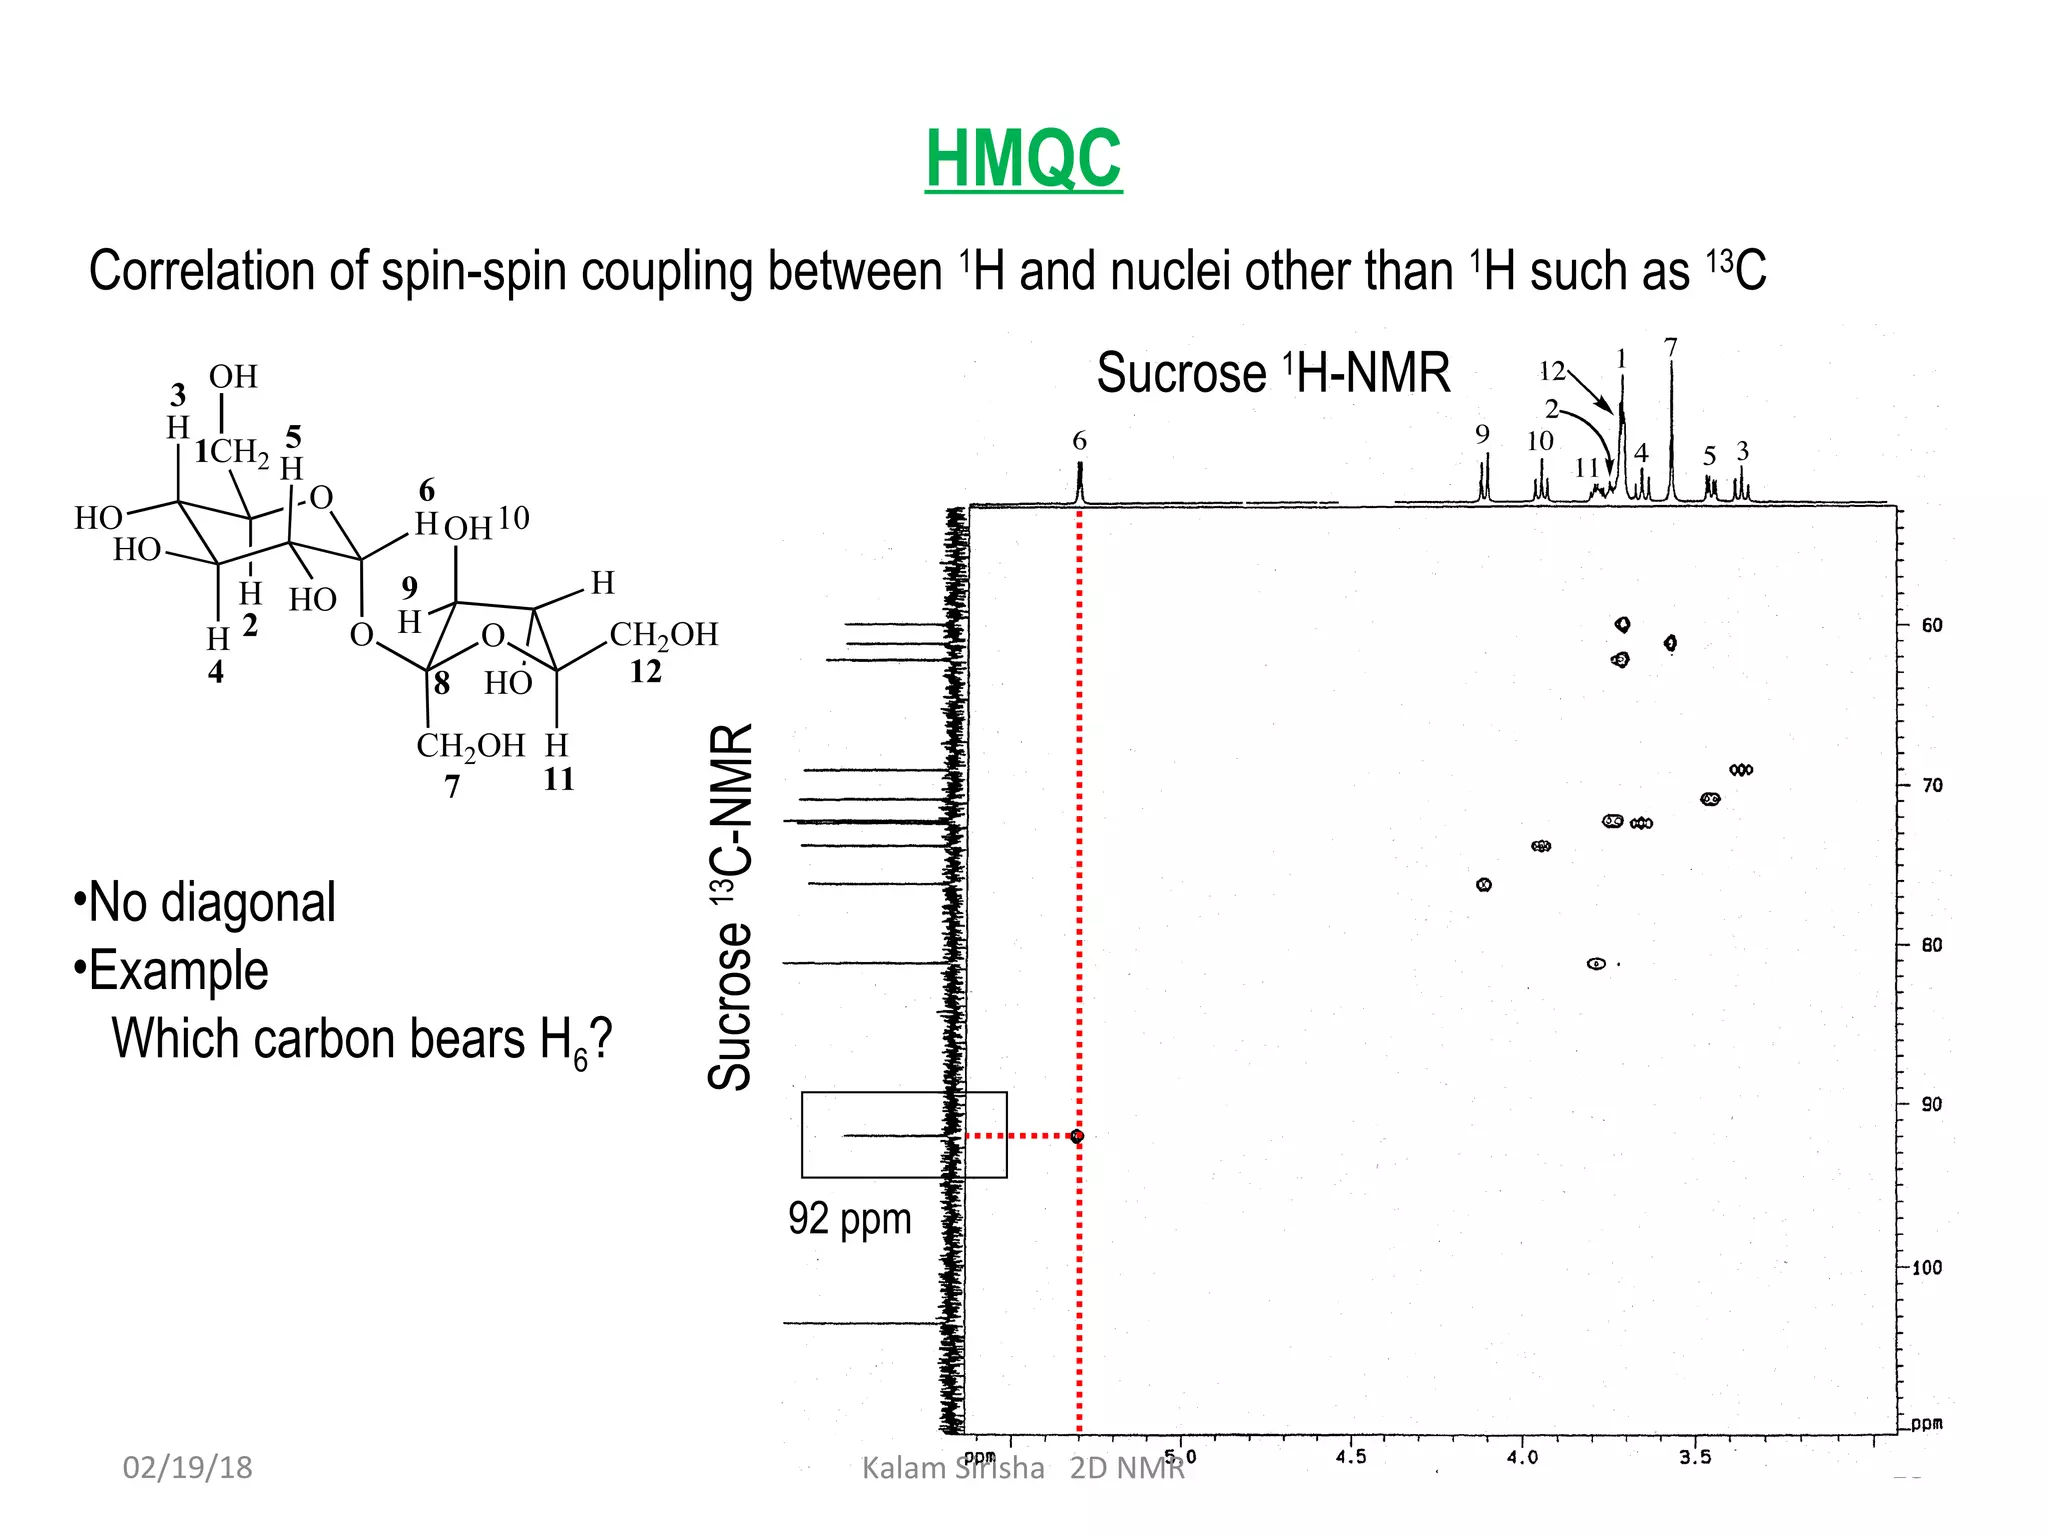


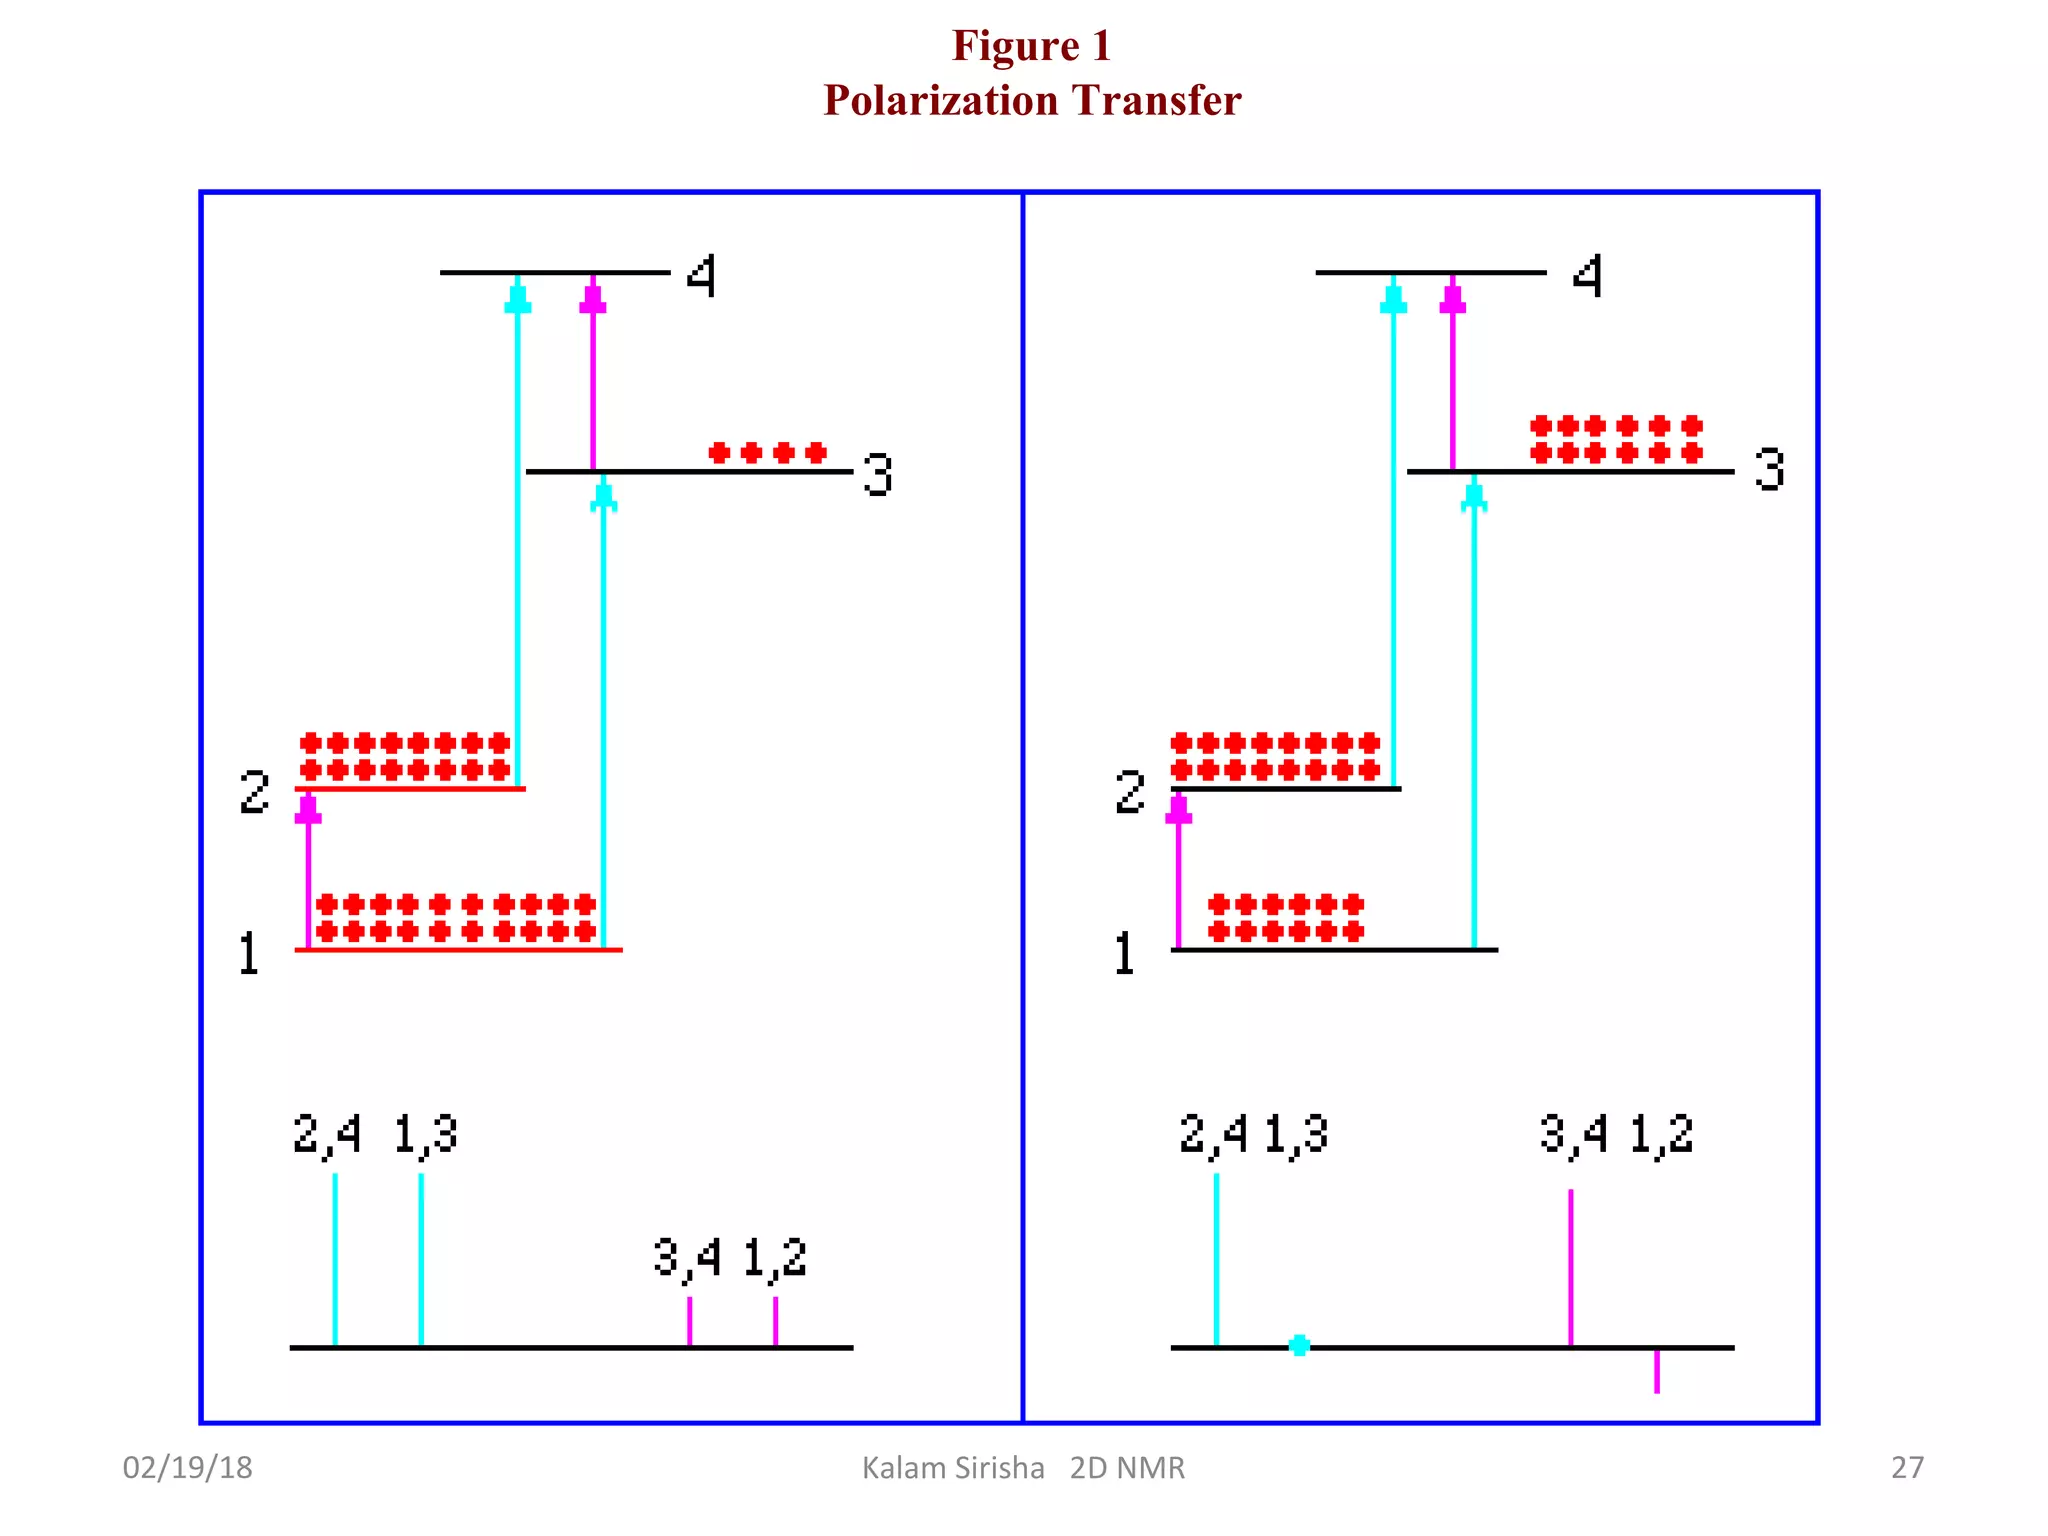

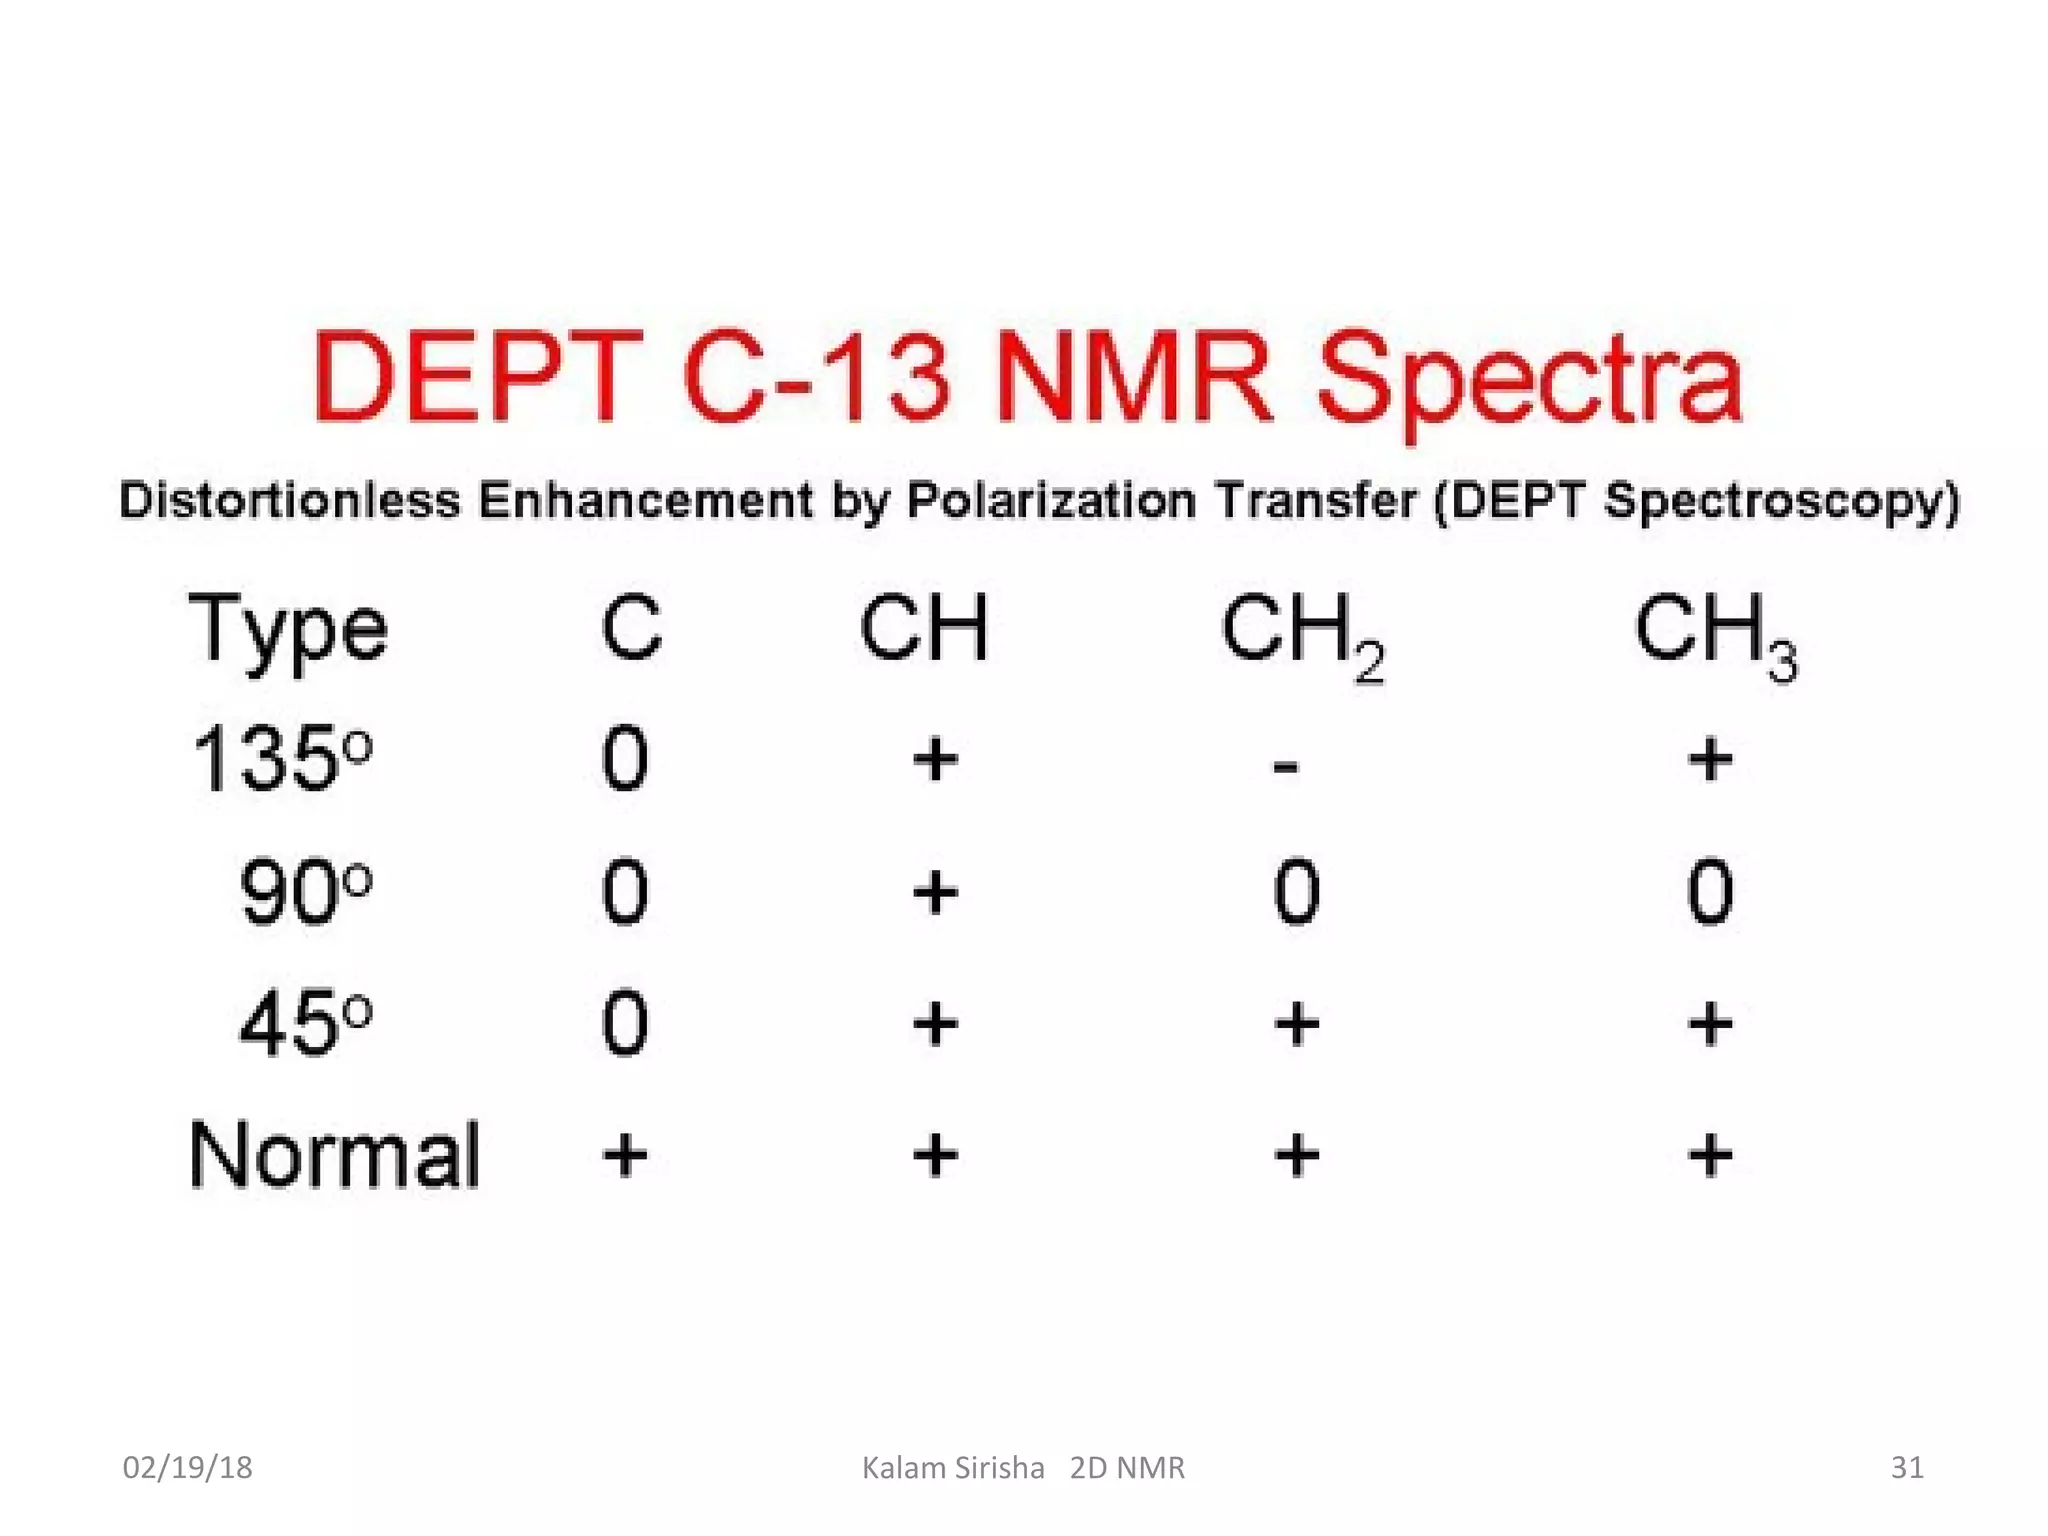

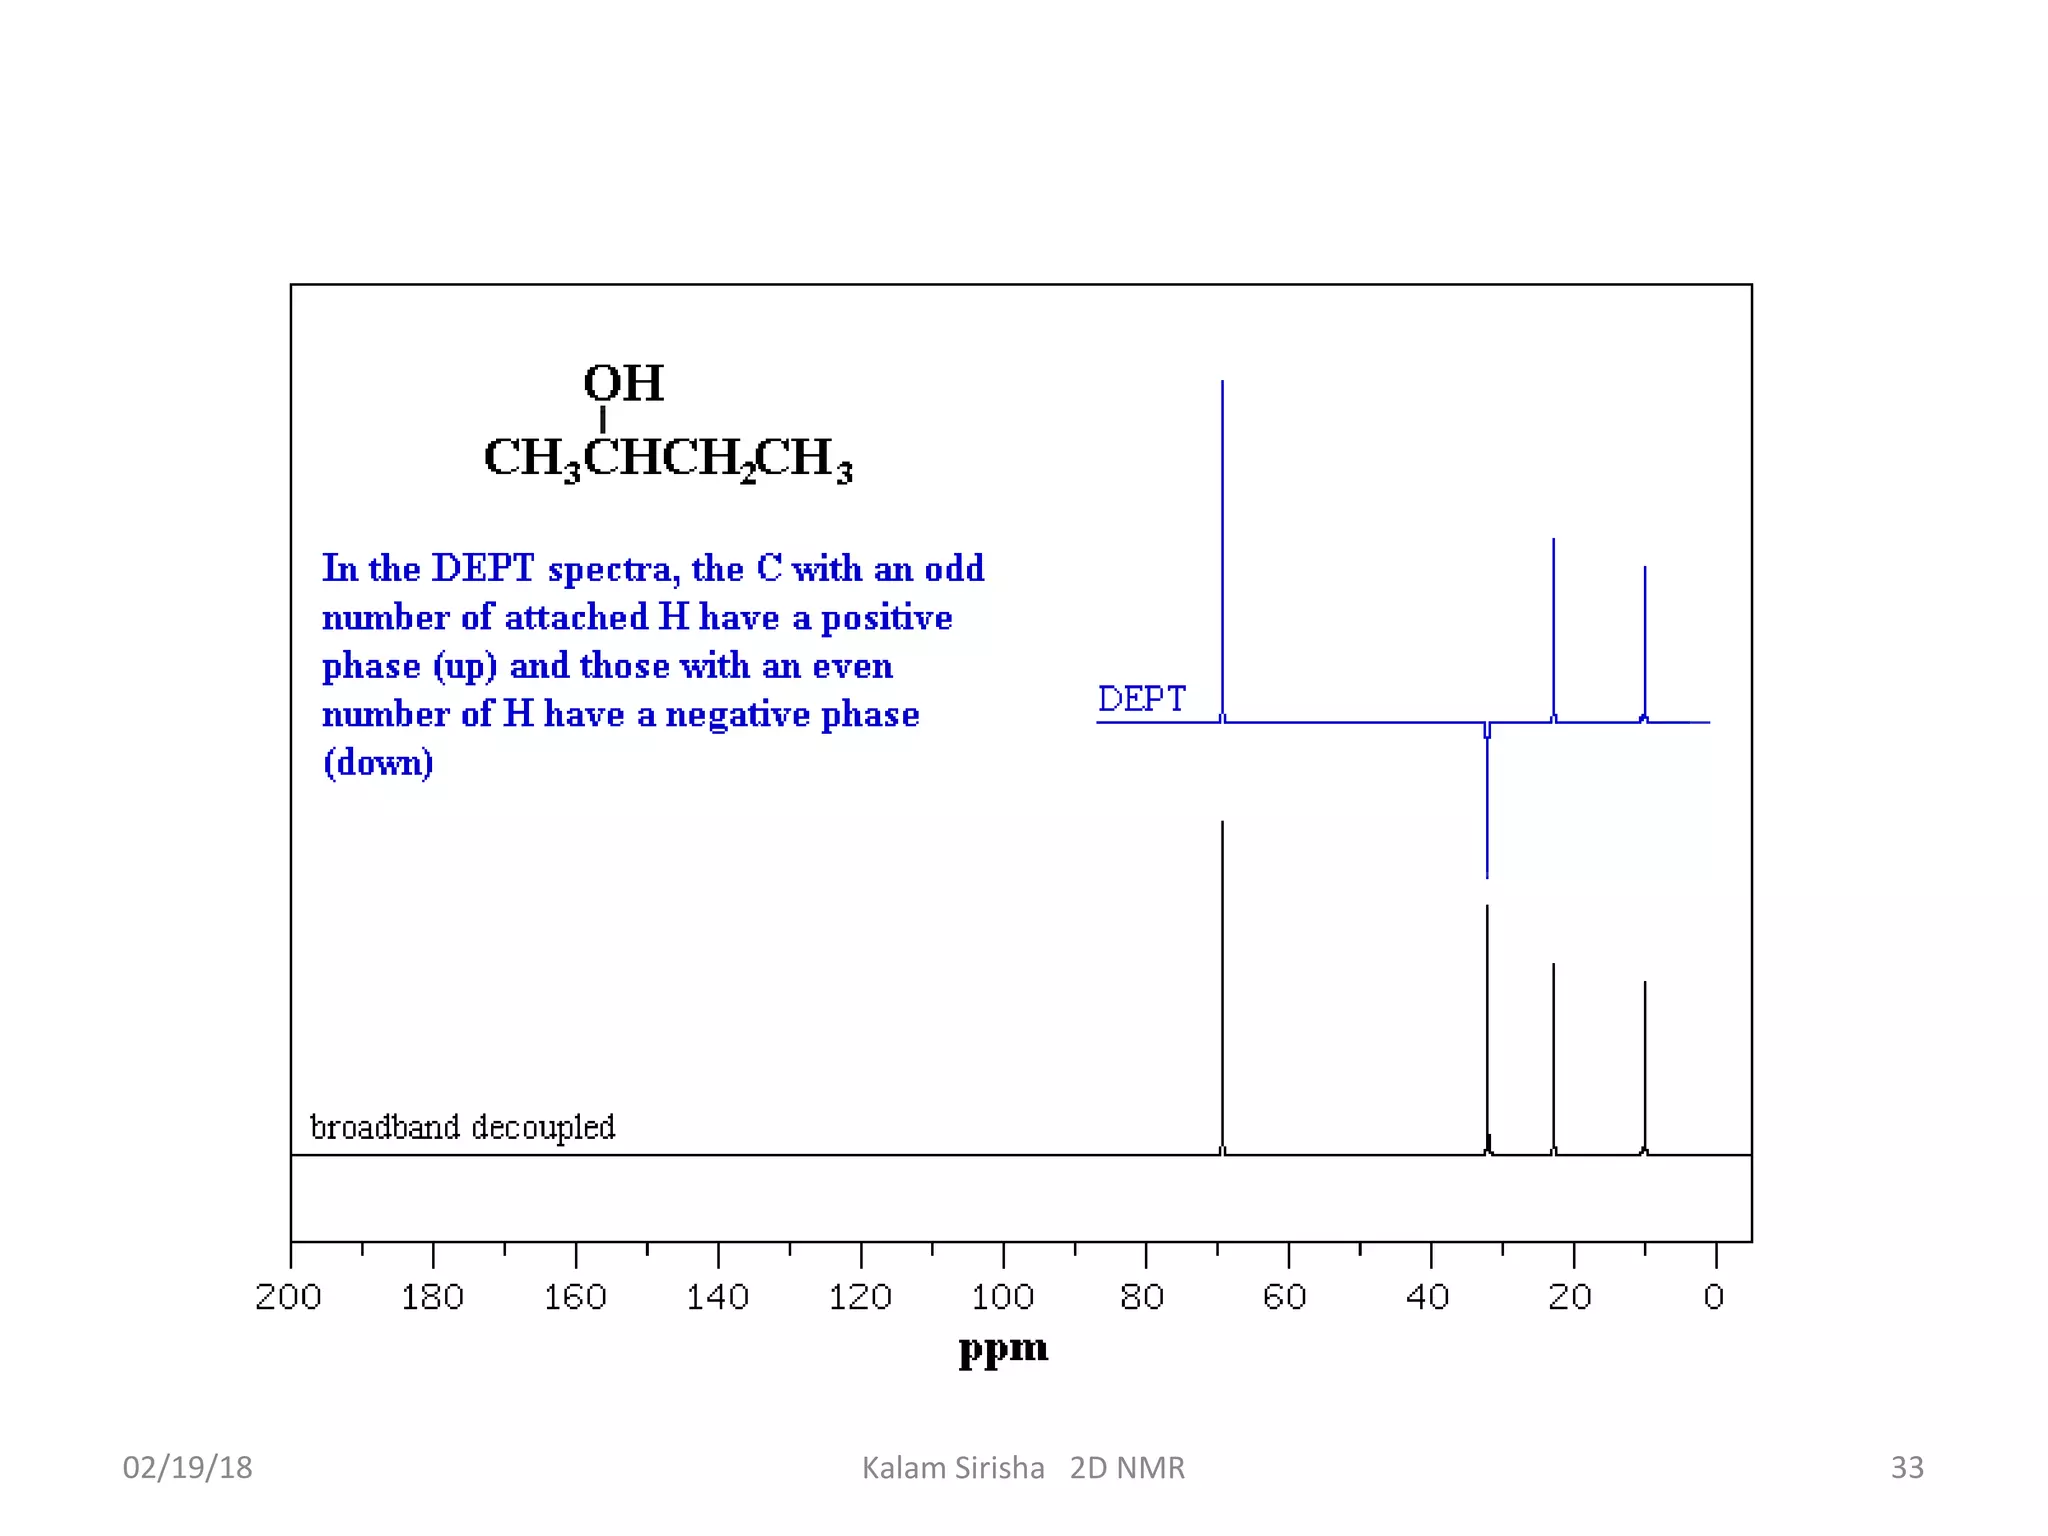
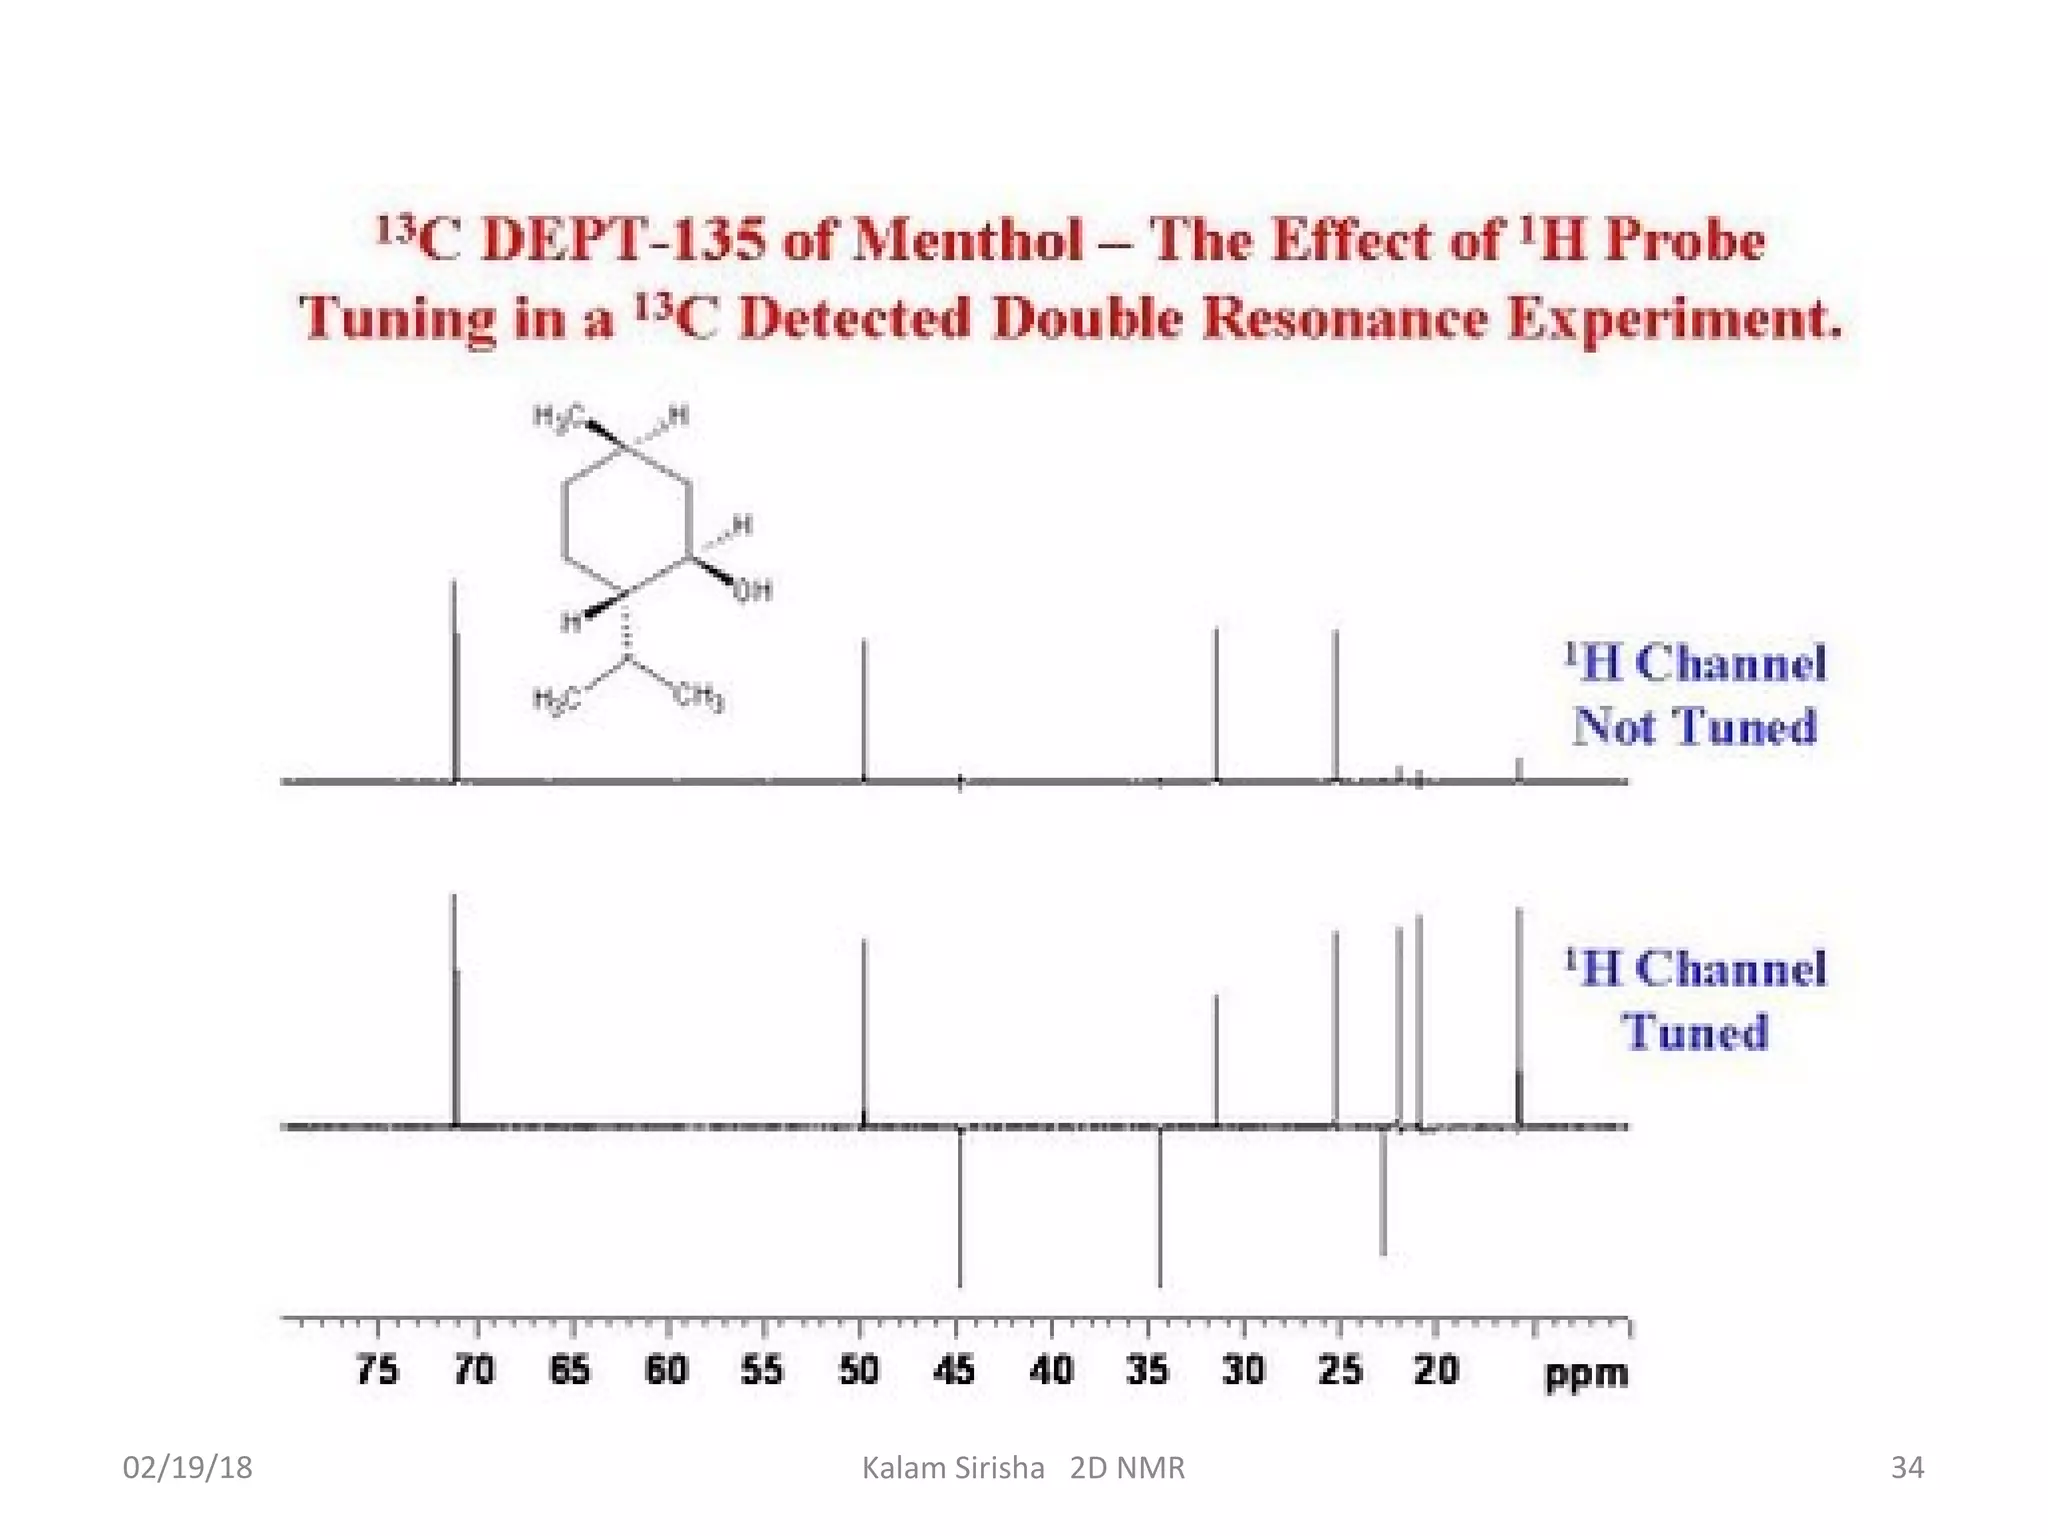


The document provides an overview of two-dimensional NMR spectroscopy (2D NMR) methods, which utilize two frequency axes for improved structural analysis of complex molecules compared to one-dimensional NMR. It describes various techniques including COSY, TOCSY, and HMQC, highlighting their applications in determining proton and carbon correlations, as well as the principles behind signal enhancement methods like DEPT. The document emphasizes the utility of 2D NMR in complex organic compounds such as proteins and demonstrates how these techniques reveal structural information through correlation spectra.


![Noesy [autosaved]](https://cdn.slidesharecdn.com/ss_thumbnails/noesyautosaved-200728183752-thumbnail.jpg?width=640&height=640&fit=bounds)