This document provides a summary of the Teradata Viewpoint User Guide:
1. The guide describes how to use the Teradata Viewpoint portal and portlets to manage Teradata systems, including setting up the portal, working with portlets, and using profiles.
2. The System Administration section covers admin portlets, security, backups, certificates, general settings, and LDAP servers. It provides information on scheduling backups, certificate authorities, HTTPS connections, and adding LDAP servers.
3. The guide contains instructions for common administrative tasks in Teradata Viewpoint like monitoring systems, configuring users and permissions, and maintaining database backups.


![• Click next to a topic name to expand the list of available topics.
• Click next to a topic name to collapse the list of available topics.
3 Click any topic name to display corresponding topic information in the right pane.
4 [Optional] Select links to related topics that are above (parent) or below (child) the
current topic in the content hierarchy.
Using Notifications
Teradata Viewpoint uses notifications to communicate the status of Viewpoint operations.
Notifications are displayed in the Teradata Viewpoint portal for 72 hours from the last status
change.
Notifications appear if they are enabled for your role.
1 Read the notifications, and click to hide the notifications.
2 [Optional] Click to display hidden notifications.
You can click the icon again to hide notifications.
Logging Off
Logging off the Teradata Viewpoint portal ends your current session and returns you to the
Welcome page.
1 From the Teradata Viewpoint main menu bar, click Logout to exit the portal.
All page content is preserved for your next Teradata Viewpoint session. Any open
Teradata Viewpoint Help window is closed.
Setting Up the Portal for Portlets
Teradata Viewpoint provides portlets to manage and monitor systems. A portal page is a
virtual work space where you decide which portlets to display and how to arrange them on
the page. Examples of ways to organize your work include defining a page for each system
being monitored, or for each type of query or user. The currently selected page is called the
active page.
A portal page has two columns that can be resized. After adding portlets to the portal, you
can drag and drop portlets into either column. You can resize the width of the portal
columns on each page by dragging the column divider until the minimum size of a column is
reached. Portlets that can be horizontally resized will expand to fill the width of the column.
Portlets that cannot be horizontally resized are not affected by resizing the portal columns.
Resizing the browser window adjusts the columns proportionally unless a column is at its
minimum size. Not all Viewpoint portlets and products support resizing or two-column
layout.
Chapter 1 Teradata Viewpoint Basics
16 Teradata Viewpoint User Guide, Release 14.01](https://image.slidesharecdn.com/2206user14-01-130625135151-phpapp02/85/2206-user-14-01-16-320.jpg)
![A shared page contains portlets that are applicable to your role. The Teradata Viewpoint
Administrator controls the type of shared page you have access to and can discuss
limitations you may have with read-only and mandatory pages. Your role may be prevented
from adding portlets, deleting portlets, moving portlets on a page, as well as other functions
you may have been accustomed to doing with regular portal pages.
Adding a Page
Organize your portlets by adding pages to the Teradata Viewpoint portal. Multiple pages
can be added or removed. The newest page is always the active page unless you click another
tab.
1 In the portal, do one of the following:
• Click Add Page.
• Click and select Add Page if shared page administration state is enabled for your
role.
A new tab appears and becomes the active page.
2 [Optional] Add portlets from the Add Content menu.
Naming a Page
One way you can customize the Teradata Viewpoint portal is by giving meaningful names to
the pages that display portlets. You can change the page name at any time during a Teradata
Viewpoint session. Two pages can have the same name.
1 Click the page tab to highlight the page name.
2 Enter the new name up to 30 characters.
3 Press Enter to apply the new name.
4 [Optional] Rearrange the portal pages to group and organize pages or according to the
frequency of use.
Adding a Portlet
A portlet can be added to the active page at any time during a session. Except for the
Calendar portlet, multiple instances of a portlet can be added to a portal page.
1 In the portal, click Add Content.
2 Select a portlet from the submenus.
The portlet is added to the top of the left-most column.
3 [Optional] Reposition the portlet on the portal page by dragging it to another location.
Chapter 1 Teradata Viewpoint Basics
Teradata Viewpoint User Guide, Release 14.01 17](https://image.slidesharecdn.com/2206user14-01-130625135151-phpapp02/85/2206-user-14-01-17-320.jpg)

![4 [Optional] Add portlets from the Add Content menu if the shared page is not read-
only.
Refreshing a Shared Page
When the Teradata Viewpoint Administrator updates the contents of a shared page, an icon
in the tab indicates a new version of the page is available. You can keep your current
version by renaming the page or removing the out of date page and then adding the
refreshed page to the portal.
1 Rename or remove a shared page when a new version is available.
Option Description
Rename a. Click the page tab to highlight the page name.
b. Enter the new name up to 30 characters.
c. Press Enter.
The icon disappears from the tab after you rename the page.
Remove a. Click the out of date page tab indicated by .
b. Click to remove the page.
c. Click OK.
2 In the portal, click Add Content.
Mandatory shared pages automatically appear when you log on and cannot be added
from the Add Content menu.
3 Select Shared Pages.
4 Select the refreshed page from the submenu.
A new tab appears and becomes the active page.
5 [Optional] Add portlets from the Add Content menu if the shared page is not read-
only.
Deleting a Portlet
A portlet can be deleted from the active portal page at any time. Deleting a portlet resets
portlet information and deletes any custom settings set for that instance only. Other portlet
instances on the same page or on other pages are not affected.
1 On the active portal page, mouse over the portlet frame to activate the portlet.
The portlet does not need to be expanded if it is collapsed.
2 Click to remove the portlet from the portal page.
A confirmation message appears.
3 Click OK.
The portlet is removed from the active portal page.
Chapter 1 Teradata Viewpoint Basics
Teradata Viewpoint User Guide, Release 14.01 19](https://image.slidesharecdn.com/2206user14-01-130625135151-phpapp02/85/2206-user-14-01-19-320.jpg)


![Any user can customize a shareable portlet and submit it for sharing. Depending on your
Teradata Viewpoint system configuration, the portlet is not available to authorized users
until the Teradata Viewpoint Administrator approves the request. Only the Teradata
Viewpoint Administrator can delete the shared portlet entirely. If deleted, existing instances
remain on your portal page. However, a warning message appears if you try to access the
portlet.
The Shared Portlets feature allows you to:
• Share customized views of a Teradata Viewpoint portlet with other users.
• Create different configurations of a portlet for different roles.
• Assign a preconfigured portlet to a role as a default instance of the portlet.
• Assign a name to the preconfigured portlet.
The portlet name appears in the Shared submenu of the Add Content menu. The Shared
submenu only appears when at least one shared portlet is enabled for the user who is logged
on.
Creating a Shared Portlet
Use the SHARE PORTLET feature to customize a Teradata Viewpoint portlet and make it
available to other users.
1 Add a portlet instance that you want to share to your portal page.
2 From the portlet frame, click to access the PREFERENCES view.
3 Customize the portlet using the available preference settings.
4 Click OK to save the settings.
5 Click to access the SHARE PORTLET dialog box.
6 Enter a name for the custom portlet using up to 25 characters.
Depending on your Teradata Viewpoint system configuration, the portlet may or may
not be available to authorized users until the Teradata Viewpoint Administrator
approves your request.
7 Click Save.
8 [Optional] Contact the Teradata Viewpoint Administrator to verify that the portlet has
been received for approval.
Chapter 1 Teradata Viewpoint Basics
26 Teradata Viewpoint User Guide, Release 14.01](https://image.slidesharecdn.com/2206user14-01-130625135151-phpapp02/85/2206-user-14-01-26-320.jpg)


![Adding a User Profile
This task explains how to associate Teradata Database profiles with your Teradata Viewpoint
profile.
1 From the Profile portlet, click the Teradata Accounts tab.
2 Under Add Account, select a Teradata Database system from the list.
3 Enter the following information in the appropriate fields:
• Username
• Password
• [Optional] Account string
4 [Optional] Select an authentication mechanism from the list for use on the system.
5 [Optional] Click Test.
The icon appears if the operation is successful. The icon appears if the operation
fails; verify that the settings are correct, and try again.
6 Click Add.
Editing a User Profile
This topic explains how to edit a Teradata Database system user profile in Teradata
Viewpoint.
1 From the Profile portlet, click the Teradata Accounts tab.
2 Mouse over the row containing the user profile information for the Teradata Database
system you are updating.
The row is highlighted, and Edit and Delete appear.
3 Click Edit to the right of the row containing the user profile information.
4 Edit or change any of the following fields:
• PASSWORD
• ACCOUNT STRING
5 [Optional] Click Test to verify that the logon settings are correct.
A confirmation message appears.
6 Click Save to save your changes.
A confirmation message appears.
Deleting a User Profile
This task explains how to delete a Teradata Database system user profile from Teradata
Viewpoint.
1 From the Profile portlet, click the Teradata Accounts tab.
2 Mouse over the row containing the Teradata Database user profile information for the
system you are updating.
The row is highlighted, and Edit and Delete appear.
Chapter 2 Profile
30 Teradata Viewpoint User Guide, Release 14.01](https://image.slidesharecdn.com/2206user14-01-130625135151-phpapp02/85/2206-user-14-01-30-320.jpg)


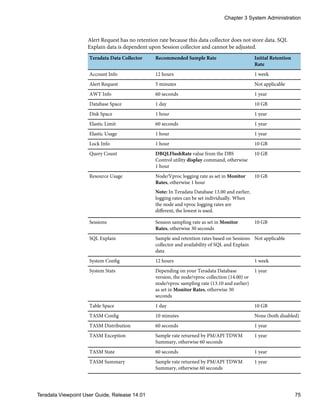
![About Backup Errors
The BACKUP dialog box displays an out-of-service icon and the status message AN
ERROR HAS OCCURRED, if an error occurs during the backup process. To investigate the
error, you can view the backup log file: /opt/teradata/dcs/logs/backup.log. For
additional information, see the Teradata Viewpoint Configuration Guide.
Scheduling Viewpoint Backups
You can configure automatic backups, set a data retention length, and enable or disable the
backup process at any time.
1 [Optional] From the BACKUP view, do one of the following:
• Select the Enable backup check box to activate the backup process.
• Clear the Enable backup check box to disable the automatic-backup process.
2 Under Location, select one of the following options to set the location of the backup
files:
Option Description
Local Backs up Teradata Viewpoint databases to the local server.
Network Backs up Teradata Viewpoint databases to a networked file server to prevent data loss
in the event of a catastrophic failure.
• Enter a Host to specify the host system name.
• Enter a Path to specify the absolute path name where the backups are stored on
the host system.
• [Optional] Click Test to verify that the login settings are correct. The icon
appears if the operation is successful. The icon appears if the operation fails;
verify that the settings are correct, and try again.
3 From the Daily Backup Time list, select the daily start time of the backup operation.
4 From the Keep Backups For list, select the number of days to retain the backup data.
5 Click Apply.
The changes are saved and backup files are deleted when they are older than the
configured number of days.
Certificates
The Certificates portlet allows you to manage certificates on the Viewpoint Server.
Certificates are used to help secure communications to and from a Viewpoint server. You
can install a certificate to secure communication from a browser to the Viewpoint server
and from the Viewpoint server to external servers. You can install a trusted root certificate
for a Certificate Authority to be trusted by the Viewpoint server.
Chapter 3 System Administration
Teradata Viewpoint User Guide, Release 14.01 35](https://image.slidesharecdn.com/2206user14-01-130625135151-phpapp02/85/2206-user-14-01-35-320.jpg)

![• Use the dialog box to enable and disable an LDAP server, and configure the LDAP to
automatically validate users against the LDAP directory with the auto-provisioning
feature or assign user roles with the role mapping feature.
What Is an LDAP Server?
Teradata Viewpoint uses a Lightweight Directory Access Protocol (LDAP) server to:
• Validate new user information by querying the LDAP for authentication. The binding
operation authenticates a username and a password.
• Automatically create a Teradata Viewpoint username with the auto-provisioning feature.
• Automatically assign users to a Teradata Viewpoint role with the Role Mapping feature.
Adding an LDAP Server
You can add an LDAP server to authenticate and assign roles to Teradata Viewpoint users.
1 Click next to SETUPS.
2 Enter a Nickname for the LDAP server up to 8 characters.
3 [Optional] Select the Enabled check box to activate LDAP upon successfully adding the
LDAP server to Teradata Viewpoint.
4 Enter a URL address.
One URL address is required. Use to delete, add, and move up or move down in
the evaluation order.
5 Select the Name Matching method from the following options:
• Select DN Pattern Bind to specify one or more patterns that represent a
distinguished name (DN) in the LDAP directory.
• Select User Search to search for a pattern in the base directory or subdirectories:
• [Optional] Enter a Service account DN and Service account password to search
with a specific account.
• [Optional] Leave Service account DN and Service account password blank to
connect to the LDAP as an anonymous user.
• Enter a Search pattern.
• Enter a Search base to specify a base directory for the search pattern.
• [Optional] Select the Search extent Recursive scan check box to include
subdirectories of the base directory in the search.
• [Optional] Under Search extent, clear the Recursive scan check box to limit the
search to the specified base directory.
6 Configure Key User Information:
• Enter the LDAP first name attribute.
• Enter the LDAP last name attribute.
• Enter the LDAP email attribute.
Chapter 3 System Administration
Teradata Viewpoint User Guide, Release 14.01 39](https://image.slidesharecdn.com/2206user14-01-130625135151-phpapp02/85/2206-user-14-01-39-320.jpg)
![Every user has an email address. This default email domain is used if a valid email
address is not found in the LDAP directory during auto-provisioning.
7 [Optional] Test your settings:
a Click Test to display the LDAP test panel.
b Enter a Test username and Test password.
c Click Run.
The icon appears if the operation is successful. The icon appears if the operation
fails; verify that the settings are correct, and try again.
8 [Optional] Configure Auto-Provisioning:
a [Optional] Select the Turn on auto-provisioning check box to automatically validate
users against the LDAP directory.
b Select a role from the Automatically assign these roles menu. You can add or
remove roles.
c Enter a Default email domain to provide a notification email address.
Every user has an email address. This default email domain is used if a valid email
address is not found in the LDAP directory during auto-provisioning.
9 If the group role mapping method is specified, configure Role Mapping:
a Enter a Group search base.
b [Optional] Select the Group search subtree check box to include subtree directories
during the binding process.
c Enter a Group attribute name.
d [Optional] Click Add Role Mapping to add attribute or group settings so that you
can assign another role.
10 Click Apply.
The icon appears if the operation is successful. The icon appears if the operation
fails; verify that the settings are correct, and try again.
About Role Mapping
In Teradata Viewpoint, users are assigned roles to organize and control their access to
portlets, metrics, and features. You can use the Roles Manager portlet to assign permissions
to the roles. During the process of adding an LDAP configuration to Teradata Viewpoint, the
optional Role Mapping section in the LDAP Servers portlet allows you to assign a role
automatically to auto-provisioned users.
Use role mapping to:
• Assign roles for a new user.
• Add roles that were assigned to the user since the last user login.
• Remove roles that were removed since the last user login.
Chapter 3 System Administration
40 Teradata Viewpoint User Guide, Release 14.01](https://image.slidesharecdn.com/2206user14-01-130625135151-phpapp02/85/2206-user-14-01-40-320.jpg)
![Adding a Managed Server
You can add a managed server to Teradata Viewpoint. After a managed server is defined in
Teradata Viewpoint, you can test the configuration settings and enable the managed server
for use by the Data Collection Service (DCS).
1 Click next to SERVERS.
2 [Optional] Select the Server enabled check box to activate the managed server for the
DCS.
3 Enter values for these required fields:
• Managed Server Name up to eight characters.
• Hostname is the managed server IP address or domain name.
• Login is the user name and password.
The default values only need to be changed if you change the login and password settings
during the installation of TMS Monitor.
4 Do any of the following:
• Click Test to verify that the login settings are correct.
• Click Apply to update the managed server.
The icon appears if the operation is successful. The icon appears if the operation
fails; verify that the settings are correct, and try again. If you are unable to enable or
disable the managed server, contact the Teradata Viewpoint Administrator.
Deleting a Managed Server
You can delete a Teradata Viewpoint managed server. This is a permanent procedure that
differs from disabling the managed server from the Data Collection Service.
1 From the SERVERS list, click the managed server name you want to remove.
2 In the dialog box, click Delete Server.
A confirmation message appears.
3 Click OK.
Enabling or Disabling a Managed Server
After a managed server is defined in Teradata Viewpoint, you can enable it for use by the
Data Collection Service (DCS) or disable it.
1 From the SERVERS list, click the managed server name you want to update.
2 Do one of the following:
• Select the Server enabled check box to activate a managed server.
• Clear the Server enabled check box to disable a managed server.
When disabled, the DCS does not use the managed server. Any existing data about the
managed server can still be viewed.
Chapter 3 System Administration
42 Teradata Viewpoint User Guide, Release 14.01](https://image.slidesharecdn.com/2206user14-01-130625135151-phpapp02/85/2206-user-14-01-42-320.jpg)
![Deleting a Shared Portlet
The Teradata Viewpoint Administrator can use the Portlet Library to delete a shared portlet
so Teradata Viewpoint users can no longer access it.
1 In the Manage Existing Portlets dialog box, click Shared to expand the category.
2 Click under the DELETE column that corresponds to the shared portlet you want to
delete.
A confirmation message appears.
3 Click OK.
The portlet name no longer appears in the Add Content menu in the portal, and the
portlet is no longer available to Teradata Viewpoint users. Existing instances of a shared
portlet on a portal page remain on the page. However, a warning message appears if a
user tries to access the portlet.
Query Group Setup
The Query Group Setup portlet allows the Teradata Viewpoint Administrator to manage the
sets of queries that are available to users in the Query Groups portlet. You can create query
groups based on a set of criteria, assign users that can access the group, and delete query
groups.
Creating a Query Group
Create a query group in the Query Group Setup portlet to allow users to view their most
relevant queries in the Query Groups portlet. You create a query group to filter the queries
that are displayed and limit the users that have access to the group.
1 Select a system from the list of enabled systems.
A system cannot be changed after you create a query group.
2 Click next to GROUPS.
3 Enter a query group name up to 30 characters.
4 [Optional] Enter a description up to 256 characters.
5 In the Criteria tab, do one of the following:
Chapter 3 System Administration
44 Teradata Viewpoint User Guide, Release 14.01](https://image.slidesharecdn.com/2206user14-01-130625135151-phpapp02/85/2206-user-14-01-44-320.jpg)
![• Select Every criteria below to match at least one value in each defined sub-tab.
Criteria on each sub-tab are joined by AND.
• Select Any criteria below to match at least one value in one or more of the defined
sub-tabs. Criteria on each sub-tab are joined by OR.
6 Select a criteria from the Add Criteria list.
7 [Optional] For account string, username, or workload name criteria, do any of the
following:
• In the Match string box, type a value to dynamically define criteria, and click to
move it to the Selected box. The value can contain ? to match exactly one character in
the position it occupies, * to match zero or more characters, or = at the beginning of
the string to match alpha and numeric characters literally.
• In the Match string box, type a value to filter the list of available values.
• Select a value from the Available box and click to move it to the Selected box.
8 [Optional] For Query Band criteria, do any of the following:
• Select a query band name from the list and a value from the Available values box,
and click to move it to the Selected box.
• Type a custom query band name and value pair, and then click to move it to the
Selected box.
9 In the Access tab, do any of the following:
• In the User list filter box, type a value to filter the list of available users. The value
can contain ? to match exactly one character in the position it occupies, * to match
zero or more characters, or = at the beginning of the string to match alpha and
numeric characters literally.
• In the Available users box, select one or more Viewpoint users and click to move
it to the Selected users box.
• In the Available roles box, select one or more Viewpoint roles and click to move
it to the Selected roles box.
Chapter 3 System Administration
Teradata Viewpoint User Guide, Release 14.01 45](https://image.slidesharecdn.com/2206user14-01-130625135151-phpapp02/85/2206-user-14-01-45-320.jpg)
![10 [Optional] Click Reset to clear the query group name, description, and the selections on
the Criteria and Access tabs.
11 Click Apply.
Viewing Query Groups
The Query Group Setup portlet allows you to view the query groups that have been created
for enabled systems. If a system is disabled in the Teradata Systems portlet, it does not
appear in the Query Group Setup portlet; however, the defined criteria is retained.
1 Select a system to view query groups related to that system.
2 [Optional] Click a row in the query group list to see the details for that group.
Editing a Query Group
Edit a query group when criteria or users require updating or if a user changes roles.
If a system is disabled in the Teradata Systems portlet, it does not appear in the Query
Group Setup portlet; however, the defined criteria is retained.
1 Select the system associated with the query group.
2 Click a row in the list for the query group you want to edit.
3 [Optional] Enter a new name or change the description.
4 [Optional] In the Criteria tab, do one of the following:
• Select Every criteria below to match at least one value in each defined sub-tab.
Criteria on each sub-tab are joined by AND.
• Select Any criteria below to match at least one value in one or more of the defined
sub-tabs. Criteria on each sub-tab are joined by OR.
5 For each criteria you select, do any of the following:
• Edit the criteria.
• Click to delete the criteria and associated values.
• Select unnecessary or obsolete criteria from the Selected box and click Remove.
6 In the Access tab, edit the list of Viewpoint users and roles that can view the query
group.
7 [Optional] Click Reset to revert the query group name and description, and any changes
made in the Criteria or Access tabs to the previously applied values.
8 Click Apply.
Filter Symbols
Use wildcard characters or symbols in a filter to expand or limit search criteria. Some
symbols are used for string filtering and others are used for numeric filtering. String filters
are not case sensitive and an asterisk wildcard is applied to the end of the filter string.
Chapter 3 System Administration
46 Teradata Viewpoint User Guide, Release 14.01](https://image.slidesharecdn.com/2206user14-01-130625135151-phpapp02/85/2206-user-14-01-46-320.jpg)


![OpDBA role access the Workload Monitor portlet to track Teradata Database request
arrivals and completions.
About the Roles Manager View
The Roles Manager view allows the Teradata Viewpoint Administrator to manage roles
efficiently, including assigning users to roles, and granting permissions to roles. After a role
is created, you can customize the role using the following tabs:
General
Enable or disable a role, and select the systems available to that role.
Users
Search for users and add them to, or remove them from, the list of users assigned to
the selected role.
Portlets
Enable or disable portlets for a role. This tab can also be used to configure default
settings per portlet, per role.
Notifications
Enable or disable notifications for a role. The notifications appear in the Teradata
Viewpoint portal.
Metrics
Select the metrics to display per metric, per system.
Permissions
Control whether users in this role can set their own preferences and share
customized versions of the portlet with other users, and configure which portlet
features the role can access.
Note: The SET PREFS check box is only available for portlets that have a
PREFERENCES view.
Adding a Role
You can add a role and assign one or more Teradata Database systems to the role.
1 From the Roles Manager view, click Add Role.
An Add role dialog box appears with the General tab selected (default).
2 Under Name, enter a new name for the role, up to 25 characters.
You can use alphanumeric characters and underscore (_), but no space.
3 Under Description, use the default or enter a new description, up to 255 characters.
4 [Optional] Under Role State, do one of the following:
• Leave the Role State as is.
Chapter 3 System Administration
Teradata Viewpoint User Guide, Release 14.01 49](https://image.slidesharecdn.com/2206user14-01-130625135151-phpapp02/85/2206-user-14-01-49-320.jpg)
![• Select Enabled to enable the role for configuration and adding users, and activate the
role for use with Teradata Viewpoint.
• Select Disabled to enable the role for configuration and adding users, but disable the
role for use with Teradata Viewpoint.
5 [Optional] Under Rewind State, do one of the following:
• Leave the Rewind State as is.
• Select Enabled to grant permission to this role to use the rewind feature, when
available.
• Select Disabled to deny permission for this role to use the rewind feature.
6 [Optional] Under Shared Page Administration State, do one of the following:
• Leave Shared Pages Administration State as is.
• Select Enabled to grant permission to this role to administer shared pages.
• Select Disabled to deny permission for this role to administer shared pages.
7 [Optional] Under Enable Systems For Role, do one of the following:
• Leave the currently selected Teradata Database systems as is.
• Select new Teradata Database systems the selected role is authorized to access.
• Click the Enable Systems For Role column heading to select all check boxes for the
Teradata Database systems.
Note: You can click the column heading again to clear all check boxes.
Editing a Role
You can edit a role, but you cannot change the name of an existing role. To change the name,
you must either add a new role or copy the role, and then change the role name.
1 From the Roles Manager view, select a role from the list.
A dialog box appears with the current information for the selected role.
2 Under Description, use the default or enter a new description, up to 255 characters.
3 [Optional] Under Role State, do one of the following:
• Leave the Role State as is.
• Select Enabled to enable the role for configuration and adding users, and activate the
role for use with Teradata Viewpoint.
• Select Disabled to enable the role for configuration and adding users, but disable the
role for use with Teradata Viewpoint.
4 [Optional] Under Rewind State, do one of the following:
• Leave the Rewind State as is.
• Select Enabled to grant permission to this role to use the rewind feature, when
available.
• Select Disabled to deny permission for this role to use the rewind feature.
5 [Optional] Under Shared Page Administration State, do one of the following:
• Leave Shared Pages Administration State as is.
Chapter 3 System Administration
50 Teradata Viewpoint User Guide, Release 14.01](https://image.slidesharecdn.com/2206user14-01-130625135151-phpapp02/85/2206-user-14-01-50-320.jpg)
![• Select Enabled to grant permission to this role to administer shared pages.
• Select Disabled to deny permission for this role to administer shared pages.
6 [Optional] Under Enable Systems For Role, do one of the following:
• Leave the currently selected Teradata Database systems as is.
• Select new Teradata Database systems the selected role is authorized to access.
• Click the Enable Systems For Role column heading to select all check boxes for the
Teradata Database systems.
Note: You can click the column heading again to clear all check boxes.
Copying a Role
When a role is copied, all settings on all tabs are inherited from the original role, except for
the Name field on the General tab. When the Administrator role is copied, all information
on all tabs is copied. However, the copied role does not have administrative privileges and
does not have an Admin menu on the portal.
1 From the Roles Manager view, select a role from the list.
2 Click Copy Role.
A dialog box appears with the General tab selected.
3 Under Name, enter a new name for the role, up to 25 characters.
You can use alphanumeric characters and underscore (_), but no space.
4 Under Description, use the default or enter a new description, up to 255 characters.
5 [Optional] Under Role State, do one of the following:
• Leave the Role State as is.
• Select Enabled to enable the role for configuration and adding users, and activate the
role for use with Teradata Viewpoint.
• Select Disabled to enable the role for configuration and adding users, but disable the
role for use with Teradata Viewpoint.
6 [Optional] Under Rewind State, do one of the following:
• Leave the Rewind State as is.
• Select Enabled to grant permission to this role to use the rewind feature, when
available.
• Select Disabled to deny permission for this role to use the rewind feature.
7 [Optional] Under Shared Page Administration State, do one of the following:
• Leave Shared Pages Administration State as is.
• Select Enabled to grant permission to this role to administer shared pages.
• Select Disabled to deny permission for this role to administer shared pages.
8 [Optional] Under Enable Systems For Role, do one of the following:
• Leave the currently selected Teradata Database systems as is.
• Select new Teradata Database systems the selected role is authorized to access.
Chapter 3 System Administration
Teradata Viewpoint User Guide, Release 14.01 51](https://image.slidesharecdn.com/2206user14-01-130625135151-phpapp02/85/2206-user-14-01-51-320.jpg)
![• Click the Enable Systems For Role column heading to select all check boxes for the
Teradata Database systems.
Note: You can click the column heading again to clear all check boxes.
Deleting a Role
You can delete a role. After a role is deleted, it cannot be restored. This action affects all users
assigned to the role.
1 From the Roles Manager view, select a role from the list.
2 Click Delete Role.
A confirmation message appears.
3 Click OK.
The deleted role is removed from the list.
Assigning Users to a Role
You can search for users and assign them to a role.
If auto-provisioning is in use, a default role is automatically assigned to new users the first
time they log on. User is generally the default assignment.
1 From the Roles Manager view, select a role from the list.
2 Click the Users tab.
The users list appears and includes two panes. The left pane lists all Teradata Viewpoint
system users. The right pane lists users already assigned to the selected role. In the left
pane, the names of users already assigned to the selected role are dimmed.
3 [Optional] Search for a user:
a Select a filter from the list.
b Enter the search criteria in the contains field.
c Click Find.
The AVAILABLE USERS list displays only users meeting the search criteria.
4 Select one or more users from the left pane.
Press Ctrl while selecting additional names to select multiple users.
5 Click .
The selected users are assigned to the role. Selected user names are copied to the right
pane and are dimmed in the left pane.
6 Click Apply.
Chapter 3 System Administration
52 Teradata Viewpoint User Guide, Release 14.01](https://image.slidesharecdn.com/2206user14-01-130625135151-phpapp02/85/2206-user-14-01-52-320.jpg)


![Control Description
If selected, the shared pages display alphabetically as a group for each role
if a user has multiple roles. For example, the first group displays pages 1, 2,
and 3 for role A. the next group displays pages 1, 2, and 3 for role B.
The Shared Pages portlet controls, accessed from the Shared Pages portlet, are listed below.
Control Description
Edit Click a page name to edit the shared page. You can edit the page name,
description, tooltip, and other property controls. You cannot change roles
or portlets.
Delete Deletes the page from the Shared Pages portlet. Removes the page from
the Add Content menu for users in this role, and removes the mandatory
page from the portal when the user logs on or refreshes the page.
About Read-Only and Mandatory Shared Pages
You can restrict what a user can do by making a shared page read-only or mandatory.
Read-only prevents a user from adding portlets, or making changes to the content, layout or
name of the shared page. However, the user can add a page from the Add Content menu
and delete the page from the portal. Read-only pages can only be added once to the portal.
Mandatory pages are present in the user portal at all times. The restrictions are the same as
read-only pages, except the user cannot add a mandatory shared page from the Add
Content menu or delete the page from the portal.
When you update a read-only or mandatory shared page, the change is visible in the user
portal after the page is refreshed. Any changes the user made to the page are overwritten.
When a user is removed from a role, a read-only shared page remains in the portal until the
user deletes it. However, a mandatory shared page is removed from the portal when the user
logs on or refreshes the page.
Creating a Shared Page
Create a shared page when you want a role to use specific portlets, systems, and settings. The
page content displays with the permissions of the assigned role. You can add portlets and
change settings any time after you create a shared page. You must publish the shared page
for the user to see your changes.
1 In the portal task bar, click and select Add Shared Page.
2 Enter the new page name up to 30 characters.
Page names must be unique.
3 Select a role to assign to the page from the menu.
A role cannot be changed after you create a page. Only roles that you have permission to
see are displayed in the menu.
4 [Optional] Add a description up to 500 characters.
Chapter 3 System Administration
Teradata Viewpoint User Guide, Release 14.01 63](https://image.slidesharecdn.com/2206user14-01-130625135151-phpapp02/85/2206-user-14-01-63-320.jpg)
![The description appears in the Shared Pages portlet.
5 [Optional] Add a tooltip up to 100 characters.
The tooltip appears when the user mouses over the page name in the tab.
6 [Optional] Clear the Enable page check box to prevent users in this role from accessing
the non-mandatory page from the Add Content menu.
The Enable page check box is selected by default which adds the non-mandatory page to
the Add Content menu for this role after the page is published.
7 [Optional] Select the Read-only check box to prevent users in this role from adding
portlets, or making changes to the content, layout or page name of the shared page.
8 [Optional] Select the Mandatory check box to make the shared page present in the user
portal at all times.
9 [Optional] Select the Show first time user logs in check box to display the page the first
time a new Viewpoint user logs on.
10 Click OK.
The new page appears and becomes the active page.
11 Select one of the following:
Option Description
Role: role name Preview how the page appears to the user in the role for which the page was
created. You must publish with this option selected.
All my roles Preview how the page appears to a user with all my roles.
12 [Optional] Add portlets or change the portlet settings and preferences.
13 [Optional] Click in the page tab and select Publish to distribute your changes and add
the page to the Shared Pages portlet.
14 [Optional] Select the shared page from the Add Content menu to see a preview of how
the page appears to the user in the role.
15 [Optional] Click in the page tab and select Close to close the preview.
Copying a Shared Page
Copy a shared page when the majority of the page characteristics are applicable to another
role. For example, you can copy a shared page and change the portlet types, add more
portlets, and change systems or preferences for users in another role.
To change the role, you must copy a shared page, and then delete the old shared page.
1 Click the page name to make it the active page.
2 Click in the page tab and select Copy.
3 Enter the new page name up to 30 characters.
Page names must be unique.
4 Select a role to assign to the page from the menu.
Chapter 3 System Administration
64 Teradata Viewpoint User Guide, Release 14.01](https://image.slidesharecdn.com/2206user14-01-130625135151-phpapp02/85/2206-user-14-01-64-320.jpg)
![Only roles that you have permission to see are displayed in the menu.
5 [Optional] Add a description up to 500 characters.
The description appears in the Shared Pages portlet.
6 [Optional] Add a tooltip up to 100 characters.
The tooltip appears when the user mouses over the page name in the tab.
7 [Optional] Do one of the following:
• Select the Enable page check box to add the non-mandatory page to the Add
Content menu for users in this role after the page is published.
• Clear the Enable page check box to prevent users in this role from accessing the non-
mandatory page from the Add Content menu.
8 [Optional] Select the Read-only check box to prevent users in this role from adding
portlets, or making changes to the content, layout or page name of the shared page.
9 [Optional] Select the Mandatory check box to make the shared page present in the user
portal at all times.
10 [Optional] Select the Show first time user logs in check box to display the page the first
time a new Viewpoint user logs on.
11 Click OK.
The new page appears and becomes the active page.
12 Select one of the following:
Option Description
Role: role name Preview how the page appears to the user in the role for which the page was
created. You must publish with this option selected.
All my roles Preview how the page appears to a user with all my roles.
13 [Optional] Add portlets or change the portlet settings and preferences.
14 [Optional] Click in the page tab and select Publish to distribute your changes and add
the page to the Shared Pages portlet.
15 [Optional] Select the shared page from the Add Content menu to see a preview of how
the page appears to the user in the role.
16 [Optional] Click in the page tab and select Close to close the preview.
Editing Portlets on a Shared Page
Edit a shared page to add portlets or change portlet settings and preferences.
1 [Optional] If the shared page is not already in your portal, add the page from the Add
Content menu.
2 Click the page name to make it the active page.
3 Select one of the following:
Chapter 3 System Administration
Teradata Viewpoint User Guide, Release 14.01 65](https://image.slidesharecdn.com/2206user14-01-130625135151-phpapp02/85/2206-user-14-01-65-320.jpg)
![Option Description
Role: role name Preview how the page appears to the user in the role for which the page was
created. You must publish with this option selected.
All my roles Preview how the page appears to a user with all my roles.
4 [Optional] Add portlets or change the portlet settings and preferences.
5 [Optional] Click in the page tab and select Properties, and then enable the page.
6 [Optional] Click in the page tab and select Publish to distribute your changes and add
the page to the Shared Pages portlet.
7 [Optional] Select the shared page from the Add Content menu to see a preview of how
the page appears to the user in the role.
8 [Optional] Click in the page tab and select Close to close the preview.
Viewing All Shared Pages
You can view all the shared pages that have been created, including the page names, the
portlets on a shared page, the role the page is assigned to, the date when the page was
created, the date when the page was last modified, the page description, and whether the
page is read-only, mandatory, first log on, or enabled.
1 From the Shared Pages portlet, view the specific attributes of a shared page.
2 [Optional] Click anywhere in the row to see the details for the page.
Deleting a Shared Page
Delete a shared page when there are many changes in portlets or systems for a role or when
the page is no longer useful.
Deleting a non-mandatory page removes the page from the Add Content menu for users in
this role. Deleting a mandatory shared page removes the page from the portal when the user
logs on or refreshes the page.
1 From the Shared Pages portlet, click located on the row of the page you want to
delete.
Teradata Systems
The Teradata Systems portlet allows the Teradata Viewpoint Administrator to add,
configure, enable, and disable systems using specific dialog boxes:
General
Configure the system nickname, TDPID, site ID, host ID, login credentials,
authentication method, and access to Teradata Database or Teradata Aster systems.
Test the connection and add or delete logins.
Chapter 3 System Administration
66 Teradata Viewpoint User Guide, Release 14.01](https://image.slidesharecdn.com/2206user14-01-130625135151-phpapp02/85/2206-user-14-01-66-320.jpg)

![1 Click next to SYSTEMS and select Add Teradata System.
2 Enter a SYSTEM NICKNAME, up to 8 characters.
3 [Optional] Select the System enable check box to activate the Teradata Database system
for monitoring.
4 Enter the TDPID of the Teradata Database system.
5 [Optional] Enter the SITE ID assigned by Teradata Customer Services.
You must enter the SITE ID for the Teradata system if you are using Elastic Performance
on Demand.
6 Enter a LOGIN name and password.
You also have the option to specify an account string, authentication, add more logins,
test that the login settings are correct, and grant access to a Teradata Database system.
7 [Optional] Click Test to verify that the logon settings are correct.
The icon appears if the operation is successful. The icon appears if the operation
fails; verify that the settings are correct, and try again.
8 [Optional] Select an AUTHENTICATION OPTIONS check box to specify which
authentication mechanisms will be available in the portlets that require them.
9 [Optional] In the CHARACTER SET section, select default character sets and enter a
JDBC Flag value.
• [Optional] Select a character set from the Session menu.
• [Optional] Select a character set from the Monitor menu.
• [Optional] Enter a JDBC Flag value.
10 [Optional] Select the COLLECTORS check box to activate all data collectors except
Elastic Limit, Elastic Usage, and Virtual Storage so they can collect data points on this
system.
The data collectors can be enabled and configured individually in Data Collectors. The
Elastic Performance portlet uses the Elastic Limit and Elastic Usage data collectors to
display data. The TVS Monitor portlet uses the Virtual Storage data collector to display
data.
11 Select the ENHANCED TASM FUNCTIONS check box to activate the workload
management features available with your TASM license in SLES 11.
Once enabled, the (For SLES 11 systems only) comment no longer displays.
12 Click Apply.
The icon appears if the operation is successful. The icon appears if the operation
fails; verify that the settings are correct, and try again.
Adding a Teradata Aster System
You can add a Teradata Aster system to Teradata Viewpoint. The system must be added and
the logins created before you can configure the data collectors to monitor the database.
1 Click next to SYSTEMS and select Add Aster System.
2 Enter a SYSTEM NICKNAME, up to 8 characters.
Chapter 3 System Administration
68 Teradata Viewpoint User Guide, Release 14.01](https://image.slidesharecdn.com/2206user14-01-130625135151-phpapp02/85/2206-user-14-01-68-320.jpg)
![3 [Optional] Select the Enable system check box to activate the system for monitoring.
4 Enter the HOST ID of the Teradata Aster system.
5 [Optional] Enter the SITE ID assigned by Teradata Customer Services.
6 Enter a LOGIN name and password.
7 [Optional] Click Test to verify that the logon settings are correct.
The icon appears if the operation is successful. The icon appears if the operation
fails; verify that the settings are correct, and try again.
8 [Optional] Select the COLLECTORS check box to activate Aster data collectors so they
can collect data points on this system.
The data collectors can be enabled and configured individually in Data Collectors.
9 Click Apply.
The icon appears if the operation is successful. The icon appears if the operation
fails; verify that the settings are correct, and try again.
Disabling a System
Disabling a system makes the system inaccessible in other Teradata Viewpoint portlets,
while maintaining the configured settings. You can enable the system as needed.
1 From the SYSTEMS list, click the name of the system you want to update.
2 From the SETUP list, click General.
3 Clear the Enable system check box.
4 Click Apply.
The icon appears if the operation is successful. The icon appears if the operation
fails; verify that the settings are correct, and try again.
Deleting a System
Deleting a system removes all information configured for that system, such as data
collectors, alerts, and canary queries.
1 From the SYSTEMS list, click the name of the system you want to update.
2 From the SETUP list, click General.
3 Click Delete System.
A confirmation message appears.
4 Click OK.
Adding a Login Account
An unlimited number of login credentials can be configured for use in the Teradata
Systems portlet dialog boxes.
The tdwm login is required to load and activate Workload Designer rulesets. The tdwm
login and authentication cannot be removed or renamed, but you can enter a password, an
account string, and test the tdwm login settings.
Chapter 3 System Administration
Teradata Viewpoint User Guide, Release 14.01 69](https://image.slidesharecdn.com/2206user14-01-130625135151-phpapp02/85/2206-user-14-01-69-320.jpg)
![1 From the SYSTEMS list, click the name of the system you want to update.
2 From the SETUP list, click General.
3 Under LOGIN, click .
4 Enter a LOGIN name and password.
You also have the option to specify an account string, select an authentication
mechanism, add more logins, test that the login settings are correct, and grant access to a
Teradata Database system.
5 Click Apply.
The icon appears if the operation is successful. The icon appears if the operation
fails; verify that the settings are correct, and try again.
Granting Privileges
Granting privileges provides Viewpoint data collectors with access to Teradata Database
system resources.
1 From the SYSTEMS list, click the name of the system you want to update.
2 From the SETUP list, click General.
3 In the LOGIN section, click Grant for the user to be granted privileges.
4 Select a Version, if no Teradata Database system version is found.
Listed privileges may vary depending on version selected.
5 [Optional] Copy the SQL.
You can execute the SQL using an external tool.
6 Click Continue.
7 Enter login information to authenticate the Teradata user.
The user must be authorized to grant privileges.
8 Click Run.
9 Review results and click OK.
Deleting a Login Account
At least one login account must be configured for a system. You cannot remove the last login
account or the tdwm login.
1 From the SYSTEMS list, click the name of the system you want to update.
2 From the SETUP list, click General.
3 Under LOGIN, click on the login row to be removed.
The row disappears. The login is removed permanently.
Adding Portlet Authentication Options
Some Viewpoint portlets require authentication to access Teradata Database to change the
priority of a query. You can enable authentication options for Viewpoint portlets in addition
to the default Teradata Database logon option.
Chapter 3 System Administration
70 Teradata Viewpoint User Guide, Release 14.01](https://image.slidesharecdn.com/2206user14-01-130625135151-phpapp02/85/2206-user-14-01-70-320.jpg)

![Viewing System Status
You can investigate the details of a system that is disabled or functioning with errors. Each
level provides additional icons that represent system status.
1 From the SYSTEMS list, click the system whose name appears with one of the following
icons:
Icon Description
Error Appears next to a system name or data collector name when one of these errors has
been detected:
• Processing exception
• Incorrect system privileges
• Configuration errors, such as an incorrect password
• System is offline
Disabled Appears next to a system name or data collector name if it is currently disabled.
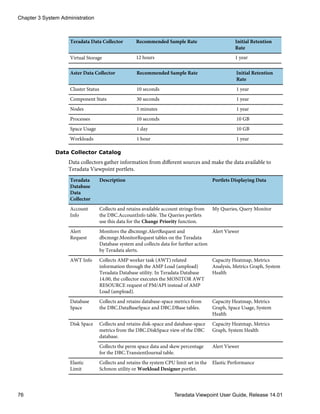
Data Collectors
The Teradata Viewpoint Data Collection Service (DCS) is used to monitor systems. After a
system has been configured in Teradata Viewpoint, data collectors can be configured to
monitor the system. Data collectors gather information from different sources and make the
data available to Teradata Viewpoint portlets. Each data collector has a sample rate, or
frequency, used to collect data from the system and a retention rate used to keep the
collected data for a time period or up to a certain size.
Most data collectors have similar behaviors as described in the data collector catalog, but a
few are unique:
• Alert Request has no retention rate because this data collector does not store data.
• Sessions collects SQL and Explain data when thresholds are met in the session.
• Sessions defines values to use when a Lower Priority action executes for an alert in the
session.
• Elastic Usage can automatically upload usage data to Teradata Service Connect.
Configuring Data Collectors
After a system has been configured in Teradata Viewpoint, data collectors can be configured
to monitor the database. Sessions and Elastic Usage data collectors have other options to
configure.
The login values used by data collectors are established in the General view.
1 From the SYSTEMS list, click the name of the system you want to update.
2 From the SETUP list, click Data Collectors.
3 Click the data collector name you want to configure.
4 [Optional] Select the Enable data collector name Collector check box to enable the data
collector to begin processing data.
5 Under LOGIN, select the login you want to use to run the system task.
Chapter 3 System Administration
72 Teradata Viewpoint User Guide, Release 14.01](https://image.slidesharecdn.com/2206user14-01-130625135151-phpapp02/85/2206-user-14-01-72-320.jpg)


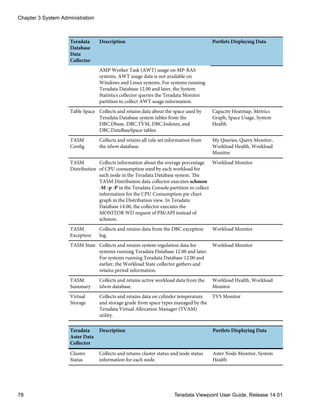

![Configuring System Health Values
You can define threshold values for your system status calculation.
1 From the SYSTEMS list, click a system name.
2 From the SETUP list, click System Health.
3 Under THRESHOLDS, select one of the following options for each metric:
Option Description
Enabled Makes the metric visible in the System Health portlet. Uses the threshold values in
the system status calculation.
Disabled Omits the metric in the System Health portlet. Does not use threshold values in the
system status calculation.
View Only Makes the metric visible in the System Health portlet. Does not use threshold
values in the system status calculation.
4 Adjust the degraded or critical thresholds for each metric.
5 [Optional] If CPU or I/O skew metrics are Enabled, do one of the following:
• Select the CPU or I/O skew qualification check box and specify a threshold.
If the system CPU is below the defined threshold, the skew metric is excluded from
the system health calculation. The metric displays in the System Health portlet as
View Only.
• Clear the CPU or I/O skew qualification check box to include the skew metric in the
system health calculation, regardless of system CPU.
6 Click Apply.
System Health Metrics
You can enable the metrics and thresholds that appear in the System Health and
Productivity portlets. Available metrics and the portlets in which the data appears differs
depending on the type of system you choose.
Teradata Database System Metrics
System Metrics
Metric Description
Active Sessions Number of sessions with active queries
AMP CPU Skew Comparison of CPU use on the busiest AMP to the average AMP
AMP I/O Skew Comparison of disk use on the busiest AMP to the average AMP
AMP Worker Tasks Average number of AMP worker tasks in use on each AMP
Component Down Number of components, such as BYNETs or AMPs, that are down
(CPU) System Average percentage of CPU time spent in system (kernel) mode
(CPU) User Average percentage of CPU time spent in user mode
Chapter 3 System Administration
80 Teradata Viewpoint User Guide, Release 14.01](https://image.slidesharecdn.com/2206user14-01-130625135151-phpapp02/85/2206-user-14-01-80-320.jpg)
![appear in the System Health and Productivity portlets. For Teradata Aster systems, these
changes appear only in the System Health portlet.
1 From the SYSTEMS list, click the system name.
2 From the SETUP list, click System Health.
3 Under Status and Tooltips, select Enable custom status.
4 Change the status and tooltip definitions for your system.
5 [Optional] Click at the end of the tooltip to restore the default definition.
6 Click Copy.
Copying System Health Settings Between Systems
You can copy the custom status, tooltips, and threshold settings to other compatible systems.
You cannot copy canary query threshold settings to other systems.
Note: All copied settings overwrite the target system settings.
1 From the SYSTEMS list, click the source system name.
2 From the SETUP list, click next to System Health.
3 [Optional] Select Copy status and tooltips check box to copy your custom status.
4 [Optional] Select Copy thresholds check box to copy your threshold settings, except
canary queries.
5 Select target systems.
6 Click Copy.
Canary Queries
After a Teradata Database system is configured in Teradata Viewpoint, the System Heartbeat
canary query checks the responsiveness of the system. You can also create user-defined
canary queries that gather and retain data to display in the Canary Response Times,
Productivity, and System Health portlets. Canary queries are not data collectors.
Adding or Copying a Canary Query
1 From the SYSTEMS list, click the name of the Teradata Database system you want to
update.
2 From the SETUP list, click Canary Queries.
3 Do one of the following:
Option Description
Add Click to add a canary query.
Copy Click in the row of the canary query you want to copy.
4 Enter a name for the canary query.
5 [Optional] Select the Enabled check box to enable the canary query.
Chapter 3 System Administration
82 Teradata Viewpoint User Guide, Release 14.01](https://image.slidesharecdn.com/2206user14-01-130625135151-phpapp02/85/2206-user-14-01-82-320.jpg)
![6 Under SQL, enter or modify the query SQL code.
7 Under DEFAULT DATABASE, specify the default database.
8 Under LOGIN, select the login you want to use to run the system task.
a [Optional] Select the Log in each time the query executes check box to force a new
logon connection to the Teradata system each time that the query runs.
b [Optional] Enter a timeout value. The value indicates the number of seconds before
abandoning the attempt to log on to the Teradata system.
Enter a value only if you selected the Log in each time the query executes check box.
You cannot add an alert action for a logon timeout for a System Heartbeat canary
query.
9 Under COLLECT DATA, specify the data collection frequency in seconds.
The recommended sample rate is 2 minutes. The retention rate is one year.
10 Under EXECUTE, select one of the following options:
Option Description
24/7 a. Select 24/7 to execute the query 24 hours a day, 7 days a week.
Custom a. Select Custom to execute the query during a time range.
b. Specify the start time and end time.
c. Specify the start day and end day.
11 Under DELETE DATA, select one of the following options:
Option Description
Date a. Select the After check box to set the calendar retention period.
b. Enter a number and select a calendar value.
Size a. Select the Over check box to set the file size retention period.
b. Enter a number and select a file size restriction.
12 Click Apply.
The icon appears if the operation is successful. The icon appears if the operation
fails; verify that the settings are correct, and try again.
Deleting a Canary Query
SYSTEM HEARTBEAT is a canary query that cannot be deleted. It is used to check
whether the Teradata Database system is responsive.
1 From the SYSTEMS list, click the name of the system you want to update.
2 From the SETUP list, click Canary Queries.
3 Click in the row of the canary query you want to delete.
A confirmation message appears.
4 Click OK.
Chapter 3 System Administration
Teradata Viewpoint User Guide, Release 14.01 83](https://image.slidesharecdn.com/2206user14-01-130625135151-phpapp02/85/2206-user-14-01-83-320.jpg)


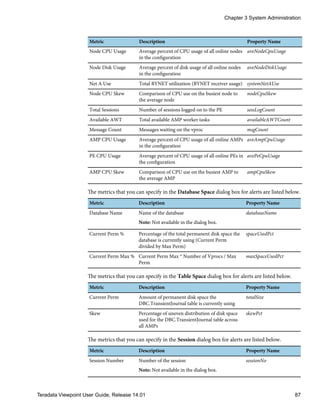


![Metric Description Property Name
Memory Memory used on the node memUse
Network In Rate of network traffic into the node in bytes per
second
netIn
Network Out Rate of network traffic out of the node in bytes
per second
netOut
Disk In Rate of disk traffic into the node in bytes per
second
diskWrite
Disk Out Rate of disk traffic out of the node in bytes per
second
diskRead
% Disk Full Percent of used disk space on the node. Includes
user data, replica data, and system data
percentFull
The metrics that you can specify in the Process dialog box for alerts are listed below.
Metric Description Property Name
User Name of the user who submitted the process userName
Database Name of the database on which the process ran dbName
Duration How long the process ran processExecutionTime
Migrating Alerts
After a Teradata Database system has been configured in Teradata Viewpoint, all of the alerts
except event alerts can be migrated from Teradata Manager to Teradata Viewpoint.
Configured rates cannot be migrated. You must configure data collection rates in Teradata
Viewpoint.
Alerts can only be migrated when there are no alerts in Teradata Viewpoint for a Teradata
Database system; therefore, migrate existing Teradata Manager alerts before adding and
copying alerts.
1 From the SYSTEMS list, click the name of the system you want to update.
2 From the SETUP list, click Alerts.
3 From the ALERT TYPES list, click an alert type.
4 Under ALERTS, click Migrate Alerts.
5 Enter the log on information for an account that has permission to read data from the
migrating database.
6 Select an Authentication Mechanism for the migrating database.
7 [Optional] Under SNMP Config, select the SNMP configuration that you assigned to any
migrated action sets containing an SNMP action.
This is required when the alert actions being migrated contain any SNMP actions. The
SNMP configurations are defined in the Alert Setup portlet.
8 Click Apply.
A message appears in the dialog box with the number of alerts that were migrated.
Chapter 3 System Administration
90 Teradata Viewpoint User Guide, Release 14.01](https://image.slidesharecdn.com/2206user14-01-130625135151-phpapp02/85/2206-user-14-01-90-320.jpg)
![Adding and Copying Alerts
After you configure a system in Teradata Viewpoint, you can add an alert. Available alert
types differ depending on the type of system you choose.
Because you can only migrate alerts when no alerts currently exist in Teradata Viewpoint
for a Teradata Database system, migrate existing Teradata Manager alerts before adding and
copying alerts.
1 From the SYSTEMS list, click the name of the system you want to update.
2 From the SETUP list, click Alerts.
3 From the ALERT TYPES list, click an alert type.
4 From the ALERTS list, do one of the following:
• Click to add an alert.
• Click in the row of the alert you want to copy.
• Click the name of the alert you want to edit.
5 Enter a name for the alert.
6 [Optional] Select the Enabled check box to enable the alert.
7 Under Alert Rules, do the following:
Alert Type Trigger
• System
• Node
• Process
• Vproc
• Canary
Queries
a. Select a scope to apply to the defined rules.
• All applies all of the defined alert rules.
• Any applies one defined alert rule, depending on which rule first
meets criteria in the definition.
b. Select a metric from the list and enter a threshold value.
You can add or remove rules.
c. [Optional] Enter the number of minutes in the Only trigger if alert
rule(s) are met for box.
The alert triggers if the rule is true for the number of minutes that you
entered.
• Session a. Select a scope to apply to the defined rules.
• All applies all of the defined alert rules.
• Any applies one defined alert rule, depending on which rule first
meets criteria in the definition.
b. Select a metric from the list and enter a threshold value.
If you set up an alert rule whose only condition is Sessions per User, only
userName and sessionsForUser metrics are available when customizing
Teradata Alerts alert actions.
You can add or remove rules.
c. [Optional] Enter the name of one or more users to exclude from
receiving the alert.
Chapter 3 System Administration
Teradata Viewpoint User Guide, Release 14.01 91](https://image.slidesharecdn.com/2206user14-01-130625135151-phpapp02/85/2206-user-14-01-91-320.jpg)
![Alert Type Trigger
You can add or remove users.
• Database
Space
a. [Optional] Select the scope of databases that the alert rule applies to.
• All databases includes all databases.
• All databases except excludes one or more databases that you specify.
• Only include databases includes one or more databases that you
specify.
You can add or remove databases from the scope.
b. Select a metric from the menu and enter a threshold value.
The alert triggers if the metric exceeds the value that you enter.
• Table Space a. [Optional] Enable and enter a value for one or more of the following for
the DBC.TransientJournal table:
• Current Perm is the amount of total permanent disk space the table
is currently using.
• Skew is the percentage of uneven distribution of disk space used for
the table across all AMPs.
The alert triggers if the metric exceeds the value that you entered.
• System
Health
a. Select a health level from the Trigger if system health is this level or
worse list.
b. [Optional] Enter the number of minutes in the Only trigger if alert
rule(s) are met for box.
The alert triggers if the rule is true for the number of minutes that you
entered.
• Data
Collectors
a. Select one or more data collectors from the Available box.
b. Click to move them to the Selected box.
The alert triggers if any errors are encountered by the DCS for the
selected data collectors.
8 Under Alert Action, do the following:
a Select an alert action from the list.
b Enter a limit for Do not run twice in a number of minutes.
The alert action does not run twice during the minutes that you entered. The alert
action does not run more frequently than the data collector SAMPLE RATE.
c [Optional] For session alerts only, select one of the following check boxes:
• Abort Session
This aborts the Teradata Database session after performing the selected alert
action.
• Lower Priority
Chapter 3 System Administration
92 Teradata Viewpoint User Guide, Release 14.01](https://image.slidesharecdn.com/2206user14-01-130625135151-phpapp02/85/2206-user-14-01-92-320.jpg)
![This modifies the priority level for the Teradata Database session while
performing the selected alert action. The priority level is configured in the Session
data collector under New priority for Lower Priority action.
9 Under Severity, select a severity from the menu.
10 [Optional] Under Message, enter a message that appears when the alert action executes.
11 Click Apply.
The icon appears if the operation is successful. The icon appears if the operation
fails; verify that the settings are correct, and try again.
Copying Alerts Between Systems
You can copy all alerts, except canary query alerts, from one system to another compatible
system.
Note: Alerts with duplicate names are overwritten in the target system.
1 From the SYSTEMS list, click the system from which you want to copy alerts.
2 From the SETUP list, click next to Alerts.
3 Do one of the following:
• Select a target system.
• Select multiple target systems with Shift or Ctrl.
4 Click Copy.
Deleting Alerts
An alert can be deleted any time after it has been added to a system.
1 From the SYSTEMS list, click the name of the system you want to update.
2 From the SETUP list, click Alerts.
3 From the ALERT TYPES list, click an alert type.
4 Under ALERTS, select the alert name.
5 Click in the row of the alert you want to delete.
A confirmation message appears.
6 Click OK.
The alert row disappears.
Monitor Rates
After a Teradata system has been configured in Viewpoint, you can set Teradata Database
internal sample rates for sessions, node/vproc collection, and node/vproc logging. These
rates determine how often PM/API data are refreshed. Note the following when setting
rates:
Chapter 3 System Administration
Teradata Viewpoint User Guide, Release 14.01 93](https://image.slidesharecdn.com/2206user14-01-130625135151-phpapp02/85/2206-user-14-01-93-320.jpg)

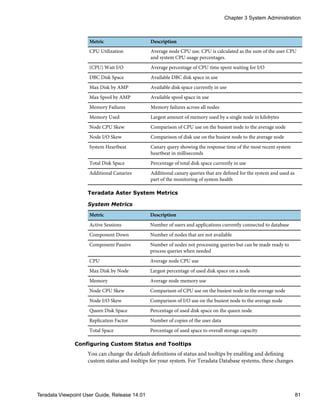
![Log Table Clean Up
You can configure log table clean up to remove unnecessary information and reallocate
space in Teradata Database. After you enable the clean up process for a table and configure
the retention period, you must set the time of the clean up schedule. The clean up process
permanently deletes data and does not archive it.
Configuring Log Table Clean Up
1 From the SYSTEMS list, click the name of the system you want to update.
2 From the SETUP list, click Log Table Clean Up.
3 From the TABLES list, click a table.
4 [Optional] Under Settings for table name , do one of the following:
• Select the Enabled check box to activate clean up and include the table in the clean
up schedule.
• Clear the Enabled check box to disable clean up and exclude the table from the clean
up schedule.
5 Under LOGIN, select the user you want to run the clean up task.
6 Under CLEAN UP, set the retention period using a number and calendar value.
7 Click Apply.
Clean Up Tables
The following clean up processes delete the associated system log tables:
Clean Up Process Name System Log Table Name
DBQ Log • DBC.DBQLSummaryTbl
• DBC.DBQLStepTbl
• DBC.DBQLogTbl
• DBC.DBQLObjTbl
• DBC.DBQLExplainTbl
• DBC.DBQLSqlTbl
Resource Usage • DBC.ResUsageSpma
• DBC.ResUsageSvpr
• DBC.ResUsageShst
• DBC.ResUsageIpma
• DBC.ResUsageIvpr
• DBC.ResUsageScpu
• DBC.ResUsageSldv
• DBC.ResUsageSawt (12.0 and later)
• DBC.ResUsageSps (12.0 and later)
• DBC.ResUsageSpdsk (12.0 and later)
• DBC.ResUsageSvdsk (12.0 and later)
• DBC.ResUsageSobj (V2R6 only)
Event Log • DBC.EventLog
Chapter 3 System Administration
Teradata Viewpoint User Guide, Release 14.01 95](https://image.slidesharecdn.com/2206user14-01-130625135151-phpapp02/85/2206-user-14-01-95-320.jpg)
![Clean Up Process Name System Log Table Name
TDWM • DBC.TDWMSummaryLog
• DBC.TDWMEventLog
• DBC.TDWMExceptionLog
SW Event Log • DBC.SW_Event_Log
Access Log • DBC.AccLogTbl
Clean Up Schedule
After the log table clean up has been configured for Teradata Database, you can set a
schedule. The schedule sets the time to delete all log tables that have been enabled for the
clean up process. The clean up process permanently deletes data and does not archive it.
Scheduling Log Table Clean Up
1 From the SYSTEMS list, click the name of the system you want to update.
2 From the SETUP list, click Clean Up Schedule.
3 [Optional] Under Clean Up Scheduler, do one of the following:
• Select the Enabled check box to activate the clean up schedule.
• Clear the Enabled check box to disable the clean up schedule.
4 Under LOGIN, select the user you want to collect the current time and Teradata
Database version.
5 Under DELETE TIME, enter a time at which the clean up task is run on the Viewpoint
server by the DCS.
Current Teradata Time shows your information, or Unknown shows that a connection
to Teradata Database cannot be made.
6 Click Apply.
Disk Usage
You can view disk usage over time and the distribution of data on the Teradata Viewpoint
server. The sparkline and graph provide different aspects of the data.
Graphics Description
Sparkline Shows 3 months of data. Information balloons show detailed data about
a point in time.
Graph Shows how the space used by the Teradata Viewpoint server is divided
among systems and their data collectors. Mouse over or click the system
boxes in the graph to see detailed disk space and data collector
information. If a system contains a region that is not associated with a
collector, the information balloon displays Unknown and the amount of
data space.
Chapter 3 System Administration
96 Teradata Viewpoint User Guide, Release 14.01](https://image.slidesharecdn.com/2206user14-01-130625135151-phpapp02/85/2206-user-14-01-96-320.jpg)
![Viewing Disk Usage
1 Under SYSTEMS, click Disk usage.
2 [Optional] Mouse over the sparkline and graph to activate the information balloons and
see detailed information.
3 [Optional] Click a system box in the graph to view the disk usage for each data collector
on that system.
4 [Optional] Click the collector name in the graph to see the corresponding configuration
dialog box.
User Manager
The User Manager portlet allows the Teradata Viewpoint Administrator to view and
manage Teradata Viewpoint user accounts so that you can add usernames, modify user
accounts, assign roles, reset passwords, and export data. Each portal username must be
unique. You must have Teradata Viewpoint Administrator permission to access the User
Manager portlet.
About the User List View
The User List view displays a list of all Teradata Viewpoint system users by FIRST NAME,
LAST NAME, PORTAL USER NAME, EMAIL, and LAST LOGIN for each user.
You can view, select, and search for individual user details; add Teradata Viewpoint user
accounts, and export data. You can resize the column width or sort the contents of a column
alphabetically.
Searching for a User
You can search for an existing Teradata Viewpoint user, resize columns, and sort the
information in the columns.
1 From the User List view, click the Find Users list.
2 Select a search method from the list.
3 In the contains field, enter the search criterion.
4 Click Find.
Users with information matching the search criterion are listed in the search results.
5 [Optional] Drag the column border in either direction to resize the column.
6 [Optional] Sort on a column by clicking the column header.
Adding a User
Each portal username must be unique to avoid being logged off when someone logs on with
the same username, such as Administrator.
Chapter 3 System Administration
Teradata Viewpoint User Guide, Release 14.01 97](https://image.slidesharecdn.com/2206user14-01-130625135151-phpapp02/85/2206-user-14-01-97-320.jpg)
![If your Teradata Viewpoint portal is configured to use auto-provisioning, a user account is
created automatically the first time a user logs on. Auto-provisioning validates portal
usernames with the LDAP directory and assigns the default role and email domain.
1 From the User List view, click Add User.
2 Enter the portal username for the user account.
3 Enter the first name, last name, and email address for the user account.
4 Choose an authentication method:
• Select the Externally Authenticated check box to authenticate the selected user from
an external source, such as LDAP.
• Clear the Externally Authenticated check box to authenticate the selected user from
the Teradata Viewpoint internal database.
5 [Optional] In the Password field, enter a preliminary password for the user account.
Externally authenticated passwords are stored in the external source, such as LDAP, and
validated from that source.
6 In the Re-enter Password field, enter the password again, exactly as it was entered
previously.
7 Click Apply.
Exporting Table Data
You can export data to a .csv file for further analysis and formatting. The exported .csv file
contains all available data. If filters are used, only filtered data is exported. The format for the
time, date, and some numeric values differs in the view and exported .csv file.
1 Click in the table header and select Export.
2 Save the file using the browser options.
The file is saved to your download area or to a location that you specify, depending on
the browser settings.
About the User Details View
The user details view allows you to delete a user, edit Teradata Viewpoint user accounts, and
manage roles assigned to users.
The following tabs are available in this view:
General
Displays the selected portal username, first name, last name, email address, whether
the user is externally authenticated, and the last time the user logged into Viewpoint.
Roles
Displays the available and assigned roles with role precedence for the selected user.
Chapter 3 System Administration
98 Teradata Viewpoint User Guide, Release 14.01](https://image.slidesharecdn.com/2206user14-01-130625135151-phpapp02/85/2206-user-14-01-98-320.jpg)

![Editing a User
You can edit a Teradata Viewpoint user account, except the portal username. The username
is defined when the user account is created using the User Manager portlet or it is stored in
LDAP when the user is externally authenticated.
1 From the User List view, browse the list of users or click Find Users to perform a search.
2 Click a user's name.
The General tab appears and displays information about the selected user.
3 [Optional] Change the first name, last name, or email address for the user account.
4 Choose an authentication method:
• Select the Externally Authenticated check box to authenticate the selected user from
an external source, such as LDAP.
• Clear the Externally Authenticated check box to authenticate the selected user from
the Teradata Viewpoint internal database.
5 [Optional] Change the password:
a Select the Change Password check box.
b In the Password field, enter the password.
c In the Re-enter Password field, enter the password exactly as it was entered
previously.
If Externally Authenticated is selected, the Change Password check box and related
password fields are unavailable, and the password must be changed in the external
source.
6 Click Apply.
Changing a User Password
You can change a Teradata Viewpoint user password except if Externally Authenticated is
selected. When the Change Password check box and related password fields are unavailable,
and the password must be changed in the external source.
1 From the User List view, browse the list of users or click Find Users to perform a search.
2 Click a user's name.
The General tab appears and displays information about the selected user.
3 Select the Change Password check box.
The Password and Re-enter Password fields change color.
4 In the Password field, enter a password.
5 In the Re-enter Password field, enter the password again, exactly as it was entered
previously.
6 Click Apply.
Chapter 3 System Administration
100 Teradata Viewpoint User Guide, Release 14.01](https://image.slidesharecdn.com/2206user14-01-130625135151-phpapp02/85/2206-user-14-01-100-320.jpg)
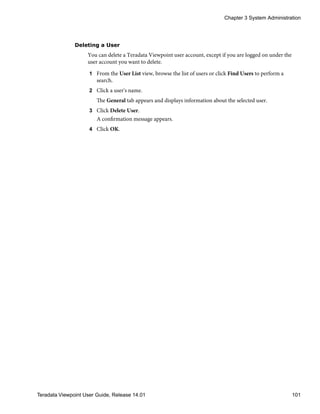


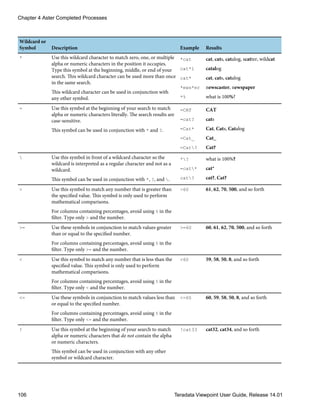
![Clearing Filters
You can clear the filter box values from the table.
1 Do one of the following:
Option Description
Clear
individual
filter boxes
a. Click on the filter box.
Clear all
filter boxes
a. Select Clear Filters at the bottom of the portlet.
Configuring Columns to Display
Use the Columns dialog box to select, lock, and order columns. You can resize columns in
the table.
1 Click in the table header and select Configure Columns.
2 In the Columns dialog box, select the check boxes of columns to display.
Mouse over the name to see the complete name.
3 [Optional] Click next to the column name.
The columns at the top of the list can be locked in the table to remain on the left when
scrolling horizontally.
4 [Optional] Click and drag the row to reorder the column.
5 Click Apply to save the changes.
6 [Optional] In the table, drag the column heading border in either direction to resize
the column.
Exporting Table Data
You can export data to a .csv file for further analysis and formatting. The exported .csv file
contains all available data. If filters are used, only filtered data is exported. The format for the
time, date, and some numeric values differs in the view and exported .csv file.
1 Click in the table header and select Export.
2 Save the file using the browser options.
The file is saved to your download area or to a location that you specify, depending on
the browser settings.
State Icons
The following symbols appear in the Aster Completed Processes portlet:
Chapter 4 Aster Completed Processes
Teradata Viewpoint User Guide, Release 14.01 107](https://image.slidesharecdn.com/2206user14-01-130625135151-phpapp02/85/2206-user-14-01-107-320.jpg)
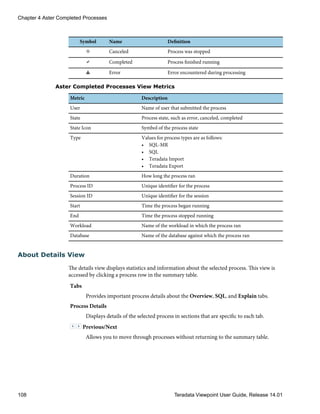


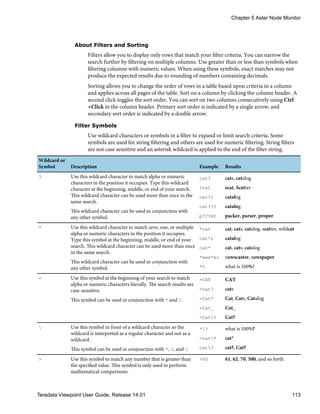

![3 [Optional] Click next to the column name.
The columns at the top of the list can be locked in the table to remain on the left when
scrolling horizontally.
4 [Optional] Click and drag the row to reorder the column.
5 Click Apply to save the changes.
6 [Optional] In the table, drag the column heading border in either direction to resize
the column.
Exporting Table Data
You can export data to a .csv file for further analysis and formatting. The exported .csv file
contains all available data. If filters are used, only filtered data is exported. The format for the
time, date, and some numeric values differs in the view and exported .csv file.
1 Click in the table header and select Export.
2 Save the file using the browser options.
The file is saved to your download area or to a location that you specify, depending on
the browser settings.
State Icons
The following icons appear in the ASTER NODE MONITOR portlet:
Icons Name Definition
Active Node is online and available to process data
Cleaning Node is being cleared of all data
Failed Node is offline and not participating in the nCluster
Installing Node is being added to a cluster
New Node recently added to the system
Passive Node holds copies of virtual worker data
Prepared Node is ready to be incorporated in the cluster and
can host a virtual worker
Preparing Node is preparing to host a virtual worker
Stopped Node is powered down
Unknown Node is not registered
Aster Node Monitor Metrics
Metric Description
% Full Percent of disk space used on the node
CPU Node CPU use
Disk In Rate of disk writes in bytes per second
Chapter 5 Aster Node Monitor
Teradata Viewpoint User Guide, Release 14.01 115](https://image.slidesharecdn.com/2206user14-01-130625135151-phpapp02/85/2206-user-14-01-115-320.jpg)

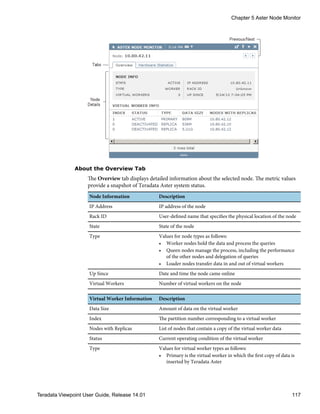


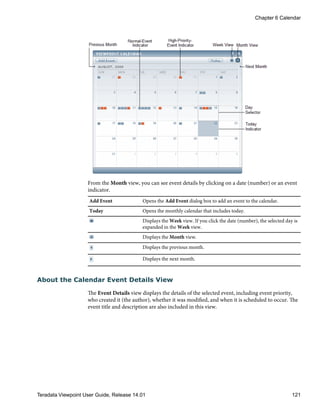
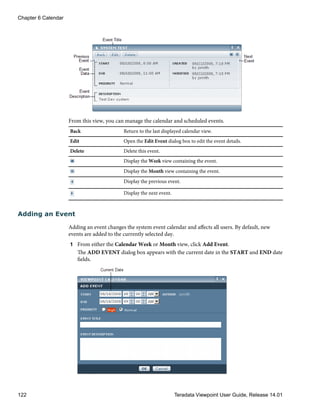
![2 Set the START date:
a Click inside the START date field.
A pop-up calendar appears.
b Click or to navigate to the appropriate month.
c Select the date from the pop-up calendar.
3 Set the END date.
4 Select the event START and END times from the list.
5 Select AM (morning) or PM (afternoon) from the list.
6 Select a priority:
• Normal
• High
7 Enter the EVENT TITLE.
8 [Optional] Enter the event DESCRIPTION.
9 Click OK.
Editing an Event
Editing an event changes the event instance affecting all users.
1 From either the Calendar Week or Month view, select the event you want to edit.
The event details view appears.
2 Click Edit.
The EDIT EVENT dialog box appears, showing event details.
3 Set the START date:
Chapter 6 Calendar
Teradata Viewpoint User Guide, Release 14.01 123](https://image.slidesharecdn.com/2206user14-01-130625135151-phpapp02/85/2206-user-14-01-123-320.jpg)
![a Click inside the START date field.
A pop-up calendar appears.
b Click or to navigate to the appropriate month.
c Select the date from the pop-up calendar.
4 Set the END date.
5 Select the event START and END times from the list.
6 Select AM (morning) or PM (afternoon) from the list.
7 Select a priority:
• Normal
• High
8 Enter the EVENT TITLE.
9 [Optional] Enter the event DESCRIPTION.
10 Click OK.
Deleting an Event
Deleting an event removes the event instance from the database and affects all users.
1 From either the Calendar Week or Month view, select the event you want to delete.
2 In the Event Details view, click Delete.
A confirmation message appears.
3 Click OK.
Chapter 6 Calendar
124 Teradata Viewpoint User Guide, Release 14.01](https://image.slidesharecdn.com/2206user14-01-130625135151-phpapp02/85/2206-user-14-01-124-320.jpg)


![Metric
Default
Sparkline
Past Average
Line Description
System Heartbeat Curve Yes The predefined metric that is available for all systems. This is
the default canary query.
canary query name CQ Curve Yes Canary queries defined by the Teradata Viewpoint
Administrator appear on the Metrics tab.
About the Preferences View
The PREFERENCES view allows you to customize the portlet to monitor key metric trends
that are important to efficient operation of the system. You can select only one system to
monitor for each portlet instance.
From the portlet frame, click to access the PREFERENCES view and then use one or
more of the following tabs to customize your preferences.
System
Select a system to monitor.
Metrics
Select and organize metrics to monitor in the summary view. Drag metrics from a
list of all available metrics to the Preview pane where you can preview the results as
you go.
Settings
Define settings for the metrics selected for display. Set thresholds to highlight metric
values that are outside normal operating ranges. Set maximum vertical-axis ranges
to limit the range of values displayed for selected metrics.
Past Averages
Adjust the number of weeks of data points used to calculate the average value for
each displayed metric.
Selecting a System to Monitor
Use the System tab in the PREFERENCES view to select a Teradata Database system to
monitor. Only one system can be selected for each portlet instance.
1 From the portlet frame, click to access the PREFERENCES view.
2 Click the System tab.
3 [Optional] Click Clear Defaults to clear all user-defined default settings created for this
portlet.
4 Select a system from the list.
5 [Optional] Select the Use these settings as defaults check box to use the current settings
in all PREFERENCES tabs as the default configuration each time you add this portlet to
a portal page.
6 Click OK.
Chapter 7 Canary Response Times
Teradata Viewpoint User Guide, Release 14.01 127](https://image.slidesharecdn.com/2206user14-01-130625135151-phpapp02/85/2206-user-14-01-127-320.jpg)
![Selecting Metrics to Monitor
Use the Metrics tab in the PREFERENCES view to select and organize the metrics shown in
the summary view.
1 From the portlet frame, click to access the PREFERENCES view.
2 Click the Metrics tab.
The Preview pane uses sample data to show how metric rows are displayed in the
summary view.
3 [Optional] Click Clear Defaults to clear all user-defined default settings created for this
portlet.
4 Do any of the following to change the way metric rows are displayed:
• Add a metric row. Drag a metric from the Select metrics for display list to the
Preview pane.
• Remove a metric row. Click located on the metric row.
• Change metric row order. Drag a metric already in the Preview pane to a new
location in the pane (up or down).
Adding or removing metrics affects only the system currently selected, provided that the
metrics are available on that system.
5 [Optional] Select the Use these settings as defaults check box to use the current settings
in all PREFERENCES tabs as the default configuration each time you add this portlet to
a portal page.
6 Click OK.
Setting Metric Thresholds
Use the Settings tab in the PREFERENCES view to set the THRESHOLD and VERTICAL
AXIS RANGE values for the metrics selected for display. Only metrics selected using the
Metrics tab appear in the list of available metrics. Changes to the metrics affect only the
system currently selected, provided that the metrics are available on that system.
1 From the portlet frame, click to access the PREFERENCES view.
2 Click the Settings tab.
3 [Optional] Click Clear Defaults to clear all user-defined default settings created for this
portlet.
4 [Optional] Enter the THRESHOLD setting for each available metric.
The threshold line does not appear in the view when the value entered is zero or blank.
5 [Optional] Enter the VERTICAL AXIS RANGE for each available metric.
The sparkline scales automatically when the value entered is zero or blank.
6 [Optional] Select the Use these settings as defaults check box to use the current settings
in all PREFERENCES tabs as the default configuration each time you add this portlet to
a portal page.
7 Click OK.
Chapter 7 Canary Response Times
128 Teradata Viewpoint User Guide, Release 14.01](https://image.slidesharecdn.com/2206user14-01-130625135151-phpapp02/85/2206-user-14-01-128-320.jpg)
![Setting Past Averages
Use the Past Averages tab in the PREFERENCES view to specify the number of weeks of
data points used to calculate the average values displayed in metric graphs.
1 From the portlet frame, click to access the PREFERENCES view.
2 Click the Past Averages tab.
3 [Optional] Click Clear Defaults to clear all user-defined default settings created for this
portlet.
4 Enter the number of weeks (1 to 99 weeks).
The default is 2 weeks.
5 [Optional] Select the Use these settings as defaults check box to use the current settings
in all PREFERENCES tabs as the default configuration each time you add this portlet to
a portal page.
6 Click OK.
Chapter 7 Canary Response Times
Teradata Viewpoint User Guide, Release 14.01 129](https://image.slidesharecdn.com/2206user14-01-130625135151-phpapp02/85/2206-user-14-01-129-320.jpg)

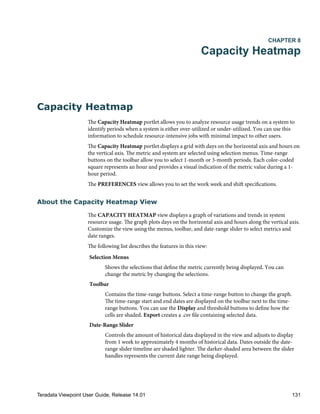


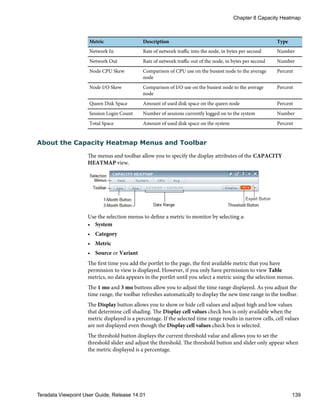
![If the threshold value is within the gray-scale range defined in the DISPLAY OPTIONS
menu, the cells are displayed in a shade of the exception color equivalent to the
corresponding gray-scale shade for that cell value.
The Export button allows you to create a .csv file containing selected data.
Selecting Metrics and Systems to Monitor
You can use selection menus to choose a metric and system to monitor in the portlet,
starting with the highest level menu on the far left. Menus choices are available based on the
previous menu, so not all menus apply to all metrics.
You are not required to make a selection from every menu each time you modify a metric
selection.
1 In the selection menu, click the currently selected system name to display a list of
available systems.
2 Select a system from the menu.
3 Click Next.
4 Select a category from the menu.
5 Click Next.
6 Select a metric from the menu.
7 Click Next.
8 [Optional] Select a source or variant from the menu.
The menu for source or variant (sum, average, minimum, maximum, standard deviation
of that metric) is only available for certain metric categories.
9 Click Next.
Adjusting the Date Range
Use the toolbar to set the range of dates to display for the selected metric and system.
1 Mouse over the date-range slider to activate the start-date and end-date handles.
2 Drag the start-date handle until the intended start date is displayed in the toolbar.
3 Drag the end-date handle until the intended end date is displayed in the toolbar.
4 [Optional] Drag the date-range slider left or right to move the start-date and end-date
handles in unison.
Chapter 8 Capacity Heatmap
140 Teradata Viewpoint User Guide, Release 14.01](https://image.slidesharecdn.com/2206user14-01-130625135151-phpapp02/85/2206-user-14-01-140-320.jpg)
![5 [Optional] Click 1 mo.
One month of historical data is displayed ending at the current end date.
6 [Optional] Click 3 mo.
Slightly more than three months of historical data is displayed ending at the current end
date.
Setting Cell Values and Shading
The DISPLAY OPTIONS dialog box allows you to display cell values and to set metric
thresholds for applying cell shading for each system monitored. The shading provides a
visual overview by highlighting interesting values.
You must repeat this procedure for each available metric to ensure appropriate shading is
applied when the metric is selected.
1 From the CAPACITY HEATMAP view, click Display.
The DISPLAY OPTIONS dialog box appears.
2 Do one of the following:
• Select the Display cell values check box to display cell values.
• Clear the Display cell values check box to display cells without values.
The Display cell values check box is only available when the metric displayed is a
percentage. If the selected date range results in narrow cells, cell values are not displayed
even though the Display cell values check box is selected.
3 Set the lower and upper threshold values in the Apply shading to values between boxes.
4 Click OK.
Values below the defined range appear in a very light shade of gray, while values above the
range have a very dark shade. Values within the defined range appear in three shades of
gray.
Setting the Threshold Value
The threshold button displays the current threshold value. Use the threshold button to
access the threshold slider and adjust exception highlighting to show when the system is
over-utilized or under-utilized.
The threshold button and slider only appear when the metric displayed is a percentage.
1 In the toolbar, click the threshold button.
The threshold slider appears.
Chapter 8 Capacity Heatmap
Teradata Viewpoint User Guide, Release 14.01 141](https://image.slidesharecdn.com/2206user14-01-130625135151-phpapp02/85/2206-user-14-01-141-320.jpg)
![2 Do one of the following:
• Click to set an upper threshold, highlighting all values greater than the selected
value in shades of red.
• Click to set a lower threshold, highlighting all values less than the selected value in
shades of gray.
3 Drag up or down to adjust the threshold value.
The CAPACITY HEATMAP view highlights change to reflect values above or below the
threshold setting.
4 Click anywhere off the threshold slider to close the slider and return to the portlet.
Exporting Metrics
You can export data to a .csv file for further analysis and formatting. The exported .csv file
contains up to the last 8 months of data, regardless of the selected date range. One variant
(Avg, Max, or Min) is exported for the selected metric.
1 In the selection menu, select a system, category, metric, and variant.
2 Click .
3 Save the file using the browser options.
The file is saved to your download area or to a location that you specify, depending on
the browser settings.
4 [Optional] Reformat exported data to match the format in the view.
About the Preferences View
The PREFERENCES view allows you to specify the work days and hours that are outlined
with a border in the CAPACITY HEATMAP view. This setting helps to visually emphasize
the days and hours during which most users are using system resources.
From the portlet frame, click to access the PREFERENCES view.
Chapter 8 Capacity Heatmap
142 Teradata Viewpoint User Guide, Release 14.01](https://image.slidesharecdn.com/2206user14-01-130625135151-phpapp02/85/2206-user-14-01-142-320.jpg)
![Configuring the Work Week and Shift
Use the Work week and shift tab in the PREFERENCES view to outline specific work days
and hours with a dark gray border in the CAPACITY HEATMAP view. The work-week-
and-shift-border helps you easily identify the days and hours when system resources are
used most.
1 From the portlet frame, click to access the PREFERENCES view.
2 Click the Work week and shift tab.
3 [Optional] Click Clear Defaults to clear all user-defined default settings created for this
portlet.
4 Select the number of shifts (work days) per week from the Total number of shifts per
week list.
A single row displays for each shift.
5 For each shift, click the appropriate arrow, and then select the following:
• Start day
• Start time
• Shift duration
6 [Optional] Select the Use these settings as defaults check box to use the current settings
in all PREFERENCES tabs as the default configuration each time you add this portlet to
a portal page.
7 Click OK.
Example with Overlapping Shifts
When multiple shifts are defined on the same day and the hours you specify overlap, they are
combined into one shift and are enclosed in one set of shift-indicator lines. The first shift starts at 6
AM and lasts for 8 hours, and the second shift starts at 1 PM and lasts for 8 hours. After you save
these settings, the work-week lines and shift-indicator lines show a single shift from 6 AM to 9
PM. The Work week and shift tab counts the combined Total number of shifts per week and the
Shift duration indicates a longer single shift.
Chapter 8 Capacity Heatmap
Teradata Viewpoint User Guide, Release 14.01 143](https://image.slidesharecdn.com/2206user14-01-130625135151-phpapp02/85/2206-user-14-01-143-320.jpg)

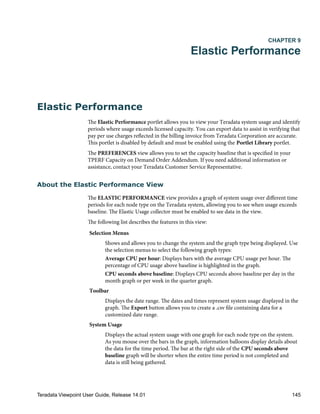
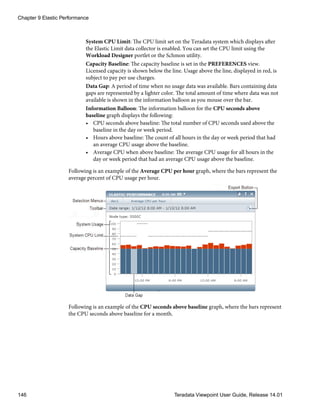
![Selecting a System
You can use selection menus to choose a system and graph type, starting with the highest
level menu on the far left. Menu choices are based on the previous menu.
1 In the selection menu, click the currently selected system name to display a list of
available systems.
2 Select a system from the menu.
Only systems that have the Elastic Usage collector enabled are included in the system
selection.
3 Click Next.
4 To select a graph type, do one of the following:
• Select Average CPU per hour.
• Select CPU seconds above baseline, click Next, and then select Month or Quarter.
5 Click Next.
Exporting Usage Data
You can export usage data for further analysis. The date range shown in the toolbar is the
default period for which data is exported. Start and end dates are inclusive. The time zone
used for the export date range is the Teradata system time zone.
1 In the selection menu, select a system and graph type.
2 Click .
3 [Optional] Change the start and end date.
4 Select one of the following export options:
Export File Type Description
Summary Data (CSV) Exports aggregate data from the graph for viewing.
Summary Data (ZIP) Exports aggregate data from the graph for billing purposes.
Chapter 9 Elastic Performance
Teradata Viewpoint User Guide, Release 14.01 147](https://image.slidesharecdn.com/2206user14-01-130625135151-phpapp02/85/2206-user-14-01-147-320.jpg)

![CHAPTER 10
External Content
External Content
The External Content portlet allows you to access your company browser-based tools from
within the Teradata Viewpoint portal. Upon opening the External Content portlet, the web
page appears, as set by the Teradata Viewpoint Administrator. If you have the appropriate
permissions, you can use the PREFERENCES view to change the URL.
Caution: Any valid web URL can be used. However, the portlet does not validate page content.
Accessing some URLs might display the page outside the portlet or redirect the portal page
entirely.
About the Preferences View
The PREFERENCES view allows you to customize the URL that appears when the External
Content portlet is opened. You must have the appropriate permissions to change the URL.
Changing the URL
Use the PREFERENCES view to change the URL set by the Teradata Viewpoint
Administrator.
1 From the portlet frame, click to access the PREFERENCES view.
2 Enter the URL of your choice.
3 Press Enter.
A confirmation message appears.
4 Click Save.
The new URL is saved.
Setting the Default URL
Use the PREFERENCES view to change the default URL set by the Teradata Viewpoint
Administrator.
1 From the portlet frame, click to access the PREFERENCES view.
2 [Optional] Click Clear Defaults to clear all user-defined default settings created for this
portlet.
The URL reverts to the default URL set by the Teradata Viewpoint Administrator.
Teradata Viewpoint User Guide, Release 14.01 149](https://image.slidesharecdn.com/2206user14-01-130625135151-phpapp02/85/2206-user-14-01-149-320.jpg)


![The Lock Log Report appears with the database locks that occurred within the period of
time you specified.
2 [Optional] Drag the column border in either direction to resize the column.
Summary Locks
This topic describes the information that appears in the Lock Log Report.
Column Description Type
Blocking Host Logical host ID of the transaction that imposed the lock Number
Blocking Level Lock level of the transaction that imposed the lock. The
following values indicate the level:
• Database Locked at the database level
• Table Locked at the table level
• RowHash Locked at the row level
• RowRange Locked for a range of rows
Alpha
Blocking Mode Lock level mode of the transaction that imposed the lock.
The following values indicate the mode:
• Ac Access
• Ex Exclusive
• Rd Read
• Wr Write
Alpha
Blocking Session Session number of the transaction that imposed the lock.
The following session numbers are used to indicate
database internal sessions:
• 0 System User
• 1 System Accounting
• 2 System Recovery
• 3 Archive/Restore
Number
Blocking User Username that is blocking the query of another user Alpha
Blocktime Date and time at which the block occurred, displayed as
MM/DD/YY HH:MM:SS
Number
Database Database name on which the lock was requested Alpha or Number
Deadlock Indicates whether the lock contention results in a deadlock.
The following values indicate the type of deadlock:
• N No deadlock
• Y Local deadlock
• G Global deadlock
Alpha
Delay Total time, in seconds, the transaction waited for the block Number
Host Logical host ID of the transaction that was waiting for the
lock
Number
Chapter 11 Lock Viewer
Teradata Viewpoint User Guide, Release 14.01 153](https://image.slidesharecdn.com/2206user14-01-130625135151-phpapp02/85/2206-user-14-01-153-320.jpg)


![Wildcard or
Symbol Description Example Results
For columns containing percentages, avoid using % in the
filter. Type only < and the number.
<= Use these symbols in conjunction to match values less than
or equal to the specified number.
For columns containing percentages, avoid using % in the
filter. Type only <= and the number.
<=60 60, 59, 58, 50, 8, and so forth
! Use this symbol at the beginning of your search to match
alpha or numeric characters that do not contain the alpha
or numeric characters.
This symbol can be used in conjunction with any other
symbol or wildcard character.
!cat33 cat32, cat34, and so forth
Clearing Filters
You can clear the filter box values from the table.
1 Do one of the following:
Option Description
Clear
individual
filter boxes
a. Click on the filter box.
Clear all
filter boxes
a. Select Clear Filters at the bottom of the portlet.
Configuring Columns to Display
Use the Columns dialog box to set thresholds and select, lock, and order columns. You can
resize columns in the table. The thresholds and column selection, order, and lock settings
that you choose are applied to the minimized and maximized views separately.
1 Click in the table header and select Configure Columns.
2 In the Columns dialog box, select the check boxes of columns to display.
Mouse over the name to see the complete name.
3 [Optional] Click next to the column name.
The columns at the top of the list can be locked in the table to remain on the left when
scrolling horizontally.
4 [Optional] Click Set, type a threshold value, and click OK.
Values exceeding the threshold are highlighted and displayed in the table.
5 [Optional] Click and drag the row to reorder the column.
Chapter 11 Lock Viewer
156 Teradata Viewpoint User Guide, Release 14.01](https://image.slidesharecdn.com/2206user14-01-130625135151-phpapp02/85/2206-user-14-01-156-320.jpg)
![6 Click Apply to save the changes.
7 [Optional] In the table, drag the column heading border in either direction to resize
the column.
Exporting Table Data
You can export data to a .csv file for further analysis and formatting. The exported .csv file
contains all available data. If filters are used, only filtered data is exported. The format for the
time, date, and some numeric values differs in the view and exported .csv file.
1 Click in the table header and select Export.
2 Save the file using the browser options.
The file is saved to your download area or to a location that you specify, depending on
the browser settings.
Chapter 11 Lock Viewer
Teradata Viewpoint User Guide, Release 14.01 157](https://image.slidesharecdn.com/2206user14-01-130625135151-phpapp02/85/2206-user-14-01-157-320.jpg)


![The Export button allows you to create a .csv file containing selected data.
Exporting Metrics
You can export data to a .csv file for further analysis and formatting. The exported .csv file
contains data for the selected time period. The minimum, average, and maximum is exported
for all metrics configured in the PREFERENCES view.
1 In the toolbar, click a time-range button.
Option Frequency
1 hour Data points at 2 minute intervals
1 day Data points at 15 minute intervals
1 week Data points at 1 hour intervals
1 mo Data points at 4 hour intervals
3 mo Data points at 12 hour intervals
6 mo Data points at a 1 day interval
2 Click .
3 Save the file using the browser options.
The file is saved to your download area or to a location that you specify, depending on
the browser settings.
4 [Optional] Reformat exported data to match the format in the view.
Analysis Metrics for Teradata Database
The following metrics are available to analyze resource usage for a Teradata Database system.
Metric Description Type
Active Sessions Number of sessions with active queries Number
AMP CPU Skew Comparison of CPU use on the busiest AMP to the average
AMP
Percent
AMP I/O Skew Comparison of disk use on the busiest AMP to the average
AMP
Percent
Average Outstanding
Disk Reqs
Outstanding disk requests (disk queue size) Number
AWT Average number of AMP worker tasks in use on each AMP Number
Components Down Number of components, such as BYNETs or AMPs that are
down
Number
CPU Average node CPU use. CPU is calculated as the sum of the
user CPU and system CPU usage percentages.
Percent
CPU AWT Processing CPU resources spent processing an AMP worker task.
Normalized by multiplying the value returned from Teradata
Database by the number of physical CPUs on the associated
node of the AWT.
Percent
Chapter 12 Metrics Analysis
162 Teradata Viewpoint User Guide, Release 14.01](https://image.slidesharecdn.com/2206user14-01-130625135151-phpapp02/85/2206-user-14-01-162-320.jpg)


![Metric Description Type
Node CPU Skew Comparison of CPU use on the busiest node to the average
node
Percent
Node I/O Skew Comparison of I/O use on the busiest node to the average
node
Percent
Queen Disk Space Amount of used disk space on the queen node Percent
Session Login Count Number of sessions currently logged on to the system Number
Total Space Amount of used disk space on the system Percent
About the Preferences View
From the portlet frame, click to access the PREFERENCES view.
In this view, you can:
• Add metrics to monitor and display.
• Delete metrics that you do not want to monitor or display.
• Select the ENABLE check box to plot the metric in the graph.
• Clear the ENABLE check box to remove the metric from the graph, but still list it below
the graph.
• Reorder metrics to change their position and color.
• Select systems to monitor and display.
• Set a threshold that helps you track the performance of each metric.
• Set a vertical axis range to limit the maximum value to display.
Adding Metrics
You can add metrics that are plotted in the graph.
1 From the portlet frame, click to access the PREFERENCES view.
2 [Optional] Select the ENABLE check box to enable the metric for display.
3 [Optional] Select a system from the list.
The SYSTEM list is available when more than one Teradata Viewpoint server is enabled
for the Data Collection Service.
4 Select a metric from the list.
You can add or remove metrics. Up to 10 metrics can be listed.
5 [Optional] Enter a THRESHOLD value.
6 [Optional] Enter a VERTICAL AXIS RANGE value.
7 [Optional] Click and drag the row to reorder the metrics for display.
8 [Optional] Select the Use these settings as defaults check box to use the current settings
in all PREFERENCES tabs as the default configuration each time you add this portlet to
a portal page.
9 Click OK.
Chapter 12 Metrics Analysis
Teradata Viewpoint User Guide, Release 14.01 165](https://image.slidesharecdn.com/2206user14-01-130625135151-phpapp02/85/2206-user-14-01-165-320.jpg)
![Changing the Metrics Display Order
You can change the order of the metrics that are listed below the graph. Reordering the
metric list affects which color is assigned to the metric.
1 From the portlet frame, click to access the PREFERENCES view.
2 Click the Metrics tab.
3 [Optional] Click Clear Defaults to clear all user-defined default settings created for this
portlet.
4 On the metric row, click and drag the row to its new location.
5 [Optional] Select the Use these settings as defaults check box to use the current settings
in all PREFERENCES tabs as the default configuration each time you add this portlet to
a portal page.
6 Click OK.
Enabling and Disabling Metrics
You can enable and disable metrics from the graph. When a metric is disabled, the metric
plot line is not displayed in the graph; however, data points are still being collected, so the
metric is included in the list under the graph and can be reactivated at a later time.
1 From the portlet frame, click to access the PREFERENCES view.
2 [Optional] Click Clear Defaults to clear all user-defined default settings created for this
portlet.
3 Do one of the following:
• Clear ENABLE on the metric line to disable the metric.
• Select ENABLE on the metric line to enable the metric.
4 [Optional] Select the Use these settings as defaults check box to use the current settings
in all PREFERENCES tabs as the default configuration each time you add this portlet to
a portal page.
5 Click OK.
Deleting Metrics
You can delete metrics from the graph. When a metric is deleted in the PREFERENCES
view, the metric plot line is not displayed in the graph, and the metric is not included in the
list.
1 From the portlet frame, click to access the PREFERENCES view.
2 Select the Metrics tab.
3 [Optional] Click Clear Defaults to clear all user-defined default settings created for this
portlet.
4 Click on the metric row of the metric you want to delete.
The metric row disappears.
Chapter 12 Metrics Analysis
166 Teradata Viewpoint User Guide, Release 14.01](https://image.slidesharecdn.com/2206user14-01-130625135151-phpapp02/85/2206-user-14-01-166-320.jpg)
![5 [Optional] Select the Use these settings as defaults check box to use the current settings
in all PREFERENCES tabs as the default configuration each time you add this portlet to
a portal page.
6 Click OK.
Chapter 12 Metrics Analysis
Teradata Viewpoint User Guide, Release 14.01 167](https://image.slidesharecdn.com/2206user14-01-130625135151-phpapp02/85/2206-user-14-01-167-320.jpg)


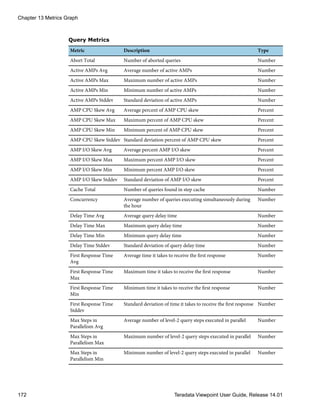


![4 Select a category from the menu.
5 Click Next.
6 Select a metric from the menu.
7 Click Next.
8 [Optional] Select a source or variant from the menu.
The menu for source or variant (sum, average, minimum, maximum, standard deviation
of that metric) is only available for certain metric categories.
9 Click Next.
Adjusting the Date Range
Use the toolbar to set the range of dates to display for the selected metric and system.
1 Mouse over the date-range slider to activate the start-date and end-date handles.
2 Drag the start-date handle until the intended start date is displayed in the toolbar.
3 Drag the end-date handle until the intended end date is displayed in the toolbar.
4 [Optional] Drag the date-range slider left or right to move the start-date and end-date
handles in unison.
5 [Optional] Click 1 mo.
One month of historical data is displayed ending at the current end date.
6 [Optional] Click 3 mo.
Three months of historical data is displayed ending at the current end date.
Exporting Metrics
You can export data to a .csv file for further analysis and formatting. The exported .csv file
contains up to the last 8 months of data, regardless of the selected date range. One variant
(Avg, Max, or Min) is exported for the selected metric.
1 In the selection menu, select a system, category, metric, and variant.
2 Click .
3 Save the file using the browser options.
The file is saved to your download area or to a location that you specify, depending on
the browser settings.
4 [Optional] Reformat exported data to match the format in the view.
Chapter 13 Metrics Graph
178 Teradata Viewpoint User Guide, Release 14.01](https://image.slidesharecdn.com/2206user14-01-130625135151-phpapp02/85/2206-user-14-01-178-320.jpg)


![Clearing Filters
You can clear the filter box values from the table.
1 Do one of the following:
Option Description
Clear
individual
filter boxes
a. Click on the filter box.
Clear all
filter boxes
a. Select Clear Filters at the bottom of the portlet.
Configuring Columns to Display
Use the Columns dialog box to set thresholds and select, lock, and order columns. You can
resize columns in the table. The thresholds and column selection, order, and lock settings
that you choose are applied to the minimized and maximized views separately.
1 Click in the table header and select Configure Columns.
2 In the Columns dialog box, select the check boxes of columns to display.
Mouse over the name to see the complete name.
3 [Optional] Click next to the column name.
The columns at the top of the list can be locked in the table to remain on the left when
scrolling horizontally.
4 [Optional] Click Set, type a threshold value, and click OK.
Values exceeding the threshold are highlighted and displayed in the table.
5 [Optional] Click and drag the row to reorder the column.
6 Click Apply to save the changes.
7 [Optional] In the table, drag the column heading border in either direction to resize
the column.
Exporting Table Data
You can export data to a .csv file for further analysis and formatting. The exported .csv file
contains all available data. If filters are used, only filtered data is exported. The format for the
time, date, and some numeric values differs in the view and exported .csv file.
1 Click in the table header and select Export.
2 Save the file using the browser options.
The file is saved to your download area or to a location that you specify, depending on
the browser settings.
Chapter 14 My Queries
182 Teradata Viewpoint User Guide, Release 14.01](https://image.slidesharecdn.com/2206user14-01-130625135151-phpapp02/85/2206-user-14-01-182-320.jpg)
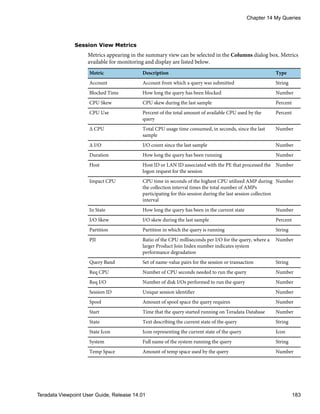
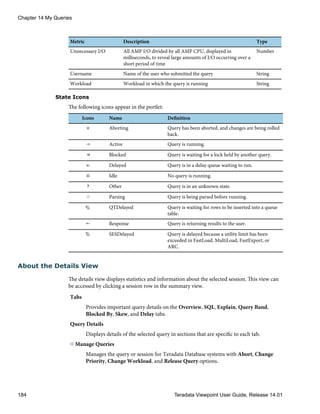


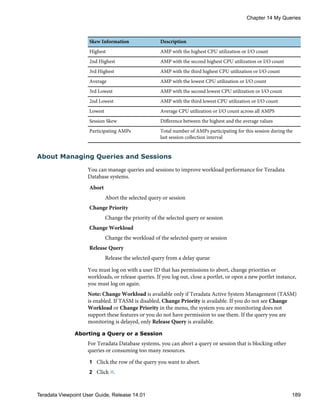
![3 Select Abort.
4 Log on to Teradata Database, if prompted.
5 Click Next.
6 Select one of the following:
• Abort Query to abort the selected query.
• Abort Session to abort the selected query and log off the session.
7 Click Next.
8 Click Next to confirm your selection.
Changing the Priority of a Query or Session
For Teradata Database systems, you can change the priority of a query or session to allow
higher priority queries to run or balance session resources.
This menu item is only available when workloads are not enabled and the system being
monitored supports this feature.
1 Click the row of the query you want to change.
2 Click .
3 Select Change Priority.
4 Log on to Teradata Database, if prompted.
5 Click Next.
6 From the list of accounts that have been assigned to the user, select an account to copy
the account name to the Edit new account string box.
7 [Optional] Edit the account string or enter a new account string.
8 Click Next.
9 Select one of the following:
• Move just this query to change the priority of the selected query.
• Move this query and all future queries associated with this session to change the
priority of the selected query and all subsequent queries in the current session.
10 Click Next.
11 Click Next to confirm your selection.
Changing the Workload of a Query or Session
For Teradata Database systems, you can change the workload of a query or session to allow
higher priority workloads to run or to balance workload resources.
This menu item is only available when workloads are enabled and the system being
monitored supports this feature.
1 Click the row of the query you want to change.
2 Click .
3 Select Change Workload.
Chapter 14 My Queries
190 Teradata Viewpoint User Guide, Release 14.01](https://image.slidesharecdn.com/2206user14-01-130625135151-phpapp02/85/2206-user-14-01-190-320.jpg)
![4 Log on to Teradata Database, if prompted.
5 Click Next.
6 Select a different workload from the list and click Next.
7 Select one of the following:
• Move just this query to change the selected query.
• Move this query and all future queries associated with this session to change the
priority of the selected query and all subsequent queries in the current session.
8 Click Next.
9 Click Next to confirm your selection.
10 Click OK.
Releasing a Query
For Teradata Database systems, you can release a query from the delay queue for immediate
processing.
1 Click the row of the query you want to change.
2 Click .
3 Select Release Query.
4 Log on to Teradata Database, if prompted.
5 Click Next.
6 Click Next to confirm your selection.
Changing Multiple Sessions
You can change system resources for multiple sessions, users, or account strings in the
following locations:
• All sessions table from the summary view
• User sessions table from the details view
• Account strings table from the details view
1 Click a session from the summary view.
2 [Optional] Access user or account string tables from the details view.
a Click a session.
b Click the USER or ACCOUNT link under SESSION INFO.
3 Select a session action from the Table Actions menu.
Check boxes appear next to the sessions.
4 Do one of the following:
• Select the check box in the column heading to select all sessions.
• Select the check boxes for specific sessions.
5 Select Next.
6 Log on to Teradata Database, if prompted.
Chapter 14 My Queries
Teradata Viewpoint User Guide, Release 14.01 191](https://image.slidesharecdn.com/2206user14-01-130625135151-phpapp02/85/2206-user-14-01-191-320.jpg)
![7 Follow the instructions on subsequent screens.
About the Preferences View
The PREFERENCES view allows you to select systems and users to monitor and to select a
format for the SQL that appears in the query details view.
From the portlet frame, click to access the PREFERENCES view and then use one or
more of the following tabs to customize your preferences.
Systems
Select the Teradata Database systems and login user names to monitor.
Display
Choose formatted or unformatted SQL to display on the SQL tab of the query details
view.
Selecting Systems and Users to Monitor
Use the Systems tab in the PREFERENCES view to select Teradata Database systems and
login user names to monitor.
Define user names for each system using the Profile portlet. Only predefined user names
appear on the Systems tab.
1 From the portlet frame, click to access the PREFERENCES view.
2 Click the Systems tab.
3 Click to expand system names and show available user names.
4 [Optional] Click Clear Defaults to clear all user-defined default settings created for this
portlet.
5 For each Teradata Database system and user name you want to monitor:
a Select the systems on which you want to monitor queries.
b Select the user names for each system that you want to monitor.
Chapter 14 My Queries
192 Teradata Viewpoint User Guide, Release 14.01](https://image.slidesharecdn.com/2206user14-01-130625135151-phpapp02/85/2206-user-14-01-192-320.jpg)
![6 [Optional] Select the Use these settings as defaults check box to use the current settings
in all PREFERENCES tabs as the default configuration each time you add this portlet to
a portal page.
7 Click OK.
Selecting Display Options
The Display tab in the PREFERENCES view allows you to format the SQL that appears on
the SQL tab of the query details view.
1 From the portlet frame, click to access the PREFERENCES view.
2 Click the Display tab.
3 [Optional] Click Clear Defaults to clear all user-defined default settings created for this
portlet.
4 Do one of the following for Teradata Database systems:
• Select the Format SQL check box to use formatted SQL.
• Clear the Format SQL check box to use unformatted SQL.
5 [Optional] Select the Use these settings as defaults check box to use the current settings
in all PREFERENCES tabs as the default configuration each time you add this portlet to
a portal page.
6 Click OK.
Chapter 14 My Queries
Teradata Viewpoint User Guide, Release 14.01 193](https://image.slidesharecdn.com/2206user14-01-130625135151-phpapp02/85/2206-user-14-01-193-320.jpg)
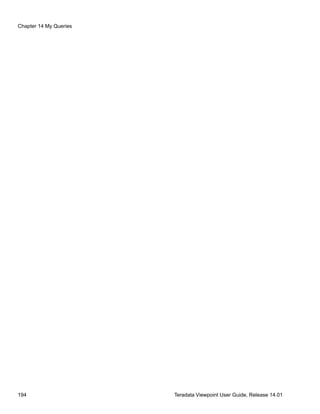


![Selecting a System to Monitor
You can use selection menus to choose a system and type of resource to monitor in the
portlet, starting with the highest level menu on the far left. Menu choices are based on the
previous menu.
1 In the selection menu, click the currently selected system name to display a list of
available systems.
2 Select a system from the menu.
3 Click Next.
4 Select a type of resource from the menu.
5 Click Next.
6 Select Nodes or Vprocs from the menu.
7 Click Next.
8 Do one of the following:
• Select Nodes, and then select ALL, With AMPs, or Without AMPs from the menu.
• Select Vprocs, and then select ALL, AMPs, or PEs from the menu.
9 [Optional] Click Next.
Selection Menu Choices
The Node Resources portlet displays data for a single Teradata Database system. The
selection menu allows you to choose the type of data that appears in the summary views,
Chapter 15 Node Resources
Teradata Viewpoint User Guide, Release 14.01 197](https://image.slidesharecdn.com/2206user14-01-130625135151-phpapp02/85/2206-user-14-01-197-320.jpg)

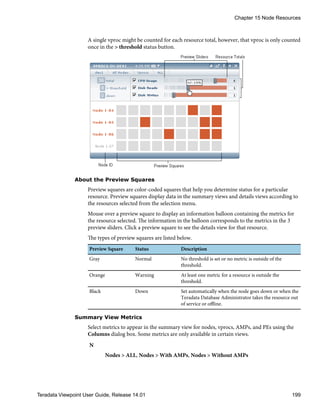


![Wildcard or
Symbol Description Example Results
>= Use these symbols in conjunction to match values greater
than or equal to the specified number.
For columns containing percentages, avoid using % in the
filter. Type only >= and the number.
>=60 60, 61, 62, 70, 500, and so forth
< Use this symbol to match any number that is less than the
specified value. This symbol is only used to perform
mathematical comparisons.
For columns containing percentages, avoid using % in the
filter. Type only < and the number.
<60 59, 58, 50, 8, and so forth
<= Use these symbols in conjunction to match values less than
or equal to the specified number.
For columns containing percentages, avoid using % in the
filter. Type only <= and the number.
<=60 60, 59, 58, 50, 8, and so forth
! Use this symbol at the beginning of your search to match
alpha or numeric characters that do not contain the alpha or
numeric characters.
This symbol can be used in conjunction with any other
symbol or wildcard character.
!cat33 cat32, cat34, and so forth
Clearing Filters
You can clear the filter box values from the table.
1 Do one of the following:
Option Description
Clear
individual
filter boxes
a. Click on the filter box.
Clear all
filter boxes
a. Select Clear Filters at the bottom of the portlet.
Configuring Columns to Display
Use the Columns dialog box to set thresholds and select, lock, and order columns. You can
resize columns in the table.
1 Click in the table header and select Configure Columns.
2 In the Columns dialog box, select the check boxes of columns to display.
Mouse over the name to see the complete name.
3 [Optional] Click next to the column name.
Chapter 15 Node Resources
Teradata Viewpoint User Guide, Release 14.01 203](https://image.slidesharecdn.com/2206user14-01-130625135151-phpapp02/85/2206-user-14-01-203-320.jpg)
![The columns at the top of the list can be locked in the table to remain on the left when
scrolling horizontally.
4 [Optional] Click Set, type a threshold value, and click OK.
Qualifying data is highlighted in the table.
5 [Optional] Click and drag the row to reorder the column.
6 Click Apply to save the changes.
7 [Optional] In the table, drag the column heading border in either direction to resize
the column.
The thresholds and column selection, order, and lock settings that you choose are applied
to the minimized and maximized views separately.
Exporting Table Data
You can export data to a .csv file for further analysis and formatting. The exported .csv file
contains all available data. If filters are used, only filtered data is exported. The format for the
time, date, and some numeric values differs in the view and exported .csv file.
1 Click in the table header and select Export.
2 Save the file using the browser options.
The file is saved to your download area or to a location that you specify, depending on
the browser settings.
About the Details View
The details view displays statistics and information about a particular node or vproc to help
you isolate performance or system issues. This view can be accessed by clicking on a preview
square in the summary view or a row in the table view.
Preview squares at the bottom of the view help you determine the status for a particular
vproc within the node. Mouse over a square to display an information balloon containing
metrics for that vproc. Mouse over other preview squares to compare the metric values with
other vprocs. When viewing a vproc, the parent node number is shown in the information
balloon. Click a preview square to directly access the details view for another vproc. Click the
node ID to view the details view for that node.
Chapter 15 Node Resources
204 Teradata Viewpoint User Guide, Release 14.01](https://image.slidesharecdn.com/2206user14-01-130625135151-phpapp02/85/2206-user-14-01-204-320.jpg)


![Slider Metrics
Select the metrics to display in the preview sliders for each view. Set the maximum
threshold percent for each metric.
Display
Display or hide nodes or cliques in the summary views that are operating within set
thresholds.
Setting Metric Thresholds
Use the Slider Metrics tab in the PREFERENCES view to set metric thresholds. Use
MaxThreshold % to set the maximum range of the preview sliders in the summary views.
1 From the portlet frame, click to access the PREFERENCES view.
2 Click the Slider Metrics tab.
3 [Optional] Click Clear Defaults to clear all user-defined default settings created for this
portlet.
4 Select a view from the list.
5 Select a metric from the list.
6 Enter the maximum threshold percent for each metric.
The maximum range of the preview sliders changes in the summary views.
7 [Optional] Select the Use these settings as defaults check box to use the current settings
in all PREFERENCES tabs as the default configuration each time you add this portlet to
a portal page.
8 Click OK.
Hiding Nodes and Cliques
Use the Display tab in the PREFERENCES view to display or hide nodes or cliques in the
summary views.
1 From the portlet frame, click to access the PREFERENCES view.
2 Click the Display tab.
3 [Optional] Click Clear Defaults to clear all user-defined default settings created for this
portlet.
4 Do one of the following:
• Select the Hide nodes or cliques that are operating within set thresholds check box
to hide nodes or cliques in the summary views.
• Clear the Hide nodes or cliques that are operating within set thresholds check box
to display nodes or cliques in the summary views.
5 [Optional] Select the Use these settings as defaults check box to use the current settings
in all PREFERENCES tabs as the default configuration each time you add this portlet to
a portal page.
6 Click OK.
Chapter 15 Node Resources
208 Teradata Viewpoint User Guide, Release 14.01](https://image.slidesharecdn.com/2206user14-01-130625135151-phpapp02/85/2206-user-14-01-208-320.jpg)

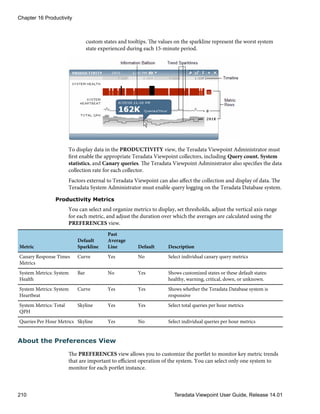
![From the portlet frame, click to access the PREFERENCES view and then use one or
more of the following tabs to customize your preferences.
System
Select a system to monitor.
Metrics
Select and organize metrics to monitor in the summary view. Drag metrics from a
list of all available metrics to the Preview pane where you can preview the results as
you go.
Settings
Define settings for the metrics selected for display. Set thresholds to highlight metric
values that are outside normal operating ranges. Set maximum vertical-axis ranges
to limit the range of values displayed for selected metrics.
Past Averages
Adjust the number of weeks of data points used to calculate the average value for
each displayed metric.
Selecting a System to Monitor
Use the System tab in the PREFERENCES view to select a Teradata Database system to
monitor. Only one system can be selected for each portlet instance.
1 From the portlet frame, click to access the PREFERENCES view.
2 Click the System tab.
3 [Optional] Click Clear Defaults to clear all user-defined default settings created for this
portlet.
4 Select a system from the list.
5 [Optional] Select the Use these settings as defaults check box to use the current settings
in all PREFERENCES tabs as the default configuration each time you add this portlet to
a portal page.
6 Click OK.
Selecting Metrics to Monitor
Use the Metrics tab in the PREFERENCES view to select and organize the metrics shown in
the summary view.
1 From the portlet frame, click to access the PREFERENCES view.
2 Click the Metrics tab.
The Preview pane uses sample data to show how metric rows are displayed in the
summary view.
3 [Optional] Click Clear Defaults to clear all user-defined default settings created for this
portlet.
4 Do any of the following to change the way metric rows are displayed:
Chapter 16 Productivity
Teradata Viewpoint User Guide, Release 14.01 211](https://image.slidesharecdn.com/2206user14-01-130625135151-phpapp02/85/2206-user-14-01-211-320.jpg)
![• Add a metric row. Drag a metric from the Select metrics for display list to the
Preview pane.
• Remove a metric row. Click located on the metric row.
• Change metric row order. Drag a metric already in the Preview pane to a new
location in the pane (up or down).
Adding or removing metrics affects only the system currently selected, provided that the
metrics are available on that system.
5 [Optional] Select the Use these settings as defaults check box to use the current settings
in all PREFERENCES tabs as the default configuration each time you add this portlet to
a portal page.
6 Click OK.
Setting Metric Thresholds
Use the Settings tab in the PREFERENCES view to set the THRESHOLD and VERTICAL
AXIS RANGE values for the metrics selected for display. Only metrics selected using the
Metrics tab appear in the list of available metrics.
Only the Teradata Viewpoint Administrator can enable System Health metrics and
configure the degraded and critical thresholds. These selections are made in the Teradata
Systems portlet.
1 From the portlet frame, click to access the PREFERENCES view.
2 Click the Settings tab.
3 [Optional] Click Clear Defaults to clear all user-defined default settings created for this
portlet.
4 [Optional] Enter the THRESHOLD setting for each available metric.
The threshold line does not appear in the view when the value entered is zero or blank.
5 [Optional] Enter the VERTICAL AXIS RANGE for each available metric.
The sparkline scales automatically when the value entered is zero or blank.
6 [Optional] Select the Use these settings as defaults check box to use the current settings
in all PREFERENCES tabs as the default configuration each time you add this portlet to
a portal page.
7 Click OK.
Setting Past Averages
Use the Past Averages tab in the PREFERENCES view to specify the number of weeks of
data points used to calculate the average values displayed in metric graphs.
1 From the portlet frame, click to access the PREFERENCES view.
2 Click the Past Averages tab.
3 [Optional] Click Clear Defaults to clear all user-defined default settings created for this
portlet.
4 Enter the number of weeks (1 to 99 weeks).
Chapter 16 Productivity
212 Teradata Viewpoint User Guide, Release 14.01](https://image.slidesharecdn.com/2206user14-01-130625135151-phpapp02/85/2206-user-14-01-212-320.jpg)
![The default is 2 weeks.
5 [Optional] Select the Use these settings as defaults check box to use the current settings
in all PREFERENCES tabs as the default configuration each time you add this portlet to
a portal page.
6 Click OK.
Chapter 16 Productivity
Teradata Viewpoint User Guide, Release 14.01 213](https://image.slidesharecdn.com/2206user14-01-130625135151-phpapp02/85/2206-user-14-01-213-320.jpg)


![Option Description
Clear all
filter boxes
a. Select Clear Filters at the bottom of the portlet.
Configuring Columns to Display
Use the Columns dialog box to set thresholds and select, lock, and order columns. You can
resize columns in the table. The thresholds and column selection, order, and lock settings
that you choose are applied to the minimized and maximized views separately.
1 Click in the table header and select Configure Columns.
2 In the Columns dialog box, select the check boxes of columns to display.
Mouse over the name to see the complete name.
3 [Optional] Click next to the column name.
The columns at the top of the list can be locked in the table to remain on the left when
scrolling horizontally.
4 [Optional] Click Set, type a threshold value, and click OK.
Values exceeding the threshold are highlighted and displayed in the table.
5 [Optional] Click and drag the row to reorder the column.
6 Click Apply to save the changes.
7 [Optional] In the table, drag the column heading border in either direction to resize
the column.
Exporting Table Data
You can export data to a .csv file for further analysis and formatting. The exported .csv file
contains all available data. If filters are used, only filtered data is exported. The format for the
time, date, and some numeric values differs in the view and exported .csv file.
1 Click in the table header and select Export.
2 Save the file using the browser options.
The file is saved to your download area or to a location that you specify, depending on
the browser settings.
State Icons
The following icons appear in the portlet:
Icons Name Definition
Aborting Query has been aborted, and changes are being rolled
back.
Active Query is running.
Chapter 17 Query Groups
220 Teradata Viewpoint User Guide, Release 14.01](https://image.slidesharecdn.com/2206user14-01-130625135151-phpapp02/85/2206-user-14-01-220-320.jpg)

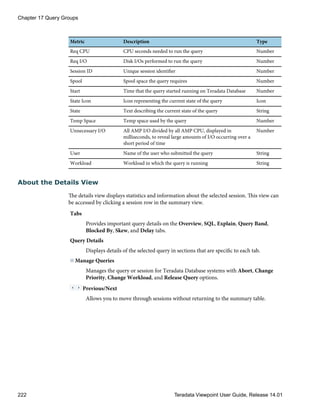
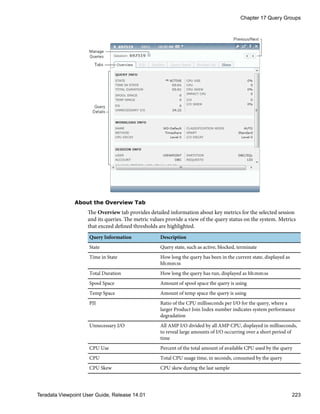

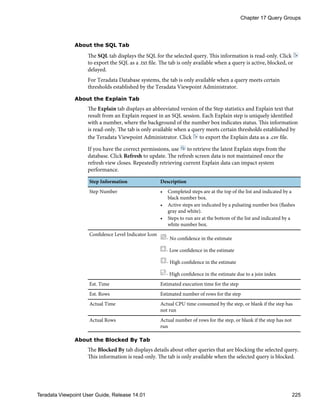
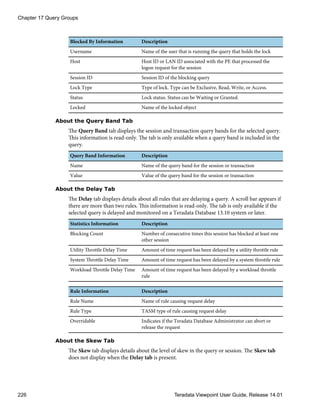

![3 Select Abort.
4 Log on to Teradata Database, if prompted.
5 Click Next.
6 Select one of the following:
• Abort Query to abort the selected query.
• Abort Session to abort the selected query and log off the session.
7 Click Next.
8 Click Next to confirm your selection.
Changing the Priority of a Query or Session
For Teradata Database systems, you can change the priority of a query or session to allow
higher priority queries to run or balance session resources.
This menu item is only available when workloads are not enabled and the system being
monitored supports this feature.
1 Click the row of the query you want to change.
2 Click .
3 Select Change Priority.
4 Log on to Teradata Database, if prompted.
5 Click Next.
6 From the list of accounts that have been assigned to the user, select an account to copy
the account name to the Edit new account string box.
7 [Optional] Edit the account string or enter a new account string.
8 Click Next.
9 Select one of the following:
• Move just this query to change the priority of the selected query.
• Move this query and all future queries associated with this session to change the
priority of the selected query and all subsequent queries in the current session.
10 Click Next.
11 Click Next to confirm your selection.
Changing the Workload of a Query or Session
For Teradata Database systems, you can change the workload of a query or session to allow
higher priority workloads to run or to balance workload resources.
This menu item is only available when workloads are enabled and the system being
monitored supports this feature.
1 Click the row of the query you want to change.
2 Click .
3 Select Change Workload.
Chapter 17 Query Groups
228 Teradata Viewpoint User Guide, Release 14.01](https://image.slidesharecdn.com/2206user14-01-130625135151-phpapp02/85/2206-user-14-01-228-320.jpg)

![• Display or hide the state filter bar in the portlet.
• Choose formatted or unformatted SQL to display in the SQL tab.
Selecting Display Options
Use the Display tab in the PREFERENCES view to select a format for the SQL and to display
or hide filters.
1 From the portlet frame, click to access the PREFERENCES view.
2 [Optional] Click Clear Defaults to clear all user-defined default settings created for this
portlet.
3 Do one of the following:
• Select the Display the state filter bar check box to display the state filter bar in the
portlet.
• Clear the Display the state filter bar check box to hide the state filter bar in the
portlet.
4 Do one of the following:
• Select the Format SQL check box to use formatted SQL.
• Clear the Format SQL check box to use unformatted SQL.
5 [Optional] Select the Use these settings as defaults check box to use the current settings
in all PREFERENCES tabs as the default configuration each time you add this portlet to
a portal page.
6 Click OK.
Chapter 17 Query Groups
230 Teradata Viewpoint User Guide, Release 14.01](https://image.slidesharecdn.com/2206user14-01-130625135151-phpapp02/85/2206-user-14-01-230-320.jpg)


![Option Description
Configuring Columns to Display
Use the Columns dialog box to select, lock, and order columns. You can resize columns in
the table. The thresholds and column selection, order, and lock settings that you choose are
applied to the minimized and maximized views separately.
1 Click in the table header and select Configure Columns.
2 In the Columns dialog box, select the check boxes of columns to display.
Mouse over the name to see the complete name.
3 [Optional] Click next to the column name.
The columns at the top of the list can be locked in the table to remain on the left when
scrolling horizontally.
4 [Optional] Click Set, type a threshold value, and click OK.
Threshold values can be set for Teradata Database systems. Values exceeding the
threshold are highlighted and displayed in the table.
5 [Optional] Click and drag the row to reorder the column.
6 Click Apply to save the changes.
7 [Optional] In the table, drag the column heading border in either direction to resize
the column.
Exporting Table Data
You can export data to a .csv file for further analysis and formatting. The exported .csv file
contains all available data. If filters are used, only filtered data is exported. The format for the
time, date, and some numeric values differs in the view and exported .csv file.
1 Click in the table header and select Export.
2 Save the file using the browser options.
The file is saved to your download area or to a location that you specify, depending on
the browser settings.
State Icons
The following icons appear for a Teradata Database system:
Icons Name Definition
Aborting Query has been aborted, and changes are being rolled
back.
Active Query is running.
Chapter 18 Query Monitor
238 Teradata Viewpoint User Guide, Release 14.01](https://image.slidesharecdn.com/2206user14-01-130625135151-phpapp02/85/2206-user-14-01-238-320.jpg)


![3 Select Change Priority.
4 Log on to Teradata Database, if prompted.
5 Click Next.
6 From the list of accounts that have been assigned to the user, select an account to copy
the account name to the Edit new account string box.
7 [Optional] Edit the account string or enter a new account string.
8 Click Next.
9 Select one of the following:
• Move just this query to change the priority of the selected query.
• Move this query and all future queries associated with this session to change the
priority of the selected query and all subsequent queries in the current session.
10 Click Next.
11 Click Next to confirm your selection.
Changing the Workload of a Query or Session
For Teradata Database systems, you can change the workload of a query or session to allow
higher priority workloads to run or to balance workload resources.
This menu item is only available when workloads are enabled and the system being
monitored supports this feature.
1 Click the row of the query you want to change.
2 Click .
3 Select Change Workload.
4 Log on to Teradata Database, if prompted.
5 Click Next.
6 Select a different workload from the list and click Next.
7 Select one of the following:
• Move just this query to change the selected query.
• Move this query and all future queries associated with this session to change the
priority of the selected query and all subsequent queries in the current session.
8 Click Next.
9 Click Next to confirm your selection.
10 Click OK.
Releasing a Query
For Teradata Database systems, you can release a query from the delay queue for immediate
processing.
1 Click the row of the query you want to change.
2 Click .
Chapter 18 Query Monitor
250 Teradata Viewpoint User Guide, Release 14.01](https://image.slidesharecdn.com/2206user14-01-130625135151-phpapp02/85/2206-user-14-01-250-320.jpg)
![3 Select Release Query.
4 Log on to Teradata Database, if prompted.
5 Click Next.
6 Click Next to confirm your selection.
Changing Multiple Sessions
For Teradata Database systems, you can change system resources for multiple sessions,
users, or account strings in the following locations:
• All sessions table from the summary view
• My Criteria sessions table from the summary view
• User sessions table from the details view
• Account strings table from the details view
• Utility table from the details view
1 Select By Session in the selection menu and one of the following choices:
• All
• My Criteria
2 [Optional] Access user or account string tables from the details view.
a Click a session.
b Click the USER or ACCOUNT link under SESSION INFO.
3 Select a session action from the Table Actions menu.
Check boxes appear next to the sessions.
4 Do one of the following:
• Select the check box in the column heading to select all sessions.
• Select the check boxes for specific sessions.
5 Select Next.
6 Log on to Teradata Database, if prompted.
7 Follow the instructions on subsequent screens.
About the Preferences View
The PREFERENCES view allows you to customize the way query and session information is
displayed in portlet views.
From the portlet frame, click to access the PREFERENCES view and then use one or
more of the following tabs to customize your preferences.
Display
For Teradata Database systems, choose formatted or unformatted SQL to display in
the SQL tab. Display or hide the top sessions graph, state filter bar, and session list
in the portlet.
Chapter 18 Query Monitor
Teradata Viewpoint User Guide, Release 14.01 251](https://image.slidesharecdn.com/2206user14-01-130625135151-phpapp02/85/2206-user-14-01-251-320.jpg)
![For Teradata Aster systems, display or hide the state filter bar and session list in the
portlet.
Criteria
For Teradata Database systems, set the criteria values used to display sessions in the
My Criteria view. After setting the criteria value and enabling a metric, any query
exceeding the criteria value appears in the sessions table in the My Criteria view.
Selecting Display Options
Use the Display tab in the PREFERENCES view to display or hide the Top Session Graph,
State Filter Bar, or Session List in the portlet, and select a format for the SQL.
1 From the portlet frame, click to access the PREFERENCES view.
2 Click the Display tab.
3 [Optional] Click Clear Defaults to clear all user-defined default settings created for this
portlet.
4 Do one of the following for Teradata Database systems:
• Select the Top Sessions Graph check box to display the top session graph in the
portlet.
• Clear the Top Sessions Graph check box to hide the top sessions graph in the portlet.
5 Do one of the following:
• Select the State Filter Bar check box to display the state filter bar in the portlet.
• Clear the State Filter Bar check box to hide the state filter bar in the portlet.
6 Do one of the following:
• Select the Session List check box to display the session list in the summary table in
the portlet.
• Clear the Session List check box to hide the session list in the summary table in the
portlet.
7 Do one of the following for Teradata Database systems:
• Select the Format SQL check box to use formatted SQL.
• Clear the Format SQL check box to use unformatted SQL.
8 [Optional] Select the Use these settings as defaults check box to use the current settings
in all PREFERENCES tabs as the default configuration each time you add this portlet to
a portal page.
9 Click OK.
Selecting Threshold Criteria
For Teradata Database systems, use the Criteria tab in the PREFERENCES view to set the
criteria values used to display sessions in the My Criteria view. If any enabled metric exceeds
the threshold value, the session is displayed when the metric is also selected in the Columns
dialog box.
1 From the portlet frame, click to access the PREFERENCES view.
Chapter 18 Query Monitor
252 Teradata Viewpoint User Guide, Release 14.01](https://image.slidesharecdn.com/2206user14-01-130625135151-phpapp02/85/2206-user-14-01-252-320.jpg)
![2 Click the Criteria tab.
3 [Optional] Click Clear Defaults to clear all user-defined default settings created for this
portlet.
4 Enter threshold values for each metric you want tested.
5 Select the metrics you want enabled.
6 [Optional] Select the Use these settings as defaults check box to use the current settings
in all PREFERENCES tabs as the default configuration each time you add this portlet to
a portal page.
7 Click OK.
Chapter 18 Query Monitor
Teradata Viewpoint User Guide, Release 14.01 253](https://image.slidesharecdn.com/2206user14-01-130625135151-phpapp02/85/2206-user-14-01-253-320.jpg)


![Wildcard or
Symbol Description Example Results
< Use this symbol to match any number that is less than the
specified value. This symbol is only used to perform
mathematical comparisons.
For columns containing percentages, avoid using % in the
filter. Type only < and the number.
<60 59, 58, 50, 8, and so forth
<= Use these symbols in conjunction to match values less than
or equal to the specified number.
For columns containing percentages, avoid using % in the
filter. Type only <= and the number.
<=60 60, 59, 58, 50, 8, and so forth
! Use this symbol at the beginning of your search to match
alpha or numeric characters that do not contain the alpha
or numeric characters.
This symbol can be used in conjunction with any other
symbol or wildcard character.
!cat33 cat32, cat34, and so forth
Clearing Filters
You can clear the filter box values from the table.
1 Do one of the following:
Option Description
Clear
individual
filter boxes
a. Click on the filter box.
Clear all
filter boxes
a. Select Clear Filters at the bottom of the portlet.
Configuring Columns to Display
Use the Columns dialog box to set thresholds and select, lock, and order columns. You can
resize columns in the table. The thresholds and column selection, order, and lock settings
that you choose are applied to the minimized and maximized views separately.
1 Click in the table header and select Configure Columns.
2 In the Columns dialog box, select the check boxes of columns to display.
Mouse over the name to see the complete name.
3 [Optional] Click next to the column name.
The columns at the top of the list can be locked in the table to remain on the left when
scrolling horizontally.
4 [Optional] Click Set, type a threshold value, and click OK.
Chapter 19 Query Spotlight
258 Teradata Viewpoint User Guide, Release 14.01](https://image.slidesharecdn.com/2206user14-01-130625135151-phpapp02/85/2206-user-14-01-258-320.jpg)
![Values exceeding the threshold are highlighted and displayed in the table.
5 [Optional] Click and drag the row to reorder the column.
6 Click Apply to save the changes.
7 [Optional] In the table, drag the column heading border in either direction to resize
the column.
Exporting Table Data
You can export data to a .csv file for further analysis and formatting. The exported .csv file
contains all available data. If filters are used, only filtered data is exported. The format for the
time, date, and some numeric values differs in the view and exported .csv file.
1 Click in the table header and select Export.
2 Save the file using the browser options.
The file is saved to your download area or to a location that you specify, depending on
the browser settings.
Query Spotlight View Metrics
Metrics appearing in the queries table can be selected using the Columns dialog box.
Metrics available for monitoring and display are listed below.
Metric Description Type
CPU Skew CPU skew during the last sample Percent
Duration How long the query has been running Number
End Time that the query stopped running on Teradata Database Number
Host Host ID or LAN ID associated with the PE that processed the
logon request for the session
Number
Impact CPU CPU time in seconds of the highest CPU utilized AMP during
the collection interval times the total number of AMPs
participating for this session during the last session collection
interval
Number
I/O Skew I/O skew during the last sample Percent
PJI Ratio of the CPU milliseconds per I/O for the query, where a
larger Product Join Index number indicates system
performance degradation
Number
Req CPU Number of CPU seconds needed to run the query Number
Req I/O Number of disk I/Os performed to run the query Number
Req Number Number of the specific request Number
Session ID Unique session identifier Number
Spool Amount of spool space the query requires Number
Start Time that the query started running on Teradata Database Number
Chapter 19 Query Spotlight
Teradata Viewpoint User Guide, Release 14.01 259](https://image.slidesharecdn.com/2206user14-01-130625135151-phpapp02/85/2206-user-14-01-259-320.jpg)


![2 Drag the start-time handle until the intended start time is displayed in the time frame.
3 Drag the end-time handle until the intended end time is displayed in the time frame.
4 [Optional] Drag the date-range handle left or right to move the start-time and end-time
handles in unison.
Selecting a Metric to Graph
You can select different metrics to graph. The metrics contain historical details you can use
to investigate queries.
1 Click next to the metric name.
2 Select a metric from the menu.
About Query Spotlight and Rewind
The Query Spotlight portlet cannot rewind and does not use the rewind toolbar. The
Control Rewind button in the Query Spotlight portlet is a toggle that enables portal rewind
for portlets that support the rewind function on the same page. When rewind is enabled, the
time marker in Query Spotlight sets the time and date in the rewind toolbar and controls the
time and date for data in the other portlets. This allows you to investigate how metrics
compare across portlets during the same time frame.
When Control Rewind is toggled off, the time marker no longer controls the date and time
for data in the other portlets and portal rewind is controlled from the rewind toolbar.
Enabling and Using Rewind Control
The time marker is a vertical line in the graph with small triangles at the top and bottom. Its
position represents a point in time and controls rewind for the portlets that support the
rewind function. The time marker appears green when Control Rewind is enabled and you
interact with it.
1 From the Details View, click Control Rewind located below the graph in the middle of
the page.
The icon in the Control Rewind button turns green and the rewind toolbar appears.
2 Click or drag the time marker to a specific point in time.
Chapter 19 Query Spotlight
262 Teradata Viewpoint User Guide, Release 14.01](https://image.slidesharecdn.com/2206user14-01-130625135151-phpapp02/85/2206-user-14-01-262-320.jpg)
![3 [Optional] Drag the time marker to another point in time.
Disabling Rewind Control
The icon in the Control Rewind button is green and the rewind toolbar is displayed with
rewind is enabled.
1 Click Control Rewind.
The in the Control Rewind button turns gray. The time marker no longer controls
the time and date in the rewind toolbar, and portal rewind is controlled from the rewind
toolbar.
About the Overview Tab
The Overview tab provides detailed information about key metrics for the selected session
and its queries. The metric values provide a view of the query status on the system. Metrics
that exceed defined thresholds are highlighted.
Metric Description Type
Total Duration How long the query has run, displayed as hh:mm:ss Number
User Name of the user that submitted the query Character
Account Account of the user that submitted the query Character
Req Number Number of I/O operations the query performed Number
Req CPU Total CPU usage time, in seconds, consumed by the query Number
Req I/O Number of I/O operations the query performed Number
Req Max Spool Amount of spool space the query requires Number
Source Source details, such as application name, IP address, and host
user name
Character
About the SQL Tab
The SQL tab displays the SQL for the selected query. This information is read-only. Click
to export the SQL as a .txt file. The tab is only available when a query is active, blocked, or
delayed.
For Teradata Database systems, the tab is only available when a query meets certain
thresholds established by the Teradata Viewpoint Administrator.
About the Explain Tab
The Explain tab displays an abbreviated version of the Step statistics and Explain text that
result from an Explain request in an SQL session. Each Explain step is uniquely identified
with a number, where the background of the number box indicates status. This information
is read-only. The tab is only available when a query meets certain thresholds established by
the Teradata Viewpoint Administrator. Click to export the Explain data as a .csv file.
Chapter 19 Query Spotlight
Teradata Viewpoint User Guide, Release 14.01 263](https://image.slidesharecdn.com/2206user14-01-130625135151-phpapp02/85/2206-user-14-01-263-320.jpg)
![Workload Information Description
• Request - Query is assigned manually to a workload using
Change Workload
• Session - Queries initiated in that session are assigned
manually to a workload using Change Workload
This field is empty if this is not a DBC/SQL session or if Teradata
Workload Management Category 3 is disabled.
VPart Name of the virtual partition in SLES 11
I/O Decay Most severe level of I/O resource access restriction for queries in a
Timeshare workload in SLES 11
I/O Exception Nodes Number of nodes that exceeded the tactical I/O usage exception
criteria for the session in a Tactical workload in SLES 11
Time Marker Description Type
Time Location Temporal location of the time marker within the Explain step Number
Step Location Explain step in which the time marker is located Number
About the Preferences View
The PREFERENCES view allows you to set thresholds to filter query data and customize the
way query list information is displayed in the portlet view.
From the portlet frame, click to access the PREFERENCES view and the Criteria tab.
Criteria
Specify threshold criteria to limit the number of queries shown in the query table.
After enabling a metric filter and setting the criteria value, any query exceeding the
criteria value appears in the query table if it is also selected in the Columns dialog
box.
Selecting Threshold Criteria
Use the Criteria tab in the PREFERENCES view to set the criteria values used to display
queries in the QUERY SPOTLIGHT view. If any enabled metric exceeds the threshold value,
the query is displayed when the metric is also selected in the Columns dialog box.
1 From the portlet frame, click to access the PREFERENCES view.
2 [Optional] Click Clear Defaults to clear all user-defined default settings created for this
portlet.
3 Enter threshold values for each metric you want tested.
4 Select the metrics you want enabled.
5 [Optional] Select the Use these settings as defaults check box to use the current settings
in all PREFERENCES tabs as the default configuration each time you add this portlet to
a portal page.
Chapter 19 Query Spotlight
266 Teradata Viewpoint User Guide, Release 14.01](https://image.slidesharecdn.com/2206user14-01-130625135151-phpapp02/85/2206-user-14-01-266-320.jpg)


![8 [Optional] From the input line, use your keyboard up and down arrows to access
previous commands.
The commands are temporarily saved and available as long as you are running the
utility. After disconnecting from the utility, the commands are cleared.
Note: After approximately 30 minutes of inactivity in the portlet, the Teradata Database
connection times out, and you must reconnect to the utility and Teradata Database.
About the Remote Console Menus and Toolbar
The menus and toolbar allow you to specify the display attributes of the REMOTE
CONSOLE view.
Use the selection menus to:
• Select or search for a system.
• Select or search for a utility.
Use Clear Console to clear the content from the console.
Use Disconnect to disconnect from the utility and Teradata Database.
Selecting a System and Utility
You can use selection menus above the toolbar to choose a system and utility to monitor in
the portlet, starting with the highest level menu on the far left. You must select a system and
utility before you can submit commands and see the output in the console.
1 In the selection menu, click the currently selected system name to display a list of
available systems.
2 Enter the name of the system in the Search box or select a system from the menu.
The Search box is not case sensitive. If you cannot find the correct system, press the
Backspace key on your keyboard until you find the system you want in the list.
As you type, the list shows the systems that match your filter criteria.
3 Click Next.
4 Enter the name of the utility in the Search box or select a utility from the menu.
The Search box is not case sensitive. If you cannot find the correct utility, press the
Backspace key on your keyboard until you find the utility you want in the list.
As you type, the list shows the utilities that match your filter criteria.
5 Click Next.
Clearing the Console
1 From the summary view, click Clear Console.
The contents of the console no longer appear.
Chapter 20 Remote Console
Teradata Viewpoint User Guide, Release 14.01 271](https://image.slidesharecdn.com/2206user14-01-130625135151-phpapp02/85/2206-user-14-01-271-320.jpg)

![Utility Description
Recovery
Manager
Display information used to monitor progress of a Teradata Database recovery.
Show Locks Display locks placed by archive and recovery, and by table rebuild operations on
databases and tables.
Teradata DWM
Dump
Display information about active Teradata Dynamic Workload Manager
(Teradata DWM) rules on a Teradata Database system.
Vproc Manager Manage the vprocs including obtaining the status of specified vprocs, initializing
vprocs, forcing a vproc to restart, and forcing a Teradata Database restart.
Information on how to use a majority of these utilities is located in Utilities. Information on
how to use Teradata DWM Dump is in Teradata Dynamic Workload Manager User Guide.
Information on how to use Operator Console is in Graphical User Interfaces: Database
Window and Teradata MultiTool. Experienced utilities users can refer to the simplified
command descriptions in Utilities Quick Reference which provides the syntax diagrams for
each Teradata Database utility.
You can access these documents at: http://www.info.teradata.com.
About the Preferences View
The PREFERENCES view allows you to change the console text and background colors.
From the portlet frame, click to access the PREFERENCES view.
Setting the Display Background
Use the Display tab in the PREFERENCES view to change the console text and the display
background to light or dark.
1 From the portlet frame, click to access the PREFERENCES view.
2 Click the Display tab.
3 [Optional] Click Clear Defaults to clear all user-defined default settings created for this
portlet.
4 Change the color of the text and background by selecting one of the following options:
• Light text on dark background
• Dark text on light background
5 [Optional] Select the Use these settings as defaults check box to use the current settings
in all PREFERENCES tabs as the default configuration each time you add this portlet to
a portal page.
6 Click OK.
Chapter 20 Remote Console
Teradata Viewpoint User Guide, Release 14.01 273](https://image.slidesharecdn.com/2206user14-01-130625135151-phpapp02/85/2206-user-14-01-273-320.jpg)


![Option Description
Configuring Columns to Display
Use the Columns dialog box to set thresholds and select, lock, and order columns. You can
resize columns in the table. The thresholds and column selection, order, and lock settings
that you choose are applied to the minimized and maximized views separately.
1 Click in the table header and select Configure Columns.
2 In the Columns dialog box, select the check boxes of columns to display.
Mouse over the name to see the complete name.
3 [Optional] Click next to the column name.
The columns at the top of the list can be locked in the table to remain on the left when
scrolling horizontally.
4 [Optional] Click Set, type a threshold value, and click OK.
Values exceeding the threshold are highlighted and displayed in the table.
5 [Optional] Click and drag the row to reorder the column.
6 Click Apply to save the changes.
7 [Optional] In the table, drag the column heading border in either direction to resize
the column.
Exporting Table Data
You can export data to a .csv file for further analysis and formatting. The exported .csv file
contains all available data. If filters are used, only filtered data is exported. The format for the
time, date, and some numeric values differs in the view and exported .csv file.
1 Click in the table header and select Export.
2 Save the file using the browser options.
The file is saved to your download area or to a location that you specify, depending on
the browser settings.
Space Usage Metrics
Metrics that appear in summary table can be customized using the Columns dialog box.
Availability of metrics depends on the system and selection menu options you choose.
Teradata Database System Metrics
By Database
The selection menu choice By Database makes the following metrics available.
Chapter 21 Space Usage
Teradata Viewpoint User Guide, Release 14.01 281](https://image.slidesharecdn.com/2206user14-01-130625135151-phpapp02/85/2206-user-14-01-281-320.jpg)


![Report Details
View space usage information for tables, such as the current space used, or the peak
perm space used by the user.
About the Preferences View
From the portlet frame, click to access the PREFERENCES view. Set the threshold values
for the perm, spool, and temp space buttons in the toolbar. Preferences are applied to the By
Database report for Teradata Database systems. Customize the way information is
displayed in the SPACE USAGE and details views.
Setting Filter Thresholds and Display Options
For Teradata Database systems, you can set thresholds for the By Database report and
customize the way information is displayed.
1 From the portlet frame, click to access the PREFERENCES view.
2 [Optional] Click Clear Defaults to clear all user-defined default settings created for this
portlet.
3 Enter threshold values for buttons in the Threshold Filter Bar for the By Database
report.
4 Select the Define KB, MB and GB as multiples of 1,000 instead of 1,024 check box to
change the display in the SPACE USAGE and details views.
5 [Optional] Select the Use these settings as defaults check box to use the current settings
in all PREFERENCES tabs as the default configuration each time you add this portlet to
a portal page.
Chapter 21 Space Usage
Teradata Viewpoint User Guide, Release 14.01 285](https://image.slidesharecdn.com/2206user14-01-130625135151-phpapp02/85/2206-user-14-01-285-320.jpg)


![About Query Statements
You can enter single- or multi-statement SQL queries using Data Definition Language
(DDL), Data Control Language (DCL), or Data Manipulation Language (DML) statements
in the query box.
DDL statements
Begin with SQL keywords, such as CREATE, ALTER, DROP, DELETE, MODIFY,
HELP, SHOW, SET, REPLACE.
DCL statements
Begin with SQL keywords GRANT, REVOKE, GIVE.
DML statements
Begin with SQL keywords, such as SELECT, INSERT, UPDATE.
For single-statement queries, enter the query, optionally followed by a semicolon. For multi-
statement queries, each statement must end with a semicolon.
Cancelling a Long-Running Query
Occasionally, a query may take longer to execute than you expected. You can cancel the
query before it completes.
1 Click Cancel in the results tab to stop a single, long-running query.
Saving All Queries
You can save all queries that you enter in the query box for reuse in current or future
sessions.
1 Click the list next to Run and select Save All Queries.
2 In the ENTER QUERY NAME dialog box, enter a name for your set of queries.
3 Click Save.
4 [Optional] Click Load and click the Saved tab to view your set of saved queries.
Saving Selected Query
You can save one or more adjacent queries that you typed in the query box for reuse in
current or future sessions.
1 In the query box, highlight one or more complete query statements you want to save.
When you select more than one adjacent query statement to save, highlight each
statement, including the final semicolon.
2 Click the list next to Run and select Save Selected Query.
3 In the ENTER QUERY NAME dialog box, enter a name for the selection.
4 Click Save.
5 [Optional] Click Load and click the Saved tab to view your saved query selection.
Chapter 22 SQL Scratchpad
Teradata Viewpoint User Guide, Release 14.01 289](https://image.slidesharecdn.com/2206user14-01-130625135151-phpapp02/85/2206-user-14-01-289-320.jpg)

![Results for each statement in the query appear in a separately numbered Query tab. Results
for a single-statement query appear in the Query 1 tab. Results for multi-statement queries
appear in additional tabs. For example, if you submit three statements, results appear in the
Query 1, Query 2, and Query 3 tabs.
Viewing Query Results
You can view results for queries that you submit in the Query tabs.
1 Click the Query tab corresponding to your query listed in the query box.
A table with the results of your query appears in the Results tab.
Pinning Query Results
You can pin query results for later reuse in the session. If you do not pin the Query tab, new
queries overwrite results currently displayed in the tab.
1 Click the Query tab that contains the query you want to pin and click .
The tab name changes from Query to Pinned. The tab retains its number. Query results
remain pinned until you unpin the tab or disconnect from the Teradata Database
system.
2 [Optional] Click to unpin your query.
The tab name changes from Pinned to Query. The results displayed in the results tab are
cleared when you submit another query.
Exporting Table Data
You can export data to a .csv file for further analysis and formatting. The exported .csv file
contains all available data. The format for the time, date, and some numeric values differs in
the view and exported .csv file.
1 Click in the table header and select Export.
2 Save the file using the browser options.
The file is saved to your download area or to a location that you specify, depending on
the browser settings.
About the Results Tab
The Results tab provides detailed information about your query results. To view more
columns in a wide results tab, drag the scroll box to the right. This information is read-only.
About the SQL Tab
The SQL tab displays the SQL for the selected query. This information is read-only.
About the Explain Tab
The Explain tab displays an abbreviated version of the Step statistics and Explain text that
result from an Explain request in an SQL session. Each Explain step is uniquely identified
with a number where the background of the number box indicates status. This information
is read-only. The tab is only available when a query meets certain thresholds established by
the Teradata Viewpoint Administrator.
Chapter 22 SQL Scratchpad
Teradata Viewpoint User Guide, Release 14.01 291](https://image.slidesharecdn.com/2206user14-01-130625135151-phpapp02/85/2206-user-14-01-291-320.jpg)


![4 [Optional] Enter filter criteria in the box under the Teradata Database system to find
databases or users containing the criteria.
5 Click next to the database object type in the tree to expand that sub-branch.
6 [Optional] Enter filter criteria in the box under the object type to find objects containing
the criteria.
7 Click to highlight the object name.
8 Click Insert Object to copy the qualified object name to the query box.
The object name is inserted in the query box after the cursor location.
9 Click Close.
Example of Inserting an Object into a Query
If you select the table object Accounts of the DBC database in the Teradata Database system
DEV1, the selected identifier is inserted as a qualified object name into the query box.
1 Click DEV1 to open the directory tree.
2 Click DBC to open a database sub-branch of the directory tree. DBC is a database
identifier for the DEV1 system.
3 Click Tables to open all table objects under the DBC sub-branch.
4 Click Accounts in the sub-branch to select the table. Accounts is the identifier of a
particular table in the DBC database for the DEV1 system.
5 Click Insert Object to copy the qualified name to the query box.
DBC.Accounts appears after the cursor in the query box.
About the History Tab
The History tab provides the following information in the table or in mouseover text for
queries submitted in the current session:
• Date and time of the query
• Complete SQL statement
• Amount of time to complete the query
• Number of rows processed
For longer SQL statements, click to display the complete query.
You can click Load to copy the query to the query box, for later reuse or editing.
Viewing Previously Run Queries
You can view a table of queries submitted in the current session. You can load a query from
the table for reuse in the same session.
1 Click Load and click the History tab.
The History tab provides the following information in the table or in mouseover text on
queries submitted in the current session:
• Date and time of the query
Chapter 22 SQL Scratchpad
294 Teradata Viewpoint User Guide, Release 14.01](https://image.slidesharecdn.com/2206user14-01-130625135151-phpapp02/85/2206-user-14-01-294-320.jpg)
![• Complete SQL statement
• Amount of time to complete the query
• Number of rows processed
2 Click Close.
Loading a Previously Run Query
You can copy a query submitted in the current session to the query box for reuse or editing.
1 Click Load and click the History tab.
2 In the query history table, click Load for the query you want to run.
The query is copied to the query box and the History tab closes.
3 [Optional] Edit the query before running it.
4 Click Close.
About the Saved Tab
The History tab provides the following information on queries saved in the current or
previous sessions:
• Name of the saved query
• Complete SQL statement
For longer SQL statements, click to display the complete query.
You can click Load to copy the query to the query box, for later reuse or editing. You can
also click to delete a saved query.
Viewing Saved Queries
You can view a table of queries that you saved. You can also load a query from the table for
reuse in the current or future sessions.
1 Click Load and click the Saved tab.
The name of the query and the SQL statement appear in the table of saved queries.
2 Click Close.
Loading a Saved Query
You can load a saved query into the query box for reuse or editing.
1 Click Load and click the Saved tab.
2 In the table of saved queries, click Load for the query you want to run.
The query is copied to the query box and the Saved tab closes.
3 [Optional] Edit the query in the query box before running it.
4 Click Close.
Chapter 22 SQL Scratchpad
Teradata Viewpoint User Guide, Release 14.01 295](https://image.slidesharecdn.com/2206user14-01-130625135151-phpapp02/85/2206-user-14-01-295-320.jpg)


![1 From the portlet frame, click to access the PREFERENCES view.
2 Click the Systems tab.
3 [Optional] Click Clear Defaults to clear all user-defined default settings created for this
portlet.
4 Select the check boxes of systems to display.
5 [Optional] Select the Use these settings as defaults check box to use the current settings
in all PREFERENCES tabs as the default configuration each time you add this portlet to
a portal page.
6 Click OK.
Selecting the System Health Icon Style
Use the Icons tab in the PREFERENCES view to select the icon style to display in the
SYSTEM HEALTH view.
1 From the portlet frame, click to access the PREFERENCES view.
2 Click the Icons tab.
3 [Optional] Click Clear Defaults to clear all user-defined default settings created for this
portlet.
4 Select the icon style to use in the SYSTEM HEALTH view.
5 [Optional] Select the Use these settings as defaults check box to use the current settings
in all PREFERENCES tabs as the default configuration each time you add this portlet to
a portal page.
6 Click OK.
Setting the System Health Trend Interval
Use the Trend Interval tab in the PREFERENCES view to set the length of time used to
plot the sparklines in the SYSTEM HEALTH DETAILS view. This interval applies to all
metrics selected for this view.
The Example pane provides a sample of how the SYSTEM HEALTH view might look after
the change.
1 From the portlet frame, click to access the PREFERENCES view.
2 Click the Trend Interval tab.
3 [Optional] Click Clear Defaults to clear all user-defined default settings created for this
portlet.
4 From the Interval list, select an interval.
5 [Optional] Select the Use these settings as defaults check box to use the current settings
in all PREFERENCES tabs as the default configuration each time you add this portlet to
a portal page.
6 Click OK.
Chapter 23 System Health
Teradata Viewpoint User Guide, Release 14.01 301](https://image.slidesharecdn.com/2206user14-01-130625135151-phpapp02/85/2206-user-14-01-301-320.jpg)


![Metric Description Type
Spool Usage Stddev Standard deviation of amount of spool in bytes the query
used
Number
Performance Metrics
The Canary Queries collector gathers performance metrics. Performance metrics are
calculated as an average.
Metric Description Type
Response Time Average response time in milliseconds of the selected canary
query
Number
Rows Returned Average number of rows returned by the selected canary
query
Number
About the Preferences View
The PREFERENCES view allows you to customize the portlet to monitor key metric trends
to determine if you are getting value from your Teradata Database system. Only one system
can be selected for each portlet instance.
From the portlet frame, click to access the PREFERENCES view and then use one or
more of the following tabs to customize your preferences.
System
Select a Teradata Database system to monitor.
Metrics
Select appropriate metrics, by category, for display in the view, and set values for
highlighting metrics beyond a specified threshold. Metric values that exceed the
threshold are displayed in the exception color.
Sampling Interval
Specify the time periods from which statistics are displayed. Set the number of hours
(up to 999) prior to the current time, and define a comparison period up to 999
weeks in the past.
Selecting a System to Monitor
Use the System tab in the PREFERENCES view to select a Teradata Database system to
monitor. Only one system can be selected for each portlet instance.
1 From the portlet frame, click to access the PREFERENCES view.
2 Click the System tab.
3 [Optional] Click Clear Defaults to clear all user-defined default settings created for this
portlet.
4 Select a system from the list.
Chapter 24 Today's Statistics
306 Teradata Viewpoint User Guide, Release 14.01](https://image.slidesharecdn.com/2206user14-01-130625135151-phpapp02/85/2206-user-14-01-306-320.jpg)
![5 [Optional] Select the Use these settings as defaults check box to use the current settings
in all PREFERENCES tabs as the default configuration each time you add this portlet to
a portal page.
6 Click OK.
Setting Metric Thresholds
Use the Metrics tab in the PREFERENCES view to select a metrics category to monitor and
to set thresholds to trigger the highlighting of values that exceed the thresholds.
1 From the portlet frame, click to access the PREFERENCES view.
2 Click the Metrics tab.
3 [Optional] Click Clear Defaults to clear all user-defined default settings created for this
portlet.
4 Select a metrics category.
When the Canary Queries collector is the source for a metric, the data displayed is
always the heartbeat query for the selected system.
5 In the Metric column, select check boxes for the metrics you want to monitor in the
view.
6 [Optional] For each metric selected, enter a Threshold value.
Values exceeding the threshold are highlighted in the view using the exception color.
7 [Optional] Select the Use these settings as defaults check box to use the current settings
in all PREFERENCES tabs as the default configuration each time you add this portlet to
a portal page.
8 Click OK.
Setting the Sampling Interval
Use the Sampling Interval tab in the PREFERENCES view to set the length of time used to
calculate the statistics shown in the TODAYS STATISTICS view. The Sampling Interval
applies to all metrics selected for display.
1 From the portlet frame, click to access the PREFERENCES view.
2 Click the Sampling Interval tab.
3 [Optional] Click Clear Defaults to clear all user-defined default settings created for this
portlet.
4 Enter the number of hours (up to 999) in the Statistics will be sampled during the last
X hour(s).
The value you enter determines the sampling interval for columns 2 and 3 of the
TODAYS STATISTICS view.
5 Enter the since sampling interval as follows:
a Select the time of day that begins the interval.
b Select Today or Yesterday from the list box.
Chapter 24 Today's Statistics
Teradata Viewpoint User Guide, Release 14.01 307](https://image.slidesharecdn.com/2206user14-01-130625135151-phpapp02/85/2206-user-14-01-307-320.jpg)
![This value pair defines a start time up to 48 hours in the past for calculating column 4 of
the TODAYS STATISTICS view.
6 Enter a value for the comparison period, up to 999 weeks in the past.
The value you enter defines the number of weeks in the past for calculating column 5 of
the TODAYS STATISTICS view.
7 [Optional] Select the Use these settings as defaults check box to use the current settings
in all PREFERENCES tabs as the default configuration each time you add this portlet to
a portal page.
8 Click OK.
Chapter 24 Today's Statistics
308 Teradata Viewpoint User Guide, Release 14.01](https://image.slidesharecdn.com/2206user14-01-130625135151-phpapp02/85/2206-user-14-01-308-320.jpg)


![1 Mouse over the graph to display the time marker.
2 Move the time marker with the mouse to change the display of day and hour.
3 [Optional] Select a grade from the list to show proportion of cylinders, allocated by
temperature, for the grade.
4 [Optional] Select a time period from the list to show proportion of cylinders, allocated
by temperature, over the previous week or month.
Viewing Cylinder Allocation by Temperature and Grade
The Cylinder Allocation by Temperature and Grade view displays the current
relationships between data temperature, storage grade, and space type. Change the display
of the matrix and the Space Types by Cylinder Percentage table to see allocation metrics
for a specific combination of temperature, grade, or space.
The percent values that are displayed in the matrix for this view indicate the percentage of
the total of non-allocated space of the selected cylinder type.
1 Select a cylinder-allocation space type from the list above the matrix to display a space
type in the matrix and space-types table.
2 To filter the data shown in the space-types table, do one of the following:
a Click a row label (HOT, WARM, COLD) in the matrix to filter the space-types table
by data temperature allocation.
b Click a column label (SLOW, MEDIUM, FAST) in the bottom row of the matrix to
filter the space-types table by storage grade.
c Click any cell in the matrix to filter the space-types table by temperature-grade
combination.
3 Select a temperature, grade, or temperature-grade combination from the list in the
space-types table to filter space types by temperature, grade, or temperature-grade
combination.
Chapter 25 TVS Monitor
Teradata Viewpoint User Guide, Release 14.01 311](https://image.slidesharecdn.com/2206user14-01-130625135151-phpapp02/85/2206-user-14-01-311-320.jpg)


![The Export button allows you to create a .csv file containing selected data.
Exporting Metrics
You can export data to a .csv file for further analysis and formatting. The exported .csv file
contains data for the selected time period. The minimum, average, and maximum is exported
for all metrics configured in the PREFERENCES view.
1 In the toolbar, click a time-range button.
Option Frequency
1 hour Data points at 1 minute intervals
1 day Data points at 15 minute intervals
1 week Data points at 1 hour intervals
1 mo Data points at 4 hour intervals
3 mo Data points at 12 hour intervals
6 mo Data points at a 1 day interval
2 Click .
3 Save the file using the browser options.
The file is saved to your download area or to a location that you specify, depending on
the browser settings.
4 [Optional] Reformat exported data to match the format in the view.
Viewpoint Monitoring Metrics
The following metrics can be used to analyze resource usage.
CPU Metrics
Metric Description Type
CPU Idle Percent of total CPU time spent idle Percent
CPU Involuntary Wait Percent of total CPU time spent waiting involuntarily Percent
CPU I/O Wait Percent of total CPU time spent waiting for I/O Percent
CPU System Percent of total CPU time used by system processes Percent
CPU User Percent of total CPU time used by user processes Percent
CPU Usage Percent of CPU time used by user and system processes Percent
Memory Metrics
Metric Description Type
Memory Buffers Amount of memory currently used as a disk buffer cache KB
Memory Cache Amount of cache memory KB
Memory Free Amount of idle memory KB
Chapter 26 Viewpoint Monitoring
318 Teradata Viewpoint User Guide, Release 14.01](https://image.slidesharecdn.com/2206user14-01-130625135151-phpapp02/85/2206-user-14-01-318-320.jpg)

![Adding Metrics
You can add metrics that are plotted in the graph.
1 From the portlet frame, click to access the PREFERENCES view.
2 [Optional] Select the ENABLE check box to enable the metric for display.
3 [Optional] Select a system from the list.
The SYSTEM list is available when more than one Teradata Viewpoint server is enabled
for the Data Collection Service.
4 Select a metric from the list.
You can add or remove metrics. Up to 10 metrics can be listed.
5 [Optional] Enter a THRESHOLD value.
6 [Optional] Enter a VERTICAL AXIS RANGE value.
7 [Optional] Click and drag the row to reorder the metrics for display.
8 [Optional] Select the Use these settings as defaults check box to use the current settings
in all PREFERENCES tabs as the default configuration each time you add this portlet to
a portal page.
9 Click OK.
Changing the Metrics Display Order
You can change the order of the metrics that are listed below the graph. Reordering the
metric list affects which color is assigned to the metric.
1 From the portlet frame, click to access the PREFERENCES view.
2 Click the Metrics tab.
3 [Optional] Click Clear Defaults to clear all user-defined default settings created for this
portlet.
4 On the metric row, click and drag the row to its new location.
5 [Optional] Select the Use these settings as defaults check box to use the current settings
in all PREFERENCES tabs as the default configuration each time you add this portlet to
a portal page.
6 Click OK.
Enabling and Disabling Metrics
You can enable and disable metrics from the graph. When a metric is disabled, the metric
plot line is not displayed in the graph; however, data points are still being collected, so the
metric is included in the list under the graph and can be reactivated at a later time.
1 From the portlet frame, click to access the PREFERENCES view.
2 [Optional] Click Clear Defaults to clear all user-defined default settings created for this
portlet.
3 Do one of the following:
Chapter 26 Viewpoint Monitoring
320 Teradata Viewpoint User Guide, Release 14.01](https://image.slidesharecdn.com/2206user14-01-130625135151-phpapp02/85/2206-user-14-01-320-320.jpg)
![• Clear ENABLE on the metric line to disable the metric.
• Select ENABLE on the metric line to enable the metric.
4 [Optional] Select the Use these settings as defaults check box to use the current settings
in all PREFERENCES tabs as the default configuration each time you add this portlet to
a portal page.
5 Click OK.
Deleting Metrics
You can delete metrics from the graph. When a metric is deleted in the PREFERENCES
view, the metric plot line is not displayed in the graph, and the metric is not included in the
list.
1 From the portlet frame, click to access the PREFERENCES view.
2 Select the Metrics tab.
3 [Optional] Click Clear Defaults to clear all user-defined default settings created for this
portlet.
4 Click on the metric row of the metric you want to delete.
The metric row disappears.
5 [Optional] Select the Use these settings as defaults check box to use the current settings
in all PREFERENCES tabs as the default configuration each time you add this portlet to
a portal page.
6 Click OK.
Chapter 26 Viewpoint Monitoring
Teradata Viewpoint User Guide, Release 14.01 321](https://image.slidesharecdn.com/2206user14-01-130625135151-phpapp02/85/2206-user-14-01-321-320.jpg)


![Activate
Makes the ruleset the active ruleset on the Teradata server.
Copy to Working Rulesets
Copies the ruleset to the Working section.
Delete
Removes the ruleset from the Teradata server.
Active
The Active section contains the active ruleset on the Teradata server. If you have permission,
the only available option is to Deactivate the current ruleset. In SLES 11, the deactivate
option is not available because there must always be an active ruleset.
Creating a Ruleset
A ruleset is a complete collection of related filters, throttles, events, states, and workload
rules. You can create multiple rulesets, but only one ruleset is active on the Teradata server at
a time. After creating a ruleset, you can use the toolbar buttons to specify settings, such as
states, sessions, and workloads. New rulesets are automatically locked so only the owner can
edit the ruleset.
1 From the WORKLOAD DESIGNER view, select a system from the list.
2 Click Create.
3 Enter a ruleset name.
4 [Optional] Enter a description.
5 Click Save.
6 [Optional] Specify settings using the tabs in the General view, such as Intervals and
Bypass.
7 [Optional] Click States and create a state matrix.
8 [Optional] Click Sessions and create any of the following:
• Query Sessions
• Utility Limits
• Utility Sessions
9 [Optional] Click Filters and create a filter.
10 [Optional] Click Throttles and create a system throttle.
11 [Optional] Click Workloads and create a workload.
12 [Optional] Click Exceptions and create an exception.
Editing a Ruleset
In the WORKLOAD DESIGNER view, you can edit ruleset properties. The Teradata
Viewpoint Administrator must grant your role permission to edit rulesets so you can
complete this action. Without permission to edit the ruleset, the menu option is View and
the ruleset view is read-only.
Chapter 27 Workload Designer
326 Teradata Viewpoint User Guide, Release 14.01](https://image.slidesharecdn.com/2206user14-01-130625135151-phpapp02/85/2206-user-14-01-326-320.jpg)
![1 From the WORKLOAD DESIGNER view, select a system from the list.
2 In the local Working section, click the ruleset name.
3 Specify settings using the toolbar buttons and tabbed views.
4 Click Save after making changes in each view.
Cloning a Ruleset
You can clone a ruleset to make an exact copy of the ruleset, except for the name and
description. Cloning is a convenient way to create a ruleset using the criteria of an existing
ruleset as a base.
1 From the WORKLOAD DESIGNER view, select a system from the list.
2 In the local Working section, click the ruleset and click Clone.
An exact copy of the ruleset is made, and the General view appears.
3 Enter a name.
4 [Optional] Enter a description.
5 Click Save.
6 Specify additional settings using the toolbar buttons and tabbed views.
7 Click Save.
Deleting a Ruleset
Deleting a ruleset removes the ruleset and all associated information. The Teradata
Viewpoint Administrator must grant your role permission to edit rulesets so you can
complete this action.
1 From the WORKLOAD DESIGNER view, select a system from the list.
2 In the local Working section or the system Ready section, click the ruleset , and click
Delete.
3 Click Delete.
The ruleset is deleted from the section.
Importing a Ruleset
The import and export options can be used to copy a ruleset from one system to another.
The Teradata Viewpoint Administrator must grant your role permission to edit rulesets so
you can complete this action. Only rulesets exported from Workload Designer and a
Teradata Database of the same release can be imported.
1 From the WORKLOAD DESIGNER view, select a system from the list.
2 Click Import.
3 Enter a name for the imported ruleset.
4 Click Browse.
5 Locate and select the saved ruleset file.
Chapter 27 Workload Designer
Teradata Viewpoint User Guide, Release 14.01 327](https://image.slidesharecdn.com/2206user14-01-130625135151-phpapp02/85/2206-user-14-01-327-320.jpg)
![Note: Exported ruleset files might be stored in the download area configured for your
browser.
6 Click Save.
Exporting a Ruleset
The import and export options can be used to copy a ruleset from one system to another. The
Teradata Viewpoint Administrator must grant your role permission to edit rulesets so you
can complete this action. Only rulesets exported from Workload Designer and a Teradata
Database of the same release can be imported.
1 From the WORKLOAD DESIGNER view, select a system from the list.
2 In the local Working section, click the ruleset , and click Export.
3 Click Save.
The ruleset file is saved to your download area or the location you specify, depending on
your browser settings.
Showing All Criteria in a Ruleset
You can display a read-only summary of all settings and state-specific values for a single
ruleset.
1 From the WORKLOAD DESIGNER view, select a system from the list.
2 In the local Working section, click the ruleset , and click Show All.
3 [Optional] Do any of the following:
• Click Collapse All to hide all sections of the view.
• Click Print to print the full summary.
• Click the section name to show or hide individual sections of the view.
Copying a Ruleset to the Teradata System
When you are finished editing a ruleset in the Working section, copy the ruleset to the
Ready section on the Teradata system. The Teradata Viewpoint Administrator must grant
your role permission to edit rulesets so you can complete this action. After copying a ruleset
to the Ready section, you can make the ruleset the active ruleset on the Teradata system.
Note: Copying a ruleset to a Teradata system that is under heavy load could take longer than
expected.
1 From the WORKLOAD DESIGNER view, select the Teradata system containing the
ruleset you want to copy.
2 In the Working section, click the ruleset , and click Make Ready.
Activating a Ruleset
Activating a ruleset copies the ruleset to the active state on the selected system. Only one
ruleset is active on the system at a time. A ruleset activated from the local Working section is
copied to the Ready section before being made active. The Teradata Viewpoint
Administrator must grant your role permission to edit rulesets so you can complete this
action.
Chapter 27 Workload Designer
328 Teradata Viewpoint User Guide, Release 14.01](https://image.slidesharecdn.com/2206user14-01-130625135151-phpapp02/85/2206-user-14-01-328-320.jpg)


![5 [Optional] Enter a filter string in the Filter box to limit your choices.
6 Select a source from the list or select multiple sources by using Ctrl or Shift.
7 Click Add Selection to add your selections to the bypass list.
8 [Optional] Repeat steps 4 through 7 to add sources to the bypass list.
9 [Optional] Mouse over a source in the bypass list, and click to include it in system-
level filters and throttles.
10 Click Save.
Enabling Timeshare Decay
In SLES 11, you can enable timeshare decay.
Timeshare decay automatically decreases the resource access rate of queries in a Timeshare
workload over time. Enabling decay prevents problematic queries from monopolizing
system resources.
1 Edit or create a ruleset.
2 From the ruleset toolbar, click General.
3 Click the Decay tab.
4 Click the Enable Timeshare Decay check box.
5 Click Save.
Setting Limits and Reserves
In SLES 11, you can set limits and reserves for each planned environment.
1 Edit or create a ruleset.
2 From the ruleset toolbar, click General.
3 Click the Limits/Reserves tab.
4 Select a planned environment.
5 Define limits on CPU Utilization and I/O for the planned environment.
6 Define tactical reserves for tactical workloads in the planned environment.
7 Click Save.
About Ruleset States
A state is the intersection of a health condition and a planned environment. A health
condition is composed of unplanned events and a planned environment is composed of
planned events. Creating states provides greater control over how the system allocates
resources. When a health condition and a planned environment intersect, the resulting state
triggers system changes.
The SLES 10 and SLES 11 IWM systems have no options for custom states, health conditions,
planned environments, or state-specific values for query sessions, filters, and throttles. IWM
Chapter 27 Workload Designer
332 Teradata Viewpoint User Guide, Release 14.01](https://image.slidesharecdn.com/2206user14-01-130625135151-phpapp02/85/2206-user-14-01-332-320.jpg)

![4 Define at least one unplanned event.
An unplanned event is a system event, user-defined event, workload event, or a
combination of these events.
5 Drag the unplanned event to the appropriate health condition so the event triggers the
health condition.
6 Define at least one planned environment.
7 Define at least one planned event.
A planned event is a period event, user-defined event, or a combination of these events.
8 Drag the planned event to the appropriate planned environment so the event triggers the
environment.
9 Define at least one state.
10 For each cell in the state matrix, drag and drop a state from the States list into the
appropriate cell of the matrix.
When the defined combination occurs, the state is triggered.
11 Click Save.
Defining Health Conditions
Health conditions define levels of system health and are used to reallocate system resources
when an event degrades the system. When at least one unplanned event occurs, a health
condition can be triggered. The default health condition is Normal, and it is used if no other
health conditions are triggered. The Normal health condition always remains at the top. The
lowest severity is listed at the top. The highest severity is at the bottom. If multiple unplanned
events are active at the same time, the health condition with the highest severity is triggered.
1 Edit or create a ruleset.
2 From the ruleset toolbar, click States.
3 Mouse over Health Conditions, and click .
A health condition is added with the default name newCond.
4 Mouse over the health condition and click .
5 Enter a name for the health condition.
6 Enter a minimum duration, in seconds, for the health condition.
The event that triggers the change to the health condition must remain above the trigger
threshold for the minimum duration you enter before the health condition goes into
effect. Setting minimum duration prevents short incidents of an event from triggering a
change in the health condition.
7 Click OK.
8 [Optional] Mouse over a health condition name and click to delete a health condition.
9 Click Save.
Defining System Events in the State Matrix
A system event is an unplanned event, such as a down node. Incorporating system events into
health conditions within the state matrix gives you greater control over the actions Teradata
Chapter 27 Workload Designer
334 Teradata Viewpoint User Guide, Release 14.01](https://image.slidesharecdn.com/2206user14-01-130625135151-phpapp02/85/2206-user-14-01-334-320.jpg)
![Database takes when unexpected events occur. To create an event that only sends out a
notification, create the event, but do not assign it to any health condition. When the event
occurs, the notification action you specified is triggered.
1 Edit or create a ruleset.
2 From the ruleset toolbar, click States.
3 Mouse over Unplanned Events, and click .
4 Click next to Available Events.
5 Select System Event.
6 Enter a name.
7 [Optional] Enter a description.
8 Select a System Event Type from the list.
Maximum and minimum limits must be positive integers.
9 [Optional] Select a qualification option to prevent very short incidents from triggering
an event.
10 [Optional] Under Notifications, enable any of the following options for the start or the
end of the event:
Option Description
Send Alert Specifies the action to trigger.
Run Program Specifies the Alerts registered programs to trigger.
Post to QTable The string you enter is posted to the QTable.
11 Click OK.
12 [Optional] Drag the event under a specific health condition.
When the event occurs, it triggers the health condition.
13 Click Close.
14 Click Save.
System Event Type Options
System event type options are available in the following versions of Teradata Database:
Event Types Description 12.0 13.0 13.10 14.00
Node Down Maximum allowed number of nodes
down in a clique, defined as a
percentage between 0 and 100. The
default is 24%.
Available Available Available Available
AMP Fatal Maximum number of AMPs reported
as fatal at system startup.
Available Available Available Available
Chapter 27 Workload Designer
Teradata Viewpoint User Guide, Release 14.01 335](https://image.slidesharecdn.com/2206user14-01-130625135151-phpapp02/85/2206-user-14-01-335-320.jpg)

![2 From the ruleset toolbar, click States.
3 Mouse over Unplanned Events and click .
4 Click next to Available Events.
5 Select Workload Event.
6 Enter a name.
7 [Optional] Enter a description.
8 Select a Workload.
9 Select a Workload Event Type from the list.
10 Define a threshold for the Workload Event Type.
Maximum and minimum limits must be positive integers.
11 [Optional] Select a qualification option to prevent very short incidents from triggering
an event.
12 [Optional] Under Notifications, enable any of the following options for the start or the
end of the event:
Option Description
Send Alert Specifies the action to trigger.
Run Program Specifies the Alerts registered programs to trigger.
Post to QTable The string you enter is posted to the QTable.
13 Click OK.
14 [Optional] Drag the event under a specific health condition.
When the event occurs, it triggers the health condition.
15 Click Close.
16 Click Save.
Workload Event Type Options
You can define thresholds for workload event types. When a threshold is met or exceeded,
the associated workload event occurs. Maximum and minimum limits must be positive
integers. The following event types are available:
Event Types Description
Active Requests Defines maximum or minimum number of queries that can be active at one
time. Active Requests are not available for utility workloads.
Arrivals Defines maximum or minimum per-second arrival rate for queries. Arrivals
are not available with utility workloads.
AWT Wait Time Defines minimum time a step in a request can wait to acquire an AWT.
CPU Utilization Defines maximum or minimum CPU usage for a query.
Chapter 27 Workload Designer
Teradata Viewpoint User Guide, Release 14.01 337](https://image.slidesharecdn.com/2206user14-01-130625135151-phpapp02/85/2206-user-14-01-337-320.jpg)
![Event Types Description
Delay Queue
Depth
Defines minimum number of queries in the delay queue.
Delay Queue Time Defines a minimum for the time a request can be in the delay queue. The
threshold can include or exclude system throttle delay time.
SLG Response
Time
Triggers an event based on the Response Time SLG set for the workload.
Available only if a Response Time SLG is set for the workload.
SLG Throughput Triggers an event based on the Throughput SLG set for the workload.
Available only if a Throughput SLG is set for the workload.
Note: Some workload event types allow you to set a qualification time. Setting qualification
times can prevent very short incidents from triggering events. The qualification time is
checked at the end of each interval.
Qualification Time
Options
Description
Simple Specifies how long an event threshold must be met before an event is triggered.
Immediate Specifies that an event is triggered immediately after an event threshold is met.
Averaging Specifies how long the rolling average of the metric value must meet the event
threshold before an event is triggered.
Defining Planned Environments
Planned environments are used to reallocate system resources during scheduled times.
Planned environments are triggered when at least one associated planned event occurs. The
default planned environment is Always and it cannot be deleted or moved. The order of
precedence is from lowest to highest, reading from left to right. The planned environment
with the highest precedence is activated if multiple planned events are active at the same
time.
1 Edit or create a ruleset.
2 From the ruleset toolbar, click States.
3 Mouse over Planned Environments and click .
A planned environment is added with the default name newEnv.
4 Mouse over the planned environment and click .
5 Enter a name.
6 Click outside the name.
7 Click a planned environment name and drag the name to the left or right in the list to
change the order of precedence, if multiple planned environments exist.
8 [Optional] Mouse over the environment name and click to delete a planned
environment.
You cannot delete the Always environment.
9 Click Save.
Chapter 27 Workload Designer
338 Teradata Viewpoint User Guide, Release 14.01](https://image.slidesharecdn.com/2206user14-01-130625135151-phpapp02/85/2206-user-14-01-338-320.jpg)
![Defining Period Events in the State Matrix
A period event is a planned event occurring on specific days and times, such as month-end
financial processing. Use periodic events to manage events that happen on a recurring basis.
To create an event that only sends out a notification, create the event, but do not assign it to
any planned environment. When the event occurs, the notification action you specified is
triggered.
1 Edit or create a ruleset.
2 From the ruleset toolbar, click States.
3 Mouse over Planned Events, and click .
4 Click next to Available Events.
5 Select Period Event.
6 Enter a name.
7 [Optional] Enter a description.
8 [Optional] Select Create New Corresponding Planned Environment to automatically
create a planned environment that this event triggers.
9 Select Day of Week or Day of Month, and click a single day or multiple days.
10 [Optional] Select Month of Year, and click one or more months.
11 [Optional] Select Start Time, and enter a start and end time.
12 [Optional] Select Wrap around midnight to have a time range spanning midnight for a
period event.
13 [Optional] Under Notifications, enable any of the following options for the start or the
end of the event:
Option Description
Send Alert Specifies the action to trigger.
Run Program Specifies the Alerts registered programs to trigger.
Post to QTable The string you enter is posted to the QTable.
14 Click OK.
15 [Optional] Drag the event under a planned environment.
16 Click Close.
17 Click Save.
Wrap around Midnight Example
When creating period events, use the Wrap around midnight option to have a time range
spanning midnight.
If the From time of a period event is later than the To time, two time segments are available:
midnight until the To time and the From time until midnight. When Wrap around
midnight is not selected, the period event is in effect for segment 1 and segment 2 on each
Chapter 27 Workload Designer
Teradata Viewpoint User Guide, Release 14.01 339](https://image.slidesharecdn.com/2206user14-01-130625135151-phpapp02/85/2206-user-14-01-339-320.jpg)
![specified day. When Wrap around midnight is selected, the event is in effect for segment 2
on each specified day and for segment 1 on each day following the specified day.
For example, specify that a period event occurs on Mondays and Tuesdays with a From time
of 17:00 and a To time of 08:00.
If Wrap around midnight is not selected:
Monday Tuesday Wednesday
Midnight—08:00 (time segment 1) Yes Yes No
08:00—17:00 No No No
17:00—23:59 (time segment 2) Yes Yes No
If Wrap around midnight is selected:
Monday Tuesday Wednesday
Midnight—08:00 (time segment 1) No Yes Yes
08:00—17:00 No No No
17:00—23:59 (time segment 2) Yes Yes No
Defining User-Defined Events in the State Matrix
A user-defined event can be planned or unplanned. To create an event that only sends out a
notification, create the event, but do not assign it to any planned or unplanned environment.
When the event occurs, the notification action you specified is triggered.
1 Edit or create a ruleset.
2 From the ruleset toolbar, click States.
3 Mouse over Unplanned Events or Planned Events, and click .
4 Next to Available Events, click .
5 Select User Defined Event.
6 Enter a name.
7 [Optional] Enter a description.
8 [Optional] Select Create New Corresponding Planned Environment to automatically
create a planned environment that this event triggers.
This step can be taken if you are creating the user-defined event as a planned event.
9 Under Activate/Deactivate Event, copy the appropriate SQL request text.
10 Paste the text into an SQL script.
11 [Optional] Under Notifications, enable any of the following options for the start or the
end of the event:
Option Description
Send Alert Specifies the action to trigger.
Chapter 27 Workload Designer
340 Teradata Viewpoint User Guide, Release 14.01](https://image.slidesharecdn.com/2206user14-01-130625135151-phpapp02/85/2206-user-14-01-340-320.jpg)
![Option Description
Run Program Specifies the Alerts registered programs to trigger.
Post to QTable The string you enter is posted to the QTable.
12 Click OK.
13 [Optional] Do one of the following:
• For unplanned events, drag the event under a health condition.
• For planned events, drag the event under a planned environment.
14 Click Close.
15 Click Save.
Defining Event Combinations in the State Matrix
An event combination is a mix of two or more different events, such as period, system, and
user-defined events. Event combinations can be planned or unplanned. To create an event
that only sends out a notification, create the event, but do not assign it to any planned
environment. When the event occurs, the notification action you specified is triggered.
1 Edit or create a ruleset.
2 From the ruleset toolbar, click States.
3 Mouse over Unplanned Events or Planned Events, and click .
4 Next to Available Events, click .
5 Select Event Combination.
6 Enter a name.
7 [Optional] Enter a description.
8 [Optional] If you are creating the combination event as a planned event, you can select
Create New Corresponding Planned Environment to automatically create a planned
environment that this event triggers.
9 Add available events and operators to build the formula representing the combination of
events that must occur to trigger the event. For example, Node Down OR Batch
Processing, or NOT PEI.
When creating event combinations, avoid placing two operators or two events next to
each other. When an event combination is valid, the background of the Event
Combination Formula text box is white. If a combination is invalid, the background is
orange.
10 [Optional] Under Notifications, enable any of the following options for the start or the
end of the event:
Option Description
Send Alert Specifies the action to trigger.
Run Program Specifies the Alerts registered programs to trigger.
Chapter 27 Workload Designer
Teradata Viewpoint User Guide, Release 14.01 341](https://image.slidesharecdn.com/2206user14-01-130625135151-phpapp02/85/2206-user-14-01-341-320.jpg)
![Option Description
Post to QTable The string you enter is posted to the QTable.
11 Click OK.
12 [Optional] Do one of the following:
• For unplanned events, drag the event under a health condition.
• For planned events, drag the event under a planned environment.
13 Click Close.
14 Click Save.
Defining States in the State Matrix
You can create a state to control how resources are allocated in different health condition
and planned environment combinations.
1 Edit or create a ruleset.
2 From the ruleset toolbar, click States.
3 Mouse over States at the top of the states list and click .
A state is added to the list with the default name NewState.
4 Mouse over the state name and click .
5 Enter a name.
6 Click outside the name.
7 [Optional] Mouse over the state name and click to edit a state name.
8 Click Save.
Mapping States in the State Matrix
After creating a state, you can map it in the state matrix to control how resources are
allocated when different health condition and planned environment combinations occur. By
default, the cell in the upper left corner of the state matrix is assigned the Normal health
condition, the Always environment, and the Base state. This cell cannot be changed. All
other cells in the matrix must be associated with a single state. Any state, including the Base
state, can be used in multiple cells.
1 Edit or create a ruleset.
2 From the ruleset toolbar, click States.
3 Drag and drop a state name from the States list to a matrix cell to map a state in the state
matrix.
Chapter 27 Workload Designer
342 Teradata Viewpoint User Guide, Release 14.01](https://image.slidesharecdn.com/2206user14-01-130625135151-phpapp02/85/2206-user-14-01-342-320.jpg)
![4 [Optional] Mouse over the state name in the States list and click to view details about
a state.
5 Click Save.
Mapping Events in the State Matrix
If you have created events in the state matrix, you can combine the events with health
conditions and planned environments for greater control of Teradata Database. Create the
health conditions and planned environments that you need before mapping events in the
state matrix.
1 Edit or create a ruleset.
2 From the ruleset toolbar, click States.
3 Map a planned event:
a Mouse over Planned Events, and click .
b In Available Events, drag and drop an event from the list into one or more of the
Planned Environment columns.
c [Optional] Click next to Available Events to create a planned event.
4 To map an unplanned event:
a Mouse over Unplanned Events, and click .
b In Available Events, drag an event from the list and drop it into one or more of the
Health Condition rows.
c [Optional] Click next to Available Events to create an unplanned event.
5 Click Close.
6 Click Save.
Deleting States from the State List
If a state is not used in the state matrix, you can remove it from the State list.
Chapter 27 Workload Designer
Teradata Viewpoint User Guide, Release 14.01 343](https://image.slidesharecdn.com/2206user14-01-130625135151-phpapp02/85/2206-user-14-01-343-320.jpg)

![rule. In Teradata Database 12.0 and 13.0, when adding the target classification type to filters
and throttles, an Add button is available instead of the Include and Exclude buttons. In
Teradata Database 12.0, when adding the target classification type to workloads, all specified
criteria can be either included or excluded. In Teradata Database 12.0, wildcards are not
available in Match String.
1 Click Filters, Throttles, or Workloads.
2 Select or create an item.
3 Click the Classification tab.
4 Select a target criteria or add one.
5 Select a Target Type from the list.
6 [Optional] Select a database from the list for Table, View, Macro, or Stored Procedure
target types.
7 Do at least one of the following:
• Enter a Match String and use the Include and Exclude buttons to add the match
string. A match string can contain ? to match exactly one character or * to match
zero or more characters.
• Select Items from the list and use the Include and Exclude buttons to create your
classification criteria.
8 [Optional] To add subcriteria, mouse over an item in the Selected list, click , and
choose from the following:
Option Description
Full Table Scan Includes or excludes all-row scans
Join Type Selects a type
Minimum Step Row Count Sets minimum rows at each step
Maximum Step Row Count Sets maximum rows at each step
Minimum Step Time Sets minimum time at each step
9 If you specified subcriteria, click Apply.
The icon appears next to target items containing subcriteria.
10 Click OK.
About Query Characteristic Classification Type
The query characteristic classification type describes a query by answering such questions as
what does the query do and how long will the query run.
Consider the following when using query characteristics to classify information:
• After a characteristic is selected, its value can be edited.
• Many characteristics have minimum and maximum values that can be set independently.
You can set all values above the minimum, below the maximum, or between a minimum
and a maximum.
Chapter 27 Workload Designer
Teradata Viewpoint User Guide, Release 14.01 347](https://image.slidesharecdn.com/2206user14-01-130625135151-phpapp02/85/2206-user-14-01-347-320.jpg)


![on at one time. After the query session is created, additional controls in the Query Sessions
tab allow you to clone, delete, enable, or disable the query session. View all created query
sessions on the Query Sessions by State tab.
1 Edit or create a ruleset.
2 From the ruleset toolbar, click Sessions.
3 Click the Query Sessions tab.
4 Click Create Query Session.
5 Enter a name.
6 [Optional] Enter a description.
7 Select a Rule Type from the list:
• Select Collective if you want all users that meet the classification criteria treated as a
group, with the group allowed a maximum number of queries.
• Select Individual if you want to apply limits to each user individually.
• Select Member if you want accounts or profiles that represent user groups used as the
classification criteria for the rule. Limits are placed on each individual in the group,
and no limit is placed on the account or group.
8 Click Save.
9 Click the Classification tab.
10 Add classification criteria.
11 Click Save.
12 Click the State Specific Settings tab.
13 Set state-specific session limits.
14 Click Save.
Setting Classification for Query Sessions
Add classification settings to existing query sessions or when creating a query session.
Classification options determine which sessions are associated with the query session.
1 Edit or create a ruleset.
2 From the ruleset toolbar, click Sessions.
3 Click the Query Sessions tab.
4 Select a query session or create one.
5 Click the Classification tab.
6 Click Add Criteria.
7 In Source Type, click and select one of the following:
Option Description
Account Name Teradata Database account name
Chapter 27 Workload Designer
Teradata Viewpoint User Guide, Release 14.01 351](https://image.slidesharecdn.com/2206user14-01-130625135151-phpapp02/85/2206-user-14-01-351-320.jpg)
![Option Description
Account String Teradata Database account identification string
Profile Teradata Database profile name
Application Application on the network client
Client IP Address IP address of the network client
Client ID Logon name on the network client
8 Do at least one of the following:
• Enter a Match String and use the Include and Exclude buttons to add the match
string. A match string can contain ? to match exactly one character or * to match zero
or more characters.
• Select Items from the list and use the Include and Exclude buttons to create your
classification criteria.
9 Click OK.
Setting State-Specific Values for Query Sessions
Add state-specific settings to existing query sessions or when creating a query session.
You can override the default by specifying session limits on a per-state basis. For example,
you might want to have session limits during high-traffic states and no session limits during
low-traffic states. View all created query sessions on the Query Sessions By State tab.
1 Edit or create a ruleset.
2 From the ruleset toolbar, click Sessions.
3 Click the Query Sessions tab.
4 Select a query session or create one.
5 Click the State Specific Settings tab.
6 Mouse over a state and click .
7 Select Create State Specific Settings.
8 Select Unlimited, or enter a session limit in the box.
9 Click OK.
Your selection is applied to each cell having that state, and overrides the setting specified
in Default Settings.
10 [Optional] Change the default setting by selecting Unlimited, or enter a session limit
number in the box.
11 Click Save.
Creating a Utility Limit
A utility limit determines the number and type of utility jobs that can be run at one time.
After the utility limit is created, additional controls in the Utility Limits tab allow you to
clone, delete, and enable or disable the utility limit.
Chapter 27 Workload Designer
352 Teradata Viewpoint User Guide, Release 14.01](https://image.slidesharecdn.com/2206user14-01-130625135151-phpapp02/85/2206-user-14-01-352-320.jpg)
![1 Edit or create a ruleset.
2 From the ruleset toolbar, click Sessions.
3 Click the Utility Limits tab.
4 Click Create Utility Limit.
5 Enter a name.
6 [Optional] Enter a description.
7 In Teradata Database 12.0, you can select Reject utilities that exceed limit to abort any
utilities that exceed the limit.
If you do not select this option, utilities are delayed.
8 Click Save.
9 Click the Classification tab.
10 Select the utilities to which the limit should be applied.
When a utility limit is created, several utilities are selected by default. The default
utilities can be cleared.
11 Click Save.
12 Click the State Specific Settings tab.
13 Define utility limits for specific states.
14 Click Save.
Setting Classification for Utility Limits
Add classification settings to existing utility limits or when creating a utility limit.
Classification options determine which sessions are associated with a utility limit.
1 Edit or create a ruleset.
2 From the ruleset toolbar, click Sessions.
3 Click the Utility Limits tab.
4 Select a utility limit or create one.
5 Click the Classification tab.
6 Do one of the following:
• Select a utility type, such as FastLoad or FastExport.
• Select multiple utility types.
• Select a specific version, such as Backup/Archive/Restore.
• Select a combination of utility types and versions.
In Teradata Database 12.0 and 13.0, the only option is to select one utility type.
7 Click Save.
Setting State-Specific Job Limits for Utility Limits
Set state-specific job limits for existing utility limits or when creating a utility limit.
Chapter 27 Workload Designer
Teradata Viewpoint User Guide, Release 14.01 353](https://image.slidesharecdn.com/2206user14-01-130625135151-phpapp02/85/2206-user-14-01-353-320.jpg)
![You can override the default by setting job limits on a per-state basis. For example, you
might want to raise the job limit during a low-traffic state, and lower the job limit during a
high-traffic state.
1 Edit or create a ruleset.
2 From the ruleset toolbar, click Sessions.
3 Click the Utility Limits tab.
4 Select a utility limit or create one.
5 Click the State Specific Settings tab.
6 [Optional] Do any of the following:
Option Description
Set a default job limit for the
utility limit in all states
a. Under Default Settings, select Job Limit.
b. Enter a number in the box.
c. In Teradata Database 13.0 or later, select Delay or Reject.
Set a job limit for the utility
limit in a specific state
a. Mouse over a state and click .
b. Select Create State Specific Settings.
c. Select Job Limit.
d. Enter a number in the box.
e. In Teradata Database 13.0 or later, select Delay or Reject.
f. Click OK.
7 Click Save.
Creating a Utility Session
You can create a utility session in Teradata Database 13.10 or later. A utility session controls
the number of sessions that are allowed to be logged on to each utility at one time. After the
utility session is created, additional controls in the Utility Sessions tab allow you to clone,
delete, and enable or disable the utility session.
1 Edit or create a ruleset.
2 From the ruleset toolbar, click Sessions.
3 Click the Utility Sessions tab.
4 Click Create Utility Session.
5 Enter a name.
6 [Optional] Enter a description.
7 Do one of the following:
Option Description
Session-Based
Utilities
a. Select Session Based Utilities.
b. Select the utilities to which this session limit applies.
c. From the list, select Data Size.
Chapter 27 Workload Designer
354 Teradata Viewpoint User Guide, Release 14.01](https://image.slidesharecdn.com/2206user14-01-130625135151-phpapp02/85/2206-user-14-01-354-320.jpg)

![1 Edit or create a ruleset.
2 From the ruleset toolbar, click Sessions.
3 Click the Utility Sessions Evaluation Order tab.
4 Drag rules to reorder the list of utility rules.
5 Click Save.
About Ruleset Filters
A filter rejects a query before the query starts running. You can specify filters when creating
or editing a ruleset. Add criteria to each filter that identifies the queries to which the filter
should be applied. When creating or editing a ruleset, filters are specified by clicking Filters
in the ruleset toolbar. After creating a filter, you can specify the states to which you want the
filter applied.
Following are examples of using filters:
• Create a filter that prohibits a specific user from running a query with an estimated
processing time of longer than 15 minutes.
• Create a filter to limit all members of a specific department that runs large reports from
accessing the database during peak work hours.
Creating a Filter
A filter rejects user queries.
1 Edit or create a ruleset.
2 From the ruleset toolbar, click Filters.
3 Click Create Filter.
4 Enter a name.
5 [Optional] Enter a description.
6 [Optional] In Teradata Database 12.0 and 13.0, select Global Rule - applies to all
requests to apply global filters to all objects and to all logon and query requests that meet
the criteria of the rule.
If Global Rule - applies to all requests is selected, the request source and target
classification types are not available. If the request source or target classification types are
used, the Global Rule - applies to all requests option is not available.
7 [Optional] Select Warning Only to have a warning message for the filter logged by the
database.
The queries still run when a warning is logged.
8 Click Save.
9 Click the Classification tab.
10 Add and save classification criteria.
Include classification items in a filter to reject those items. For example, create a filter and
add classification criteria to reject all queries from the finance department.
Chapter 27 Workload Designer
356 Teradata Viewpoint User Guide, Release 14.01](https://image.slidesharecdn.com/2206user14-01-130625135151-phpapp02/85/2206-user-14-01-356-320.jpg)

![6 Click Add.
7 Specify options based on the classification criteria you selected.
8 If you selected Request Source or Target, do at least one of the following:
• Enter a Match String and use the Include and Exclude buttons to add the match
string. A match string can contain ? to match exactly one character or * to match zero
or more characters.
• Select Items from the list and use the Include and Exclude buttons to create your
classification criteria.
9 Click OK.
Setting State-Specific Values for Filters
Add state-specific settings to existing filters or when creating a filter.
You can override the default by enabling or disabling the filter on a per-state basis. For
example, you may want to leave a filter enabled under all circumstances except when a
specific state occurs.
1 Edit or create a ruleset.
2 From the ruleset toolbar, click Filters.
3 Select a filter or create one.
4 Click the State Specific Settings tab.
5 Mouse over a state and click .
6 Select Create State Specific Settings.
7 Select Filter is Enabled or Filter is Disabled.
8 Click OK.
Your selection is applied to each cell having that state, and overrides the settings specified
in Default Settings.
9 [Optional] Change the default setting by selecting Filter is Enabled or Filter is Disabled.
10 Click Save.
About Ruleset Throttles
A throttle limits the number of user queries that can be active at the same time. When
creating or editing a ruleset, you can specify throttles. Throttles are different from filters,
which reject queries. After the throttle limit is reached, the workload adds new queries to the
delay queue.
The following are examples of throttles:
• A throttle that limits a specific user to running no more than 10 queries at a time.
• A throttle that limits a specific department to no more than 4 simultaneous queries.
When creating or editing a ruleset, throttles are specified by clicking Throttles in the ruleset
toolbar.
Chapter 27 Workload Designer
358 Teradata Viewpoint User Guide, Release 14.01](https://image.slidesharecdn.com/2206user14-01-130625135151-phpapp02/85/2206-user-14-01-358-320.jpg)
![After creating a ruleset throttle, you can specify the throttle limits for each state.
Creating Throttles
Throttles limit the number of user queries that can be active at the same time. This is
different from filters, which reject queries and prevent them from running at all.
1 Edit or create a ruleset.
2 From the ruleset toolbar, click Throttles.
3 Click Create Throttle.
4 Enter a name.
5 [Optional] Enter a description.
6 Select a Rule Type:
• Select Collective if you want all users that meet the classification criteria treated as a
group, with the group allowed a maximum number of queries.
• Select Individual if you want to apply limits to each user individually.
• Select Member if you want accounts or profiles that represent user groups used as the
classification criteria for the rule. Limits are placed on individuals in the group and
no limit is placed on the account or group.
• In Teradata Database 12.0 and 13.0, you can select Global if you want all queries
placed in a single queue. If Global is selected, the request source and target
classification types are not available. If request source or target classification type is
used, the Global Rule option is not available.
7 [Optional] Select Disable Manual Release or Abort to prevent Teradata Database
Administrators from aborting or releasing throttled queries in the queue.
8 [Optional] In Teradata Database 12.0, select Reject throttled queries to abort throttled
queries.
9 Click Save.
10 Click the Classification tab.
11 Add and save classification criteria.
12 Click the State Specific Settings tab.
13 Define query limits for specific states.
14 Click OK.
15 Click Save.
Throttle Classification Criteria
Throttles for query characteristics classification criteria are available in the following
versions of Teradata Database.
Filter Options 12.0 13.0 13.10 14.00
Statement Type Available Available Available Available
AMP Limits Available Available Available Available
Chapter 27 Workload Designer
Teradata Viewpoint User Guide, Release 14.01 359](https://image.slidesharecdn.com/2206user14-01-130625135151-phpapp02/85/2206-user-14-01-359-320.jpg)

![2 From the ruleset toolbar, click Throttles.
3 Select a system throttle or create one.
4 Select the State Specific Settings tab.
5 In When Query Limit Exceeded, select Delay or Reject.
This option is available in Teradata Database 12.0.
6 Mouse over a state and click .
7 Select Create State Specific Settings.
Note: If you select the Use Default Settings option, the settings at the bottom of the
Throttles tab apply to the state.
8 Do one of the following:
• Next to Query Limit, select Unlimited to place no limits on the number of queries
for this throttle.
• Enter a query limit number in the box, and select either Delay or Reject. The Delay
and Reject options are available in Teradata Database 13.0 or later.
• Next to Session Limit, select Unlimited or enter a session-limit number in the box.
These options are available in Teradata Database 12.0 and 13.0.
9 Click OK.
Your selection is applied to each cell having that state, and overrides the setting specified
in Default Settings.
10 [Optional] Change the Default Settings by selecting Unlimited, or enter a query limit
number in the box and select Delay or Reject.
The Delay and Reject options are available in Teradata Database 13.0 or later.
11 [Optional] Change the Session Limit by selecting Unlimited or entering a session limit
number in the box.
This option is available in Teradata Database 12.0 and 13.0.
12 Click Save.
About Ruleset Workloads
A ruleset workload is a group of queries that share characteristics so that a set of workload
management controls can be applied to the group. A workload has working values and
defining characteristics that are evaluated during the classification phase of system
management. High-quality workload management can improve response times and ensure
more consistent response times for critical work. The SLES 11 IWM system has no options
for the SLG Tiers workload management method. The IWM system only uses the Tactical
and Timeshare management methods.
The Workloads tab lists workload names, types, throttle limits, and enabled status. For each
workload, you can specify one or more of the following:
• Classification criteria that determine if a query is assigned to the workload
• Throttles that limit the number of concurrent active queries that can run
• Service level goals that specify a goal for workload query performance
Chapter 27 Workload Designer
Teradata Viewpoint User Guide, Release 14.01 361](https://image.slidesharecdn.com/2206user14-01-130625135151-phpapp02/85/2206-user-14-01-361-320.jpg)
![• Exceptions that monitor queries and take specified actions if a query exceeds exception
criteria while executing
You can create up to 250 workloads. The following requests are examples of workloads:
• Batch jobs further subdivided by region or organization for reporting
• Weekly or monthly reports that follow the calendar or a regular schedule
• Jobs that are always critical whenever they occur
Queries not classified into a specific workload are placed into the default workload named
WD-Default. The WD-Default workload cannot be deleted or disabled.
A workload cannot be deleted if it has associated workload events. Workload events for a
workload are created in the state matrix.
Creating and Editing a Workload
You can group queries that share characteristics into a workload so that a set of workload
management controls can be applied to the group.
1 Edit or create a ruleset.
2 From the ruleset toolbar, click Workloads.
3 Click Create Workload.
4 In the General tab, enter a name.
5 [Optional] Enter a description.
6 [Optional] In SLES 11, click Virtual Partitions and assign the workload to a virtual
partition.
7 Select an Enforcement Priority or a Workload Management Method.
Operating
System
Description
SLES 10 Select an Enforcement Priority for the type of queries you expect to run in this
workload.
• Tactical queries are short, critical queries that have a defined service level
goals. They are typically single or few-AMP queries or all-AMP queries that
consume less than 1 CPU-second per node.
• Priority queries are important and higher priority than most other work.
• Normal queries are the average priority work running on the system.
• Background queries run for work that does not have a response time
requirement.
SLES 11 Select a Workload Management Method.
• Tactical queries are short and high-priority. They have access to all available
resources.
• SLG Tier queries have access to the resources that remain after Tactical
resource demands are met. (Not available with SLES 11 IWM.) SLG Tier
workloads are assigned to the lowest available tier.
Chapter 27 Workload Designer
362 Teradata Viewpoint User Guide, Release 14.01](https://image.slidesharecdn.com/2206user14-01-130625135151-phpapp02/85/2206-user-14-01-362-320.jpg)
![Operating
System
Description
• Timeshare queries have access to the resources that remain after Tactical and
SLG resource demands are met. Timeshare workloads are assigned to the
Medium access level.
8 Click Save.
9 [Optional] Click the Classification tab and determine if you want incoming queries
classified into this workload.
10 [Optional] Click the Throttles tab and set a throttle just for this workload.
Any query that is classified into this workload is subject to this throttle.
11 [Optional] Click the Service Level Goals tab and set service level goals for this workload.
12 [Optional] Click the Exceptions tab and select an exception to be triggered for this
workload.
For example, if a query in this workload is taking too long, create an exception to move
the query to a different workload.
13 [Optional] In SLES 11, if your workload management method is tactical, click the
Tactical Exception tab and modify the tactical exception.
When you create a tactical workload, a tactical exception is created. You can modify the
tactical exception but you cannot delete because it is used to prevent tactical workloads
from depriving non-tactical workloads of system resources.
14 Click Save.
Setting Classification for Workloads
Classification options determine which queries go into a workload. Add classification
settings to existing workloads or when creating a workload. Additional classification options
cannot be added to any of the default workloads.
1 Edit or create a ruleset.
2 From the ruleset toolbar, click Workloads.
3 Select or create a workload.
4 Click the Classification tab.
5 Select classification criteria from the list.
A workload cannot be used to classify utilities if the workload has associated Active
Request or Arrival workload events.
6 Click Add.
7 Specify options based on the classification criteria you selected.
8 If you selected Request Source or Target, do at least one of the following:
• Enter a Match String and use the Include and Exclude buttons to add the match
string. A match string can contain ? to match exactly one character or * to match
zero or more characters.
Chapter 27 Workload Designer
Teradata Viewpoint User Guide, Release 14.01 363](https://image.slidesharecdn.com/2206user14-01-130625135151-phpapp02/85/2206-user-14-01-363-320.jpg)

![Your selection is applied to each cell having that state and overrides the setting specified
in Default Settings.
9 [Optional] Change the default setting by selecting Unlimited or entering a number in
the box so queries over the limit are rejected.
The Delay and Reject options are available in Teradata Database 13.0 and later.
10 Click Save.
Setting Service-Level Goals
Service level goals (SLGs) help determine if workload management is meeting expectations.
You can set throughput and response time service-level goals.
1 Edit or create a ruleset.
2 From the ruleset toolbar, click Workloads.
3 Select or create a workload.
4 Click the Service-Level Goals tab and do one of the following to specify default Service
Level Goals:
• Select Response Time Goal, enter a time in seconds, and set a service percentage. For
example, if you want 90% of queries to finish within 4 seconds, set a response time of
4 and a service percent of 90. You can have different goals in different planned
environments. For example, you can set a response time of 4 seconds for a daytime
environment and 12 seconds for a nighttime environment. Metrics graphs show
response times.
• Select Throughput Goal and enter a throughput number per hour. You can set
different goals for different planned environments. For example, type 200 if you
expect 200 or more queries to be processed per hour.
• Select No Goal if you want no service-level goal for this workload. This option may
be appropriate, for example, for very low priority background workloads.
• Note: You cannot remove the service-level goal for a workload if there is an
associated workload event. To remove the service-level goal, delete the associated
event.
5 [Optional] To override the default settings, click a planned environment and set
environment-specific goals.
6 Click Save.
About Workload Exceptions
An exception is a defined set of actions to take when a threshold is exceeded for an
executing query in a workload. You can add multiple criteria to an exception. Workload
exceptions are triggered when all exception criteria are satisfied.
The SLES 11 IWM system has no options for ruleset exceptions or non-tactical workload
exceptions. IWM systems only use tactical workload exceptions. The SLES 10 IWM system
has no options for exceptions.
Some exception criteria give you the option to add qualification time. Qualification time is
the amount of time the criteria must take place to be recognized. Setting qualification time
prevents very short incidents of criteria from being acknowledged.
Chapter 27 Workload Designer
Teradata Viewpoint User Guide, Release 14.01 365](https://image.slidesharecdn.com/2206user14-01-130625135151-phpapp02/85/2206-user-14-01-365-320.jpg)
![Defining a Workload Exception
1 Edit or create a ruleset.
2 From the ruleset toolbar, click Workloads.
3 Select or create a workload.
4 Click the Exceptions tab.
Note: In Teradata Database 12.0 and 13.0, local exceptions are displayed separately from
shared exceptions on the Exceptions tab.
5 Click Create Exception.
6 Enter a name.
7 [Optional] Enter a description.
8 Under Criteria, select an option from the list, click Add, and specify the additional
required information.
9 Under Actions, select one of the following actions to be performed when the specified
criteria are met:
• Select Notification Only to send notification, and take no other action.
• Select Abort to stop the query.
• Select Abort Selects Only to stop the query only if it is a SELECT.
• Select Change Workload to to change the query to the workload you select from the
list.
10 [Optional] Under Notifications, enable any of the following options for the start or the
end of the event:
Option Description
Send Alert Specifies the action to trigger.
Run Program Specifies the Alerts registered programs to trigger.
Post to QTable The string you enter is posted to the QTable.
11 Click OK.
12 In Teradata Database 12.0 and 13.0, set the priority of exceptions if multiple local
exceptions are assigned to the Change Workload action.
This feature is available from the Exception Precedence tab.
Defining Tactical Workload Exceptions in SLES 11
In SLES 11, a tactical exception is automatically created when you create a tactical workload.
Tactical exceptions trigger a change workload action that moves a query to another
workload. A tactical exception can also trigger other specified actions, such as issuing an alert
or running a program. Tactical exceptions occur when both of the defined criteria are met
for Tactical CPU Time or Tactical I/O Physical Byte. Tactical exceptions apply to the tactical
workloads they are associated with, across all environments. Tactical exceptions can be
modified but they cannot be deleted because they are used to prevent tactical workloads from
depriving non-tactical workloads of system resources.
Chapter 27 Workload Designer
366 Teradata Viewpoint User Guide, Release 14.01](https://image.slidesharecdn.com/2206user14-01-130625135151-phpapp02/85/2206-user-14-01-366-320.jpg)
![1 From the ruleset toolbar, click Workloads.
2 Select or create a tactical workload.
3 Click the Tactical Exception tab.
4 Under Criteria, enter thresholds for Tactical CPU Time and Tactical I/O Physical
Byte.
5 Under Action, select a workload.
The query is moved to this workload if the query exceeds both Tactical CPU Time
thresholds or both Tactical I/O Physical Byte thresholds.
6 [Optional] Under Notifications, enable any of the following options for the start or the
end of the event:
Option Description
Send Alert Specifies the action to trigger.
Run Program Specifies the Alerts registered programs to trigger.
Post to QTable The string you enter is posted to the QTable.
7 Click Save.
Viewing Workload Service Level Goal Summary
A service level goal for workload query performance is set in either throughput or response
time with a service percentage. You can view a summary of service level goals that have been
set for individual workloads.
1 Edit or create a ruleset.
2 From the ruleset toolbar, click Workloads.
3 Click the SLG Summary tab.
Workloads are listed, along with their service level goals for each planned environment.
About Evaluation Order
Evaluation order determines the placement of queries into workloads and utility jobs into
rules. Setting evaluation order is useful when you have created several workloads or utility
sessions.
For workloads, if classification criteria can sort the same query into different workloads,
evaluation order determines the workload in which the query is placed. For example,
account finance users are classified into one workload and users in a specific geographical
location are classified into a different workload. If an individual is a member of both groups,
the workload highest on the evaluation order list is the workload in which the individual is
sorted.
For utility sessions, if a utility job matches more than one utility session rule, evaluation
order determines the rule in which the utility job is placed.
Chapter 27 Workload Designer
Teradata Viewpoint User Guide, Release 14.01 367](https://image.slidesharecdn.com/2206user14-01-130625135151-phpapp02/85/2206-user-14-01-367-320.jpg)


![7 [Optional] Select System Values, and enter a CPU limit to set the maximum percentage
of system CPU that Teradata Database can use.
8 [Optional] Select Reserved AWTs (AMP Worker Task), and enter a number to set the
maximum number of AWTs that are reserved for tactical workloads.
9 [Optional] Select Max Expedited AWTs, and enter a number to set the maximum
number of AWTs that are created on each node.
10 Click Save.
About Virtual Partitions
Virtual partitions are a new feature in SLES 11. A virtual partition is used to divide a system
and afford a higher level of control for resource allocation. In SLES 11, the priority scheduler
manages resources using virtual partitions. In SLES 10, the priority scheduler uses
enforcement priorities and allocation groups to manage resources. A new Virtual Partitions
tab was added under the Workload button. You can create virtual partitions and assign
workloads to the partitions. Drag a workload to move it from one partition to another. A
workload can only exist in one partition. A maximum of 10 virtual partitions can exist.
In SLES 11, new tabs were created to manage virtual partitions. The Virtual Partitions,
Partition Resources, and Workload Distribution tabs are used to create the partitions,
allocate resources to the partitions, and distribute resources to workloads that are in the
partitions, respectively.
Assigning a workload to a different partition does not change the workload management
method. Assigning an SLG Tier workload to a different partition does not change the
workload tier assignment if both partitions have the same tiers. If the target partition does
not have the same tiers as the source partition, then the workload is assigned to the lowest
SLG tier in the target partition. For example, if a workload is moved from SLGTier3 in
Virtual Partition A to Virtual Partition B, the workload is assigned to Tier3 in Virtual
Partition B. If Tier3 does not exist in Virtual Partition B, then the workload is assigned to the
lowest SLG Tier in Virtual Partition B.
An icon to the right of each workload represents the workload tier type.
Icon Tier Type
Tactical
SLG Tier
Timeshare
Adding Virtual Partitions
In SLES 11, you can create virtual partitions and use them to manage workload resource
allocations. The SLES 10 and SLES 11 IWM system has no options for virtual partitions.
1 Edit or create a ruleset.
2 From the ruleset toolbar, click Workloads.
3 Click the Virtual Partitions tab.
4 Mouse over Virtual Partitions and click .
Chapter 27 Workload Designer
370 Teradata Viewpoint User Guide, Release 14.01](https://image.slidesharecdn.com/2206user14-01-130625135151-phpapp02/85/2206-user-14-01-370-320.jpg)
![5 Enter a name.
6 [Optional] Drag a workload to a virtual partition to assign the workload to the virtual
partition.
A workload can exist in only one virtual partition.
7 [Optional] Mouse over the name of a virtual partition that does not contain any
workloads and click to delete the virtual partition.
8 Click Save.
Managing Partition Resources
In SLES 11, you can allocate resources to a virtual partition in a planned environment. If
there are multiple partitions, drag the border between partitions to change resource
allocations. If there are multiple planned environments, you can allocate a different level of
resources for each planned environment. Resource consumption may differ from the
allocation, based on activity on the system.
1 Edit or create a ruleset.
2 From the ruleset toolbar, click Workloads.
3 Click the Partition Resources tab.
4 Drag the border of a partition to adjust the resource allocation for the partition.
5 [Optional] Adjust the resource allocation for additional planned environments.
6 Click Save.
About Workload Distribution
In SLES 11, you can configure a virtual partition by allocating resources to workloads in the
partition. Resources can be allocated differently for each planned environment. The resource
consumption may differ from the allocation you set in this tab, based on activity on the
system. Resources are allocated to management methods as follows:
Tactical
Tactical workloads have access to all available resources.
SLG Tier
SLG Tier workloads have access to remaining resources after tactical demands are
met. If multiple SLG Tiers exist, resources are allocated to the top tier first, with
workloads in each tier consuming resources and passing remaining resources down
to the next tier. A workload that is moved into a fully allocated tier receives 0.1% of
the tier resources. The resources are taken from the workload with the highest
allocation in the tier.
An information balloon appears when you mouse over a workload. The balloon
shows information about the resources available to the workload.
Chapter 27 Workload Designer
Teradata Viewpoint User Guide, Release 14.01 371](https://image.slidesharecdn.com/2206user14-01-130625135151-phpapp02/85/2206-user-14-01-371-320.jpg)
![• Relative to tier is the percent of tier resources allocated to the workload.
• Range based on activity in other workloads displays the minimum and
maximum resources available to the workloads when Tactical workloads are
inactive.
• The minimum value is the share of partition resources available when all
workloads in this tier and above are active and consuming all allocated
resources.
• The maximum value is the share of partition resources available when all
workloads in this tier and above are inactive.
• Unallocated Resources is the available tier resources that are not allocated to a
workload. Three percent of tier resources are reserved to prevent SLG demands
from depriving Timeshare workloads of any resources.
• Relative to tier is the percent of tier resources that can be passed down to
workloads in lower SLG tiers or to Timeshare workloads.
• Range based on activity in other workloads displays the minimum and
maximum resources available to the next Tier or to Timeshare workloads when
Tactical workloads are inactive.
• The minimum value is the share of partition resources available when all
workloads in this tier and above are active and consuming all allocated
resources.
• The maximum value is the share of partition resources available when all
workloads in this tier and above are inactive.
Timeshare
Timeshare workloads have access to remaining resources after tactical and SLG
resource demands are met.
• Top queries are given an access rate eight times the Low access level.
• High queries are given an access rate four times the Low access level.
• Medium queries are given an access rate two times the Low access level.
• Low queries are given the lowest access rate for the Timeshare method.
Distributing Workload Resources
In SLES 11, you can allocate resources to workloads for each planned environment.
1 Edit or create a ruleset.
2 From the ruleset toolbar, click Workloads.
3 Click the Workload Distribution tab.
4 [Optional] Click the Planned Environment and select a planned environment, if
multiple planned environments exist.
Chapter 27 Workload Designer
372 Teradata Viewpoint User Guide, Release 14.01](https://image.slidesharecdn.com/2206user14-01-130625135151-phpapp02/85/2206-user-14-01-372-320.jpg)
![5 [Optional] Click the Virtual Partition and select a virtual partition, if multiple
virtual partitions exist.
6 [Optional] Drag a workload from one management method to another.
This action changes the management method for the workload in all planned
environments and may change existing resource allocation. The following table shows
the result of moving a workload from one management method to another:
Option Description
Tactical to SLG
Tier
• You select the SLG Tier in the current planned environment. The
workload is assigned to the lowest SLG Tier in all other planned
environments.
• Minimum allocation percentage (0.1%) is assigned to the workload. The
allocation comes from unallocated (“remaining”) resources for the tier, if
any, or from the workload with the highest allocation in the tier.
• Tactical Exception is deleted.
Tactical to
Timeshare
• You select the access level for the workload in the current environment.
The access level is changed to Medium in all other planned environments.
• Tactical Exception is deleted.
SLG Tier to
Tactical
Tactical Exception is created.
SLG Tier to
Timeshare
• You select the access level for the workload in the current environment.
• The access level is changed to Medium in all other planned environments.
Timeshare to
Tactical
Tactical Exception is created.
Timeshare to
SLG Tier
• You select the SLG Tier in the current planned environment. The
workload is assigned to the lowest SLG Tier in all other planned
environments.
• Minimum allocation percentage (0.1%) is assigned to the workload. The
allocation comes from unallocated (“remaining”) resources for the tier, if
any, or from the workload with the highest allocation in the tier.
7 [Optional] Under SLG Tier, do any of the following:
• Drag the border of a workload to change its resource allocation.
• Mouse over SLG Tiers and click to add an SLG Tier.
• If multiple SLG Tiers exist, drag workloads from one SLG Tier to another.
• Mouse over an SLG Tier name and click to delete the tier. Only the bottom tier
can be deleted. Only tiers that do not contain workloads can be deleted. If the bottom
tier does not contain workloads, the tier is automatically deleted when you save the
page. Tier 1, however can never be deleted.
8 [Optional] Under Timeshare, drag a workload from one access level to another to
assign the priority of resource allocation for queries in the workload.
9 Click Save.
Chapter 27 Workload Designer
Teradata Viewpoint User Guide, Release 14.01 373](https://image.slidesharecdn.com/2206user14-01-130625135151-phpapp02/85/2206-user-14-01-373-320.jpg)

![Note: The performance groups named L, M, H, and R stand for Low, Medium, High, and
Rush. Do not use or modify the performance groups named L, M, H, and R. The groups
represent levels of priority and are used by the system for console utilities.
On the Console Utilities tab, the mapping of performance groups to workloads only applies
to console utilities that are not included in the Console Utility to Workload Mapping
section.
Creating a Performance Group
Create a performance group to determine which allocation group manages a query.
Performance groups belong to a resource partition, a collection of prioritized performance
groups related by their users' associations.
1 Edit or create a ruleset.
2 From the ruleset toolbar, click Workloads.
3 Click the Console Utilities tab.
4 Click Create Performance Group Mapping.
5 Mouse over New Performance Group and click .
6 Enter a name.
7 Click outside the name.
8 In the Workload Name column, select a workload from the list for the performance
group.
9 Click Save.
10 [Optional] Mouse over the group name and click to delete a performance group.
Mapping Performance Groups to Workloads
Map performance groups to workloads so the groups can be prioritized along with other
work.
1 Edit or create a ruleset.
2 From the ruleset toolbar, click Workloads.
3 Click the Console Utilities tab.
4 In Performance Group to Workload Mapping, use the lists to set a Workload Name
for each Performance Group.
The lists contain the predefined workload, WD-Default, and any workloads you have
created. WD-Default is used when no other workload is specified.
5 Click Save.
About Allocation Groups
An allocation group (AG) is a group of workloads that share an enforcement priority (EP).
The AG manages access to CPU resources based on the assigned weight from the EP. An EP
is a label given to assign weights for the queries running in a workload. Each AG takes the
EP of the first workload associated with it and after that, only workloads with the same EP
can be associated to that AG. As a result, each AG is a collection of one or more workloads
Chapter 27 Workload Designer
Teradata Viewpoint User Guide, Release 14.01 375](https://image.slidesharecdn.com/2206user14-01-130625135151-phpapp02/85/2206-user-14-01-375-320.jpg)
![that share the same EP. Multiple AGs can use the same EP. In SLES 10, Teradata Database
uses the following EPs:
• Tactical queries are short, critical queries that have a defined service level goals. They are
typically single or few-AMP queries or all-AMP queries that consume less than 1 CPU-
second per node.
• Priority queries are important and higher priority than most other work.
• Normal queries are the average priority work running on the system.
• Background queries run for work that does not have a response time requirement.
You can group and manage AGs in resource partitions. The default allocation groups and
any groups you create are assigned to resource partitions.
You can change the default mapping by using the diagram on the Workload Mapping tab,
where you can reassign workloads to other allocation groups and reassign allocation groups
to other resource partitions. Allocation groups that contain workloads cannot be deleted.
Carefully consider the allocation groups you drag in and out of the tactical resource partition
because this can have a significant effect on the amount of CPU available to the queries
running in the allocation group. The tactical resource partition normally has a much higher
weight than other resource partitions. If you move an allocation group containing long,
resource-intensive queries into the tactical resource partition, those queries can consume a
large amount of the available CPU, impacting queries running in other resource partitions. If
you move a tactical allocation group out of the tactical resource partition, the queries
running in the tactical allocation group are assigned a lower priority and may not meet their
response-time goals.
Creating an Allocation Group
Create allocation groups using the Workload Mapping tab.
1 Edit or create a ruleset.
2 From the ruleset toolbar, click Workloads.
3 Click the Workload Mapping tab.
4 Mouse over the name of the resource partition, such as Tactical or Standard, to which
you want to add an allocation group, and click .
5 Enter a name.
6 Click outside the name.
7 [Optional] To move the allocation group to a different resource partition, mouse over the
name of the group, and drag the group to a different column.
8 [Optional] To change the name of the allocation group, mouse over the name of the
group, and click .
9 Click Save.
Mapping Allocation Groups to Workloads
If you have created workloads, you can view the Workload Mapping tab to see how the
workloads map to allocation groups and resource partitions. Allocation groups and resource
partitions determine how much CPU is available to the queries that are running in the listed
Chapter 27 Workload Designer
376 Teradata Viewpoint User Guide, Release 14.01](https://image.slidesharecdn.com/2206user14-01-130625135151-phpapp02/85/2206-user-14-01-376-320.jpg)

![satisfied for the duration of the qualification time. After an exception is created, additional
controls in the tabs of the Exceptions view allow you to manage the exception.
1 Edit or create a ruleset.
2 From the ruleset toolbar, click Exceptions.
3 From any of the tabs in the Exception view, click Create Exception.
4 Enter a name.
5 [Optional] Enter a description.
6 Select an option from the Exception Criteria list, and click Add.
7 Enter a value for the criteria.
8 For qualified criteria (marked with *), enter a value in Qualification Time.
9 Select one of the following actions to be performed when the specified criteria are
satisfied:
Option Description
Notification Only Sends a notification only. No other action is performed.
Abort Stops the query.
Abort Selects Only Stops the query only if it is a SELECT.
Change Workload
to
Changes the workload of the query to the specified workload.
Change Workload to is unavailable if the Blocked Time criterion or
Elapsed Time criterion was selected.
In Teradata Database 12.0 and 13.0, there can be more than one shared
exception assigned to the Change Workload to action. Use the
Exception Precedence tab to set the priority of multiple exceptions.
10 [Optional] Under Notifications, enable any of the actions for the exception.
Option Description
Send Alert Specify the Teradata Alerts to trigger.
Run Program Specify the Teradata Alerts registered programs to trigger.
Post to QTable Enter a string to post to the QTable.
11 Click OK.
About Tactical CPU per Node Exceptions in SLES 10
If you select the Tactical CPU per Node exception criteria, the following rules apply:
• The exception can be enabled for workloads that use the tactical enforcement priority.
Tactical workloads are in the top row of the Workload Mapping tab.
• The exception must have a Change Workload to action to another workload in the same
resource partition column.
• The exception must have Tactical CPU per Node set to 5 CPU-seconds or less.
• The exception must have CPU Time set to a number greater than Tactical CPU per
Node.
Chapter 27 Workload Designer
Teradata Viewpoint User Guide, Release 14.01 379](https://image.slidesharecdn.com/2206user14-01-130625135151-phpapp02/85/2206-user-14-01-379-320.jpg)
![• Using Tactical CPU per Node criteria disables the Blocked Time and Elapsed Time
criteria for the exception.
Managing Exceptions
Ruleset exceptions are managed from the ruleset Exceptions view. In Teradata Database 12.0
and 13.0, local exceptions are displayed separately from shared exceptions on the By
Workload tab.
1 Edit or create a ruleset.
2 From the ruleset toolbar, click Exceptions.
3 [Optional] Create exceptions by clicking Create Exception from any tab.
4 After exceptions have been created, click the By Planned Environment, By Workload,
or By Exception tab to manage exceptions.
5 Depending on the tab, select Workload or Exception from the list.
6 [Optional] Edit an exception from the By Planned Environment or By Workload tab by
mousing over the exception and clicking .
7 [Optional] Delete an exception from the By Planned Environment or By Workload tab
by mousing over the exception and clicking .
8 In the selected view, select or clear the appropriate check boxes to enable or disable the
exceptions for the listed workloads, planned environments, or workload and planned
environment combinations.
9 Click Save.
Chapter 27 Workload Designer
380 Teradata Viewpoint User Guide, Release 14.01](https://image.slidesharecdn.com/2206user14-01-130625135151-phpapp02/85/2206-user-14-01-380-320.jpg)


![Operating
System
Description
SLES10 and
earlier
• All Enforcement Priorities expands to display the list. Select at least one
enforcement priority.
• All Health States expands to display the list. Select at least one health
state.
SLES11 • All Virtual Partitions expands to display the list. Select at least one
virtual partition.
• All tier types/access levels expands to display the list. Select at least one
tier type or access level.
• All Health States expands to display the list. Select at least one health
state.
3 [Optional] Select the Name Filters tab and deselect a workload name check box to hide it
from view.
4 Click OK.
Setting Sort Criteria
1 Click Sort.
The Sort menu appears.
2 To specify the sort criteria, do one of the following:
• Click Missed SLG to sort workloads into workload health state groups in alphabetical
order by workload name.
• Click Name to display workloads in alphabetical order by workload name, regardless
of workload health state.
About the Workload Health Details View
The HEALTH DETAILS view displays metrics for a single workload. Use the
PREFERENCES view to select the metrics. This view appears after you click the workload
icon or name for a workload in the WORKLOAD HEALTH view. The HEALTH DETAILS
view is not available for workloads with a health state of NO_DATA.
Chapter 28 Workload Health
384 Teradata Viewpoint User Guide, Release 14.01](https://image.slidesharecdn.com/2206user14-01-130625135151-phpapp02/85/2206-user-14-01-384-320.jpg)
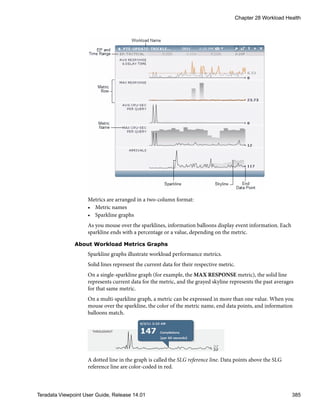

![About the Preferences View
The PREFERENCES view allows you to customize the portlet.
From the portlet frame, click to access the PREFERENCES view and then use one or
more of the following tabs to customize your preferences.
Systems
Choose a system to monitor.
Metrics
In SLES 10, select metrics for workloads in the Tactical, Priority, Normal, or
Background enforcement priorities.
In SLES 11, select metrics for workloads in the Tactical, SLG Tier, or Timeshare
management methods.
Trend Interval
Set the time period displayed for the metric graphs.
Past Averages
Choose the time period for which a historical average is calculated.
Selecting a System to Monitor
Use the Systems tab in the PREFERENCES view to select a system to monitor.
1 From the portlet frame, click to access the PREFERENCES view.
2 Click the Systems tab.
3 [Optional] Click Clear Defaults to clear all user-defined default settings created for this
portlet.
4 Select a system from the list.
5 [Optional] Select the Use these settings as defaults check box to use the current settings
in all PREFERENCES tabs as the default configuration each time you add this portlet to
a portal page.
6 Click OK.
Setting Metrics for Enforcement Priority or Tier/Access Level
For each enforcement priority group in SLES 10 or tier/access level in SLES 11, you can
select and order metrics for display in the portlet. Choose from a defined list of metrics.
1 From the portlet frame, click to access the PREFERENCES view.
2 Click the Metrics tab for an enforcement priority group or tier/access level.
The Default display pane uses sample data to show how metric rows are displayed in
the portlet.
3 [Optional] Click Clear Defaults to clear all user-defined default settings created for this
portlet.
4 Do any of the following to change the way metric rows are displayed:
Chapter 28 Workload Health
Teradata Viewpoint User Guide, Release 14.01 387](https://image.slidesharecdn.com/2206user14-01-130625135151-phpapp02/85/2206-user-14-01-387-320.jpg)
![• Add a metric row. Drag a metric from the Available Rows list to the Default display
pane.
• Remove a metric row. Click located on the metric row.
• Change metric row order. Drag a metric already in the Default display pane to a new
location in the pane (up or down).
5 [Optional] Select the Use these settings as defaults check box to use the current settings
in all PREFERENCES tabs as the default configuration each time you add this portlet to
a portal page.
6 Click OK.
Setting the Workload Trend Interval
Use the Trend Interval tab in the PREFERENCES view to set the length of time represented
in sparkline metrics.
1 From the portlet frame, click to access the PREFERENCES view.
2 Click the Trend Interval tab.
3 [Optional] Click Clear Defaults to clear all user-defined default settings created for this
portlet.
4 Select an Interval.
The default is 24 hours.
5 [Optional] Select the Use these settings as defaults check box to use the current settings
in all PREFERENCES tabs as the default configuration each time you add this portlet to
a portal page.
6 Click OK.
Setting Past Averages
Use the Past Averages tab in the PREFERENCES view to specify the number of weeks of
data points used to calculate the average values displayed in metric graphs.
1 From the portlet frame, click to access the PREFERENCES view.
2 Click the Past Averages tab.
3 [Optional] Click Clear Defaults to clear all user-defined default settings created for this
portlet.
4 Enter the number of weeks (1 to 99 weeks).
The default is 2 weeks.
5 [Optional] Select the Use these settings as defaults check box to use the current settings
in all PREFERENCES tabs as the default configuration each time you add this portlet to
a portal page.
6 Click OK.
Chapter 28 Workload Health
388 Teradata Viewpoint User Guide, Release 14.01](https://image.slidesharecdn.com/2206user14-01-130625135151-phpapp02/85/2206-user-14-01-388-320.jpg)


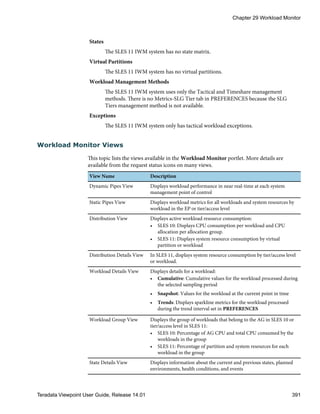

![Name Icon Description
Delays Requests that were delayed and completed or are currently
delayed. Does not include requests that were delayed, but are
still active.
Exceptions
Reclassified
Requests that triggered an exception. This icon appears with
these values:
• The total number of workload exceptions in the sampling
period
• The number of requests reclassified to a different workload
Completions Requests that executed successfully. These requests no longer
require system resources.
Selecting Views
You can select a summary view and a sampling period to identify issues in workload
management. The default sampling period is 60 minutes. Sampling period totals are updated
during the portlet refresh, which is every 60 seconds. Workload Details views are available
from each summary view.
1 Choose one of the following summary views:
Option Description
Dynamic Pipes a. Click the Dynamic Pipes icon.
b. Select a sampling period under Cumulative System Data from Last.
c. [Optional] In SLES 11, select a virtual partition to display data for
only that partition. The default is All.
Static Pipes a. Click the Static Pipes icon.
b. Select a sampling period under Cumulative System Data from Last.
c. [Optional] In SLES 11, select a virtual partition to display data for
only that partition. The default is All.
Distribution SLES
10
a. Click the Distribution icon.
b. Select a sampling period from CPU Consumption Per Workload
from Last.
c. Click any pie chart segment other than Idle or System to go to
another view:
• CPU Consumption segments correspond to the Workload Details
view.
• Relative Weight segments correspond to the Workload Group
view.
Distribution SLES
11
a. Click the Distribution icon.
b. Select CPU Consumption or I/O Consumption.
c. Select a sampling period in from Last.
Chapter 29 Workload Monitor
Teradata Viewpoint User Guide, Release 14.01 393](https://image.slidesharecdn.com/2206user14-01-130625135151-phpapp02/85/2206-user-14-01-393-320.jpg)
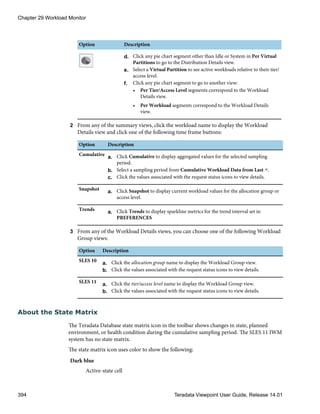

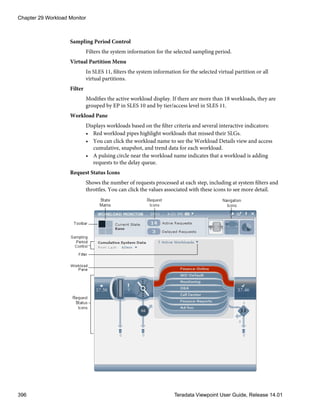
![Selecting Filter Criteria
1 In the Dynamic Pipes view, click in the Filter.
The FILTER WORKLOADS dialog box appears.
2 Select at least one of the following filtering options:
Operating
System
Description
SLES 10 • Group by enforcement priority groups workloads by their enforcement
priority.
• All Enforcement Priorities expands to display the list. Select at least one
enforcement priority.
• Missed SLG displays only those workloads which have missed their SLGs.
• Active Workloads displays only those workloads which were active within
the sampling period.
SLES 11 • Group by tier type/access level groups workloads by their tier type or
access level.
• All tier types/access levels expands to display the list. Select at least one
tier type or access level.
• Missed SLG displays only those workloads which have missed their SLGs.
• Active Workloads displays only those workloads which were active within
the sampling period.
3 [Optional] Select the Name Filters tab and deselect a workload name check box to hide
it from view.
4 Click OK.
About the Static Pipes View
The Static Pipes displays all workloads and indicates how many are active.
Toolbar
State Matrix: Shows the changes in state, planned environment, or health condition
during the cumulative sampling period. In SLES 11, you can click it to see details
about the current state and previous states.
Request Icons: Shows the active and delayed requests. You can click them to see
more detail.
Navigation Icons: You can click them to access the summary views.
Sampling Period Control
Filters the system information for the selected sampling period.
Chapter 29 Workload Monitor
Teradata Viewpoint User Guide, Release 14.01 397](https://image.slidesharecdn.com/2206user14-01-130625135151-phpapp02/85/2206-user-14-01-397-320.jpg)
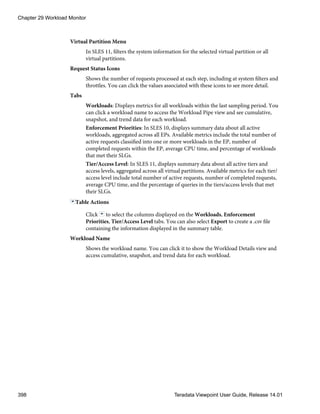
![Configuring Columns to Display
Use the Columns dialog box to select, lock, and order columns. You can resize columns in
the table.
1 Click in the table header and select Configure Columns.
2 In the Columns dialog box, select the check boxes of columns to display.
Mouse over the name to see the complete name.
3 [Optional] Click next to the column name.
The columns at the top of the list can be locked in the table to remain on the left when
scrolling horizontally.
4 [Optional] Click and drag the row to reorder the column.
5 Click Apply to save the changes.
6 [Optional] Sort on a column by clicking the column header.
• Sort on a column by clicking the column header. A second click toggles the sort
order.
• Sort on two columns consecutively using Ctrl+Click in the column header. Primary
sort order is indicated by a single arrow, and secondary sort order is indicated by a
double arrow.
7 [Optional] In the table, drag the column heading border in either direction to resize
the column.
Chapter 29 Workload Monitor
Teradata Viewpoint User Guide, Release 14.01 399](https://image.slidesharecdn.com/2206user14-01-130625135151-phpapp02/85/2206-user-14-01-399-320.jpg)


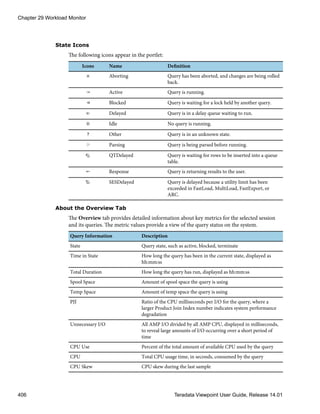


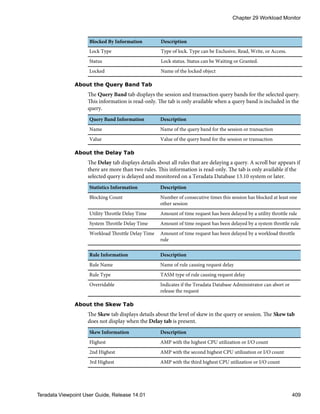
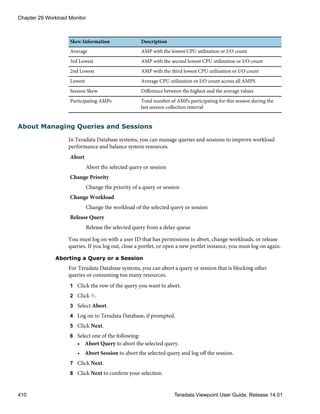
![Changing the Priority of a Query or Session
For Teradata Database systems, you can change the priority of a query or session to allow
higher priority queries to run or balance session resources.
This menu item is only available when workloads are not enabled and the system being
monitored supports this feature.
1 Click the row of the query you want to change.
2 Click .
3 Select Change Priority.
4 Log on to Teradata Database, if prompted.
5 Click Next.
6 From the list of accounts that have been assigned to the user, select an account to copy
the account name to the Edit new account string box.
7 [Optional] Edit the account string or enter a new account string.
8 Click Next.
9 Select one of the following:
• Move just this query to change the priority of the selected query.
• Move this query and all future queries associated with this session to change the
priority of the selected query and all subsequent queries in the current session.
10 Click Next.
11 Click Next to confirm your selection.
Changing the Workload of a Query or Session
For Teradata Database systems, you can change the workload of a query or session to allow
higher priority workloads to run or to balance workload resources.
This menu item is only available when workloads are enabled and the system being
monitored supports this feature.
1 Click the row of the query you want to change.
2 Click .
3 Select Change Workload.
4 Log on to Teradata Database, if prompted.
5 Click Next.
6 Select a different workload from the list and click Next.
7 Select one of the following:
• Move just this query to change the selected query.
• Move this query and all future queries associated with this session to change the
priority of the selected query and all subsequent queries in the current session.
8 Click Next.
Chapter 29 Workload Monitor
Teradata Viewpoint User Guide, Release 14.01 411](https://image.slidesharecdn.com/2206user14-01-130625135151-phpapp02/85/2206-user-14-01-411-320.jpg)
![9 Click Next to confirm your selection.
10 Click OK.
Releasing a Query
For Teradata Database systems, you can release a query from the delay queue for immediate
processing.
1 Click the row of the query you want to change.
2 Click .
3 Select Release Query.
4 Log on to Teradata Database, if prompted.
5 Click Next.
6 Click Next to confirm your selection.
About the Preferences View
The PREFERENCES view allows you to customize the portlet.
From the portlet frame, click to access the PREFERENCES view and then use one or
more of the following tabs to customize your preferences.
Systems
Choose a system to monitor.
Metrics
In SLES 10, select metrics for workloads in the Tactical, Priority, Normal, or
Background enforcement priorities.
In SLES 11, select metrics for workloads in the Tactical, SLG Tier, or Timeshare
management methods.
Trend Interval
Set the time period displayed for the metric graphs.
Past Averages
Choose the time period for which a historical average is calculated.
Selecting a System to Monitor
Use the Systems tab in the PREFERENCES view to select a system to monitor.
1 From the portlet frame, click to access the PREFERENCES view.
2 Click the Systems tab.
3 [Optional] Click Clear Defaults to clear all user-defined default settings created for this
portlet.
4 Select a system from the list.
Chapter 29 Workload Monitor
412 Teradata Viewpoint User Guide, Release 14.01](https://image.slidesharecdn.com/2206user14-01-130625135151-phpapp02/85/2206-user-14-01-412-320.jpg)
![5 [Optional] Select the Use these settings as defaults check box to use the current settings
in all PREFERENCES tabs as the default configuration each time you add this portlet to
a portal page.
6 Click OK.
Setting Metrics for Enforcement Priority or Tier/Access Level
For each enforcement priority group in SLES 10 or tier/access level in SLES 11, you can
select and order metrics for display in the portlet. Choose from a defined list of metrics.
1 From the portlet frame, click to access the PREFERENCES view.
2 Click the Metrics tab for an enforcement priority group or tier/access level.
The Default display pane uses sample data to show how metric rows are displayed in
the portlet.
3 [Optional] Click Clear Defaults to clear all user-defined default settings created for this
portlet.
4 Do any of the following to change the way metric rows are displayed:
• Add a metric row. Drag a metric from the Available Rows list to the Default display
pane.
• Remove a metric row. Click located on the metric row.
• Change metric row order. Drag a metric already in the Default display pane to a new
location in the pane (up or down).
5 [Optional] Select the Use these settings as defaults check box to use the current settings
in all PREFERENCES tabs as the default configuration each time you add this portlet to
a portal page.
6 Click OK.
Setting the Workload Trend Interval
Use the Trend Interval tab in the PREFERENCES view to set the length of time
represented in sparkline metrics.
1 From the portlet frame, click to access the PREFERENCES view.
2 Click the Trend Interval tab.
3 [Optional] Click Clear Defaults to clear all user-defined default settings created for this
portlet.
4 Select an Interval.
The default is 24 hours.
5 [Optional] Select the Use these settings as defaults check box to use the current settings
in all PREFERENCES tabs as the default configuration each time you add this portlet to
a portal page.
6 Click OK.
Chapter 29 Workload Monitor
Teradata Viewpoint User Guide, Release 14.01 413](https://image.slidesharecdn.com/2206user14-01-130625135151-phpapp02/85/2206-user-14-01-413-320.jpg)
![Setting Past Averages
Use the Past Averages tab in the PREFERENCES view to specify the number of weeks of
data points used to calculate the average values displayed in metric graphs.
1 From the portlet frame, click to access the PREFERENCES view.
2 Click the Past Averages tab.
3 [Optional] Click Clear Defaults to clear all user-defined default settings created for this
portlet.
4 Enter the number of weeks (1 to 99 weeks).
The default is 2 weeks.
5 [Optional] Select the Use these settings as defaults check box to use the current settings
in all PREFERENCES tabs as the default configuration each time you add this portlet to
a portal page.
6 Click OK.
Chapter 29 Workload Monitor
414 Teradata Viewpoint User Guide, Release 14.01](https://image.slidesharecdn.com/2206user14-01-130625135151-phpapp02/85/2206-user-14-01-414-320.jpg)


