This dissertation examines the author's experiment on acquiring flint knapping skills as a novice. Pebbles from Kilchattan Bay, Isle of Bute were reduced through flint knapping by the author, who had no prior experience. The results were analyzed to study the effects of pebble shape and size on skill development, track the learning process, and provide data on unskilled lithic production. Comparison to other novice and expert data allowed incorporation into wider academic understanding of lithic assemblages and novice skill acquisition in flint knapping. The experiment gave the author deeper insights into lithic analysis and the development of skills as a novice knapper.

![6
Skill acquisitionand transfer
Each person upon developing knapping skill obtains a certain unique style of knapping. Johnson
points this out by discussing the differences in the body movements during knapping between three
American knappers (Johnson 1978:359). François Bordes, commenting on Johnson’s statements, says
that:
“…most of the time I can tell whether a stone has been worked by [Don] Crabtree, [Jacques] Tixier,
or myself. Ourstyles are different,butdo notaskme to say whatthe differencesare! I feel them more
than I see them.”
FrançoisBordes1978, 359
Not only does Bordes mention the differences between individual styles, but also states, that the
differences are more felt than seen (at least to him). It could be argued, that these differences
develop unconsciously as part of the development of knapping skills and practice. Even when using
the same or similar technology, the outcome is slightly different, just enough to be picked up by an
experienced flint knapper. Bordes was talking about the know-how part of skill. Having practiced
knapping for many years, he had a lot of experience and thus could differentiate between the slight
differences in reduction. Note that, he “feels” them more than he sees them. This is due to the
intuitive nature of know-how. Practice is a major part of stone knapping skill acquisition. Olausson
mentions that in an unpublished study John E. Clark suggested “a direct relationship between
knapping skill and time spent knapping” (1998:94). Several ethnographic studies show that
apprenticeship of a certain craft involving stone knapping usually takes several years. For example
the novice bead knappers in modern Khambhat, India spend up to seven years learning not only the
main knapping techniques, but also how to adapt different strategies to local sub-goals, which vary
depending on the shapes, dimensions, and quality of beads as well as the raw material (Roux et al
1995). Studies of knapping skill development in the production of hand-axes has shown that the most
difficult task to master is the first one, where the rough shape of the hand-axe is produced, but
differs based on the variability of raw material (Winton 2005:113). These are just some of the studies
that show the importance of practice and time investment required in the development of skill. Brain
scans done during the initial stages of stone knapping skill acquisition have shown that the
development of sensimotor skills is most crucial in the beginning stages of craft learning (Stout and
Chaminade 2007:1098). The increase of these sensimotor skills is based on natural preconditions and
mindful practice (Iriki 2005). But practice is not just to develop certain muscle memory. Rather than
being a process of developing a specific motor ability, skill acquisition is a way of learning how to act
in order to solve a problem – “flint knapping is all about problem solving” (Wright, personal
communication;Ferguson2008a:125-126).
Ferguson (2008b:52) compares transfer of skill in stone knapping to skills taught in archaeological
field schools. Both the good quality raw material and the archaeological record are valuable and non-
renewable. While it does require a degree of knowledge that can be taught, it is essential to get the
practical experience of participating in an excavation by oneself. Archaeology students are given
actual expert tasks with help and support of more experienced archaeologists or post-graduate
students. This is similar to how novice flintknappers are thought with minimal waste of the raw
material using scaffolding, where the beginners are given the tasks that have the highest success rate,
with supervision by experts (Ferguson 2008b:52-53). Even though it is possible to teach the
knowledge required, practice is crucial for the development of skill. This is because the information](https://image.slidesharecdn.com/c03df8be-fd2a-4994-ae50-10c21992912e-161029145456/85/2034483DC-12-320.jpg)
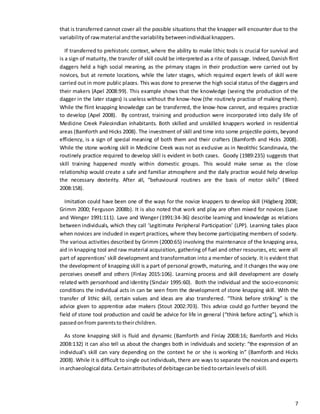
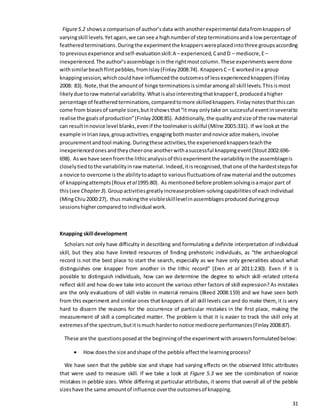
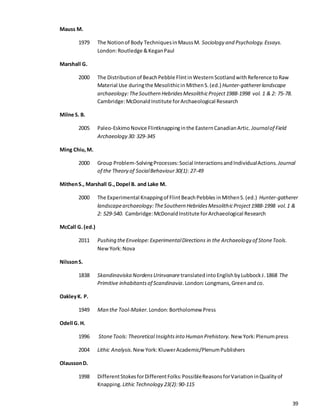
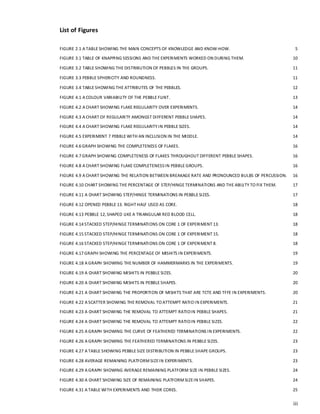
![Appendix4 – KnappingJournal*
*here are some example pagesfromthe KnappingJournal.FullKnappingJournal canbe foundinthe
digital CDattachment.
19.01.2016 Session9 Experiment2
Today I openedanotherpebble.Itwasveryhard to openit,butafter speakingwithDene,andhim
showingthe bestspotto try,I’ve managedto openit.The pebble turnedouttobe verynon-
homogeneous,withquiteafewinclusionswhichisapainto knap.I still keepmakingalotof step
terminationsandIcan’t getflakes thattravel the full lengthof the core.My handalso hurtsa bit and
it’stiredfromknapping.
Today I learnt:
Usuallywhentryingtofix myown mistakes,Imake more.
It mightnot be a bad ideato switchplatformsmid6strikes.
09.02.2016 Session15 Experiments3&4
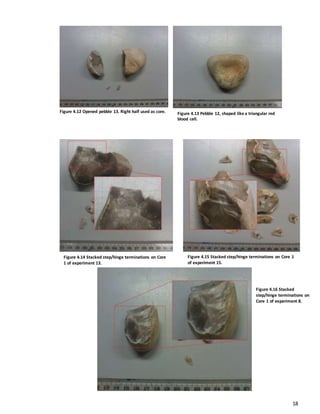
Today I finishedExperiment3.There was1 more large flake,apossible [tool]preform, butthe
platformwastoo small.I’ve openedanotherpebble.Afterafew goodflakes,few mishits,Itried
takingoff the cortex on the otherside,butI accidentallycrackedthe core inhalf Luckily,Ihad one of
the openingflakesasanothercore,soI usedthat to make some possiblemicroliths.The core got
small veryfast;I had to use bare handsto holdit up to a pointwhere itwastoo dangeroustoholdit.
Today I learnt:
Don’tleta fewmistakesgetyoudown.
Don’tmake rash decisions.
I’ve startedto getan eye where wouldbe the bestplace toopenpebbles.
29.02.2016 Session19 Experiments9-11
Today I finished2pebblesandstartedanotherone. The firstone wasverysmall;Iwouldnothave
pickediton the beach.The otherone hada badshape,like atriangularredbloodcell.Anditwasalso
veryhard. Intermsof gathering,skill obviouslyaffectsthe choice of pebbles.The thirdone wasgood.
The flintwasblack andhomogeneous. Atfirstthe flakingwashard,butonce I got usedto it,it was
easier.
Today I learnt:
Some pebblesare notmeanttobe knapped.
73](https://image.slidesharecdn.com/c03df8be-fd2a-4994-ae50-10c21992912e-161029145456/85/2034483DC-79-320.jpg)


