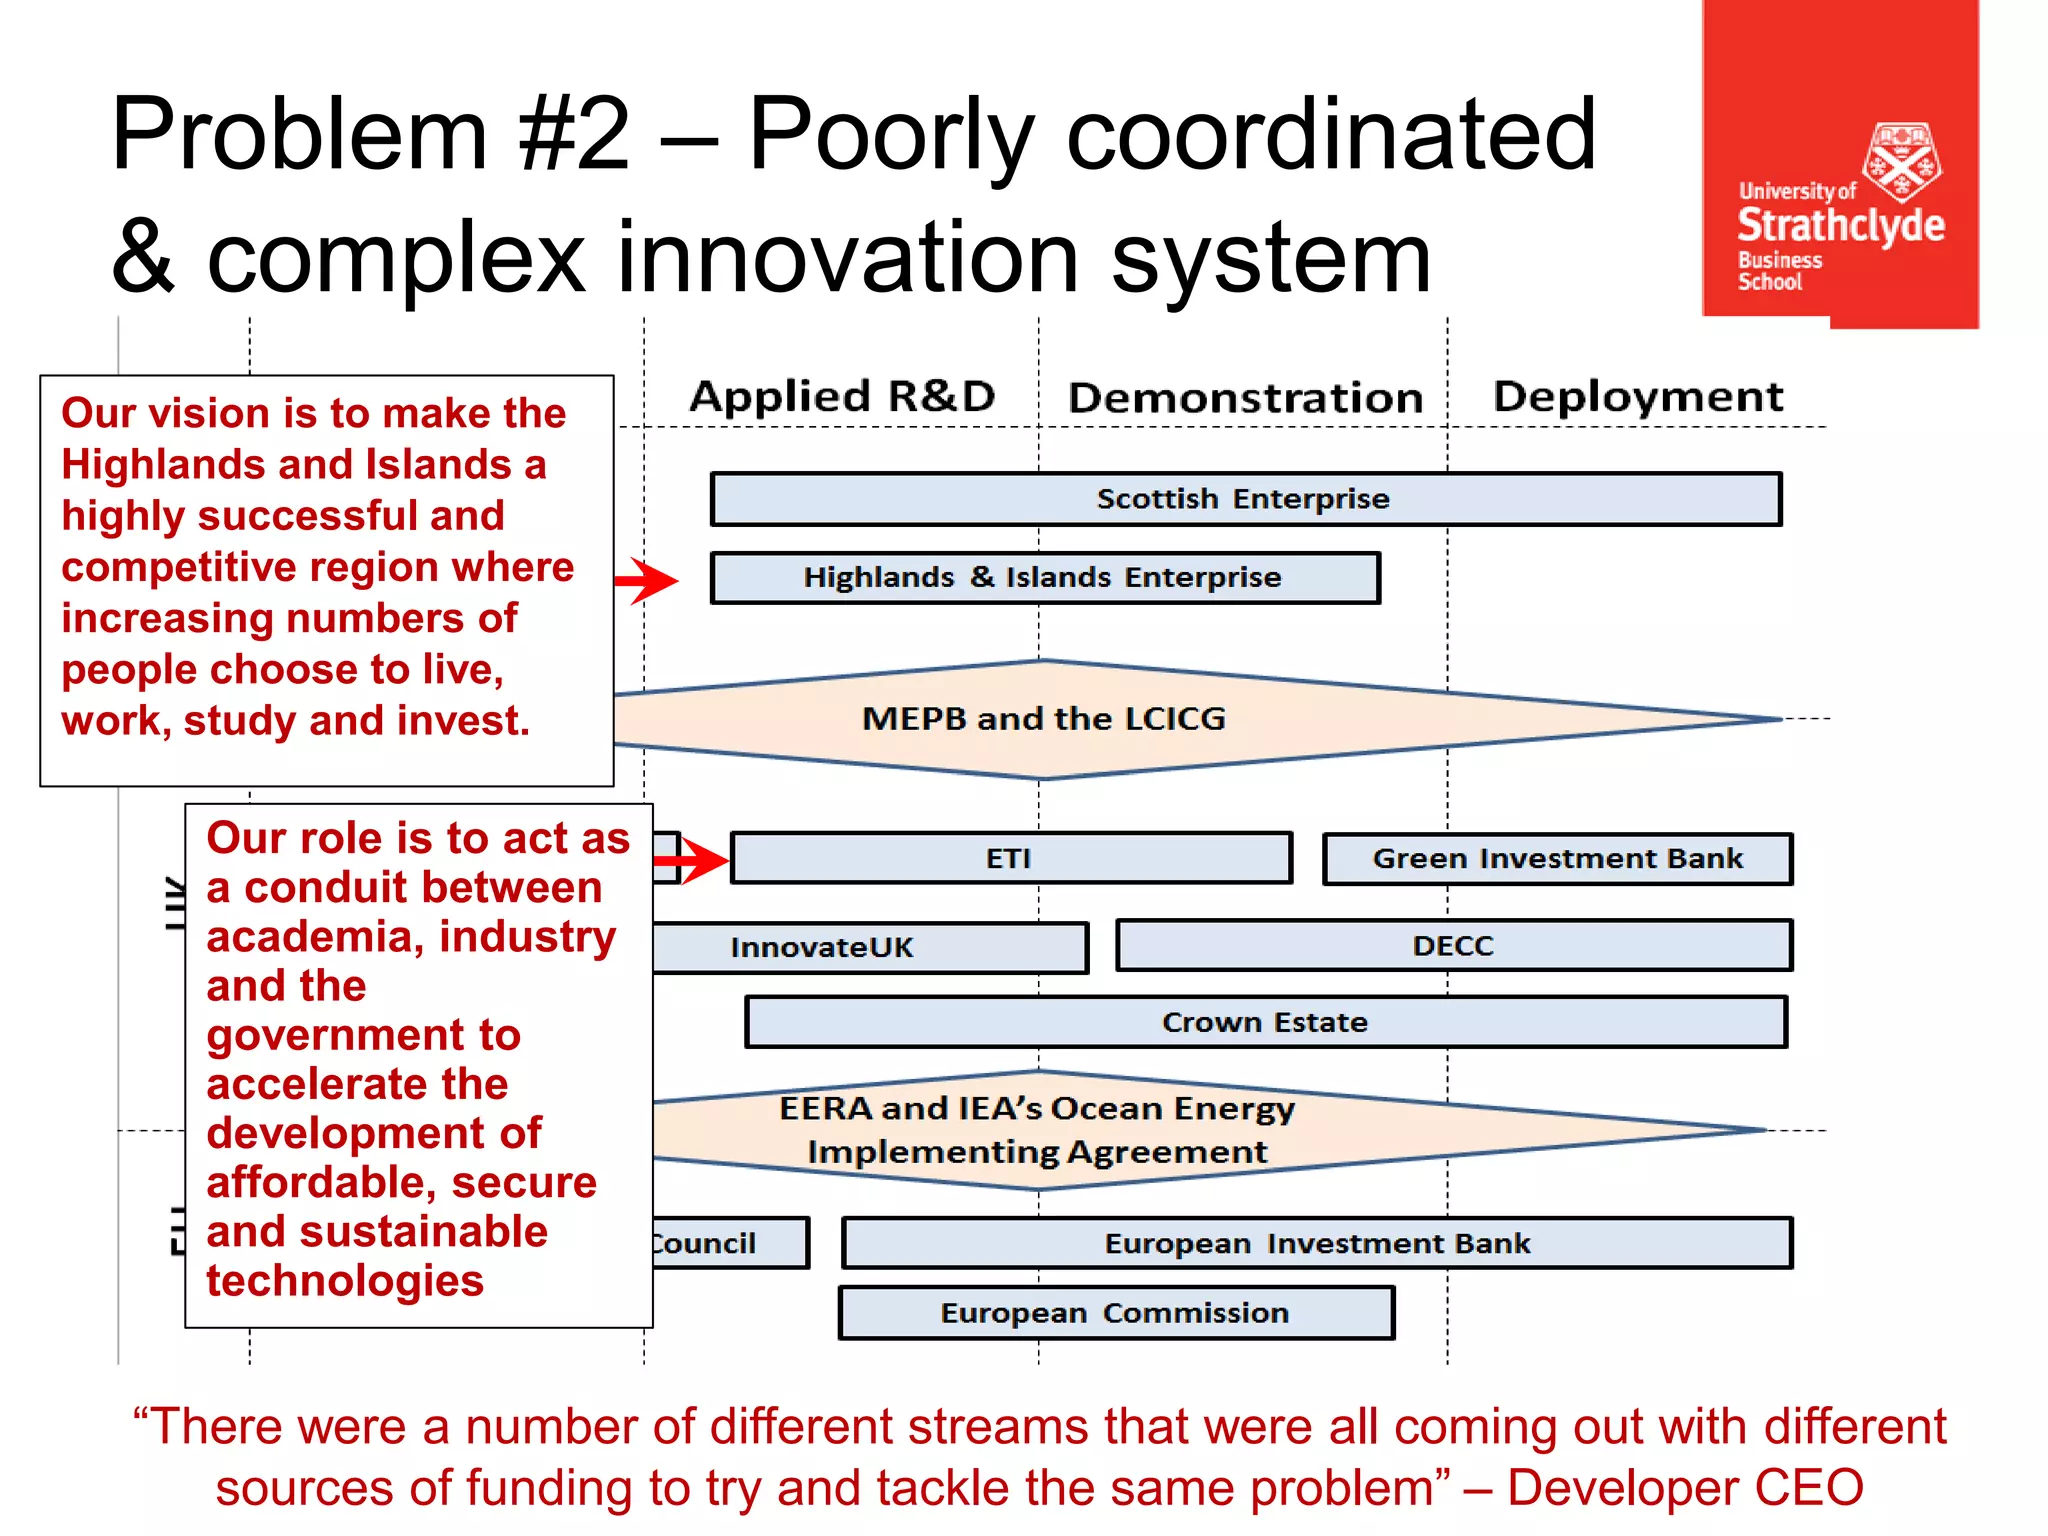
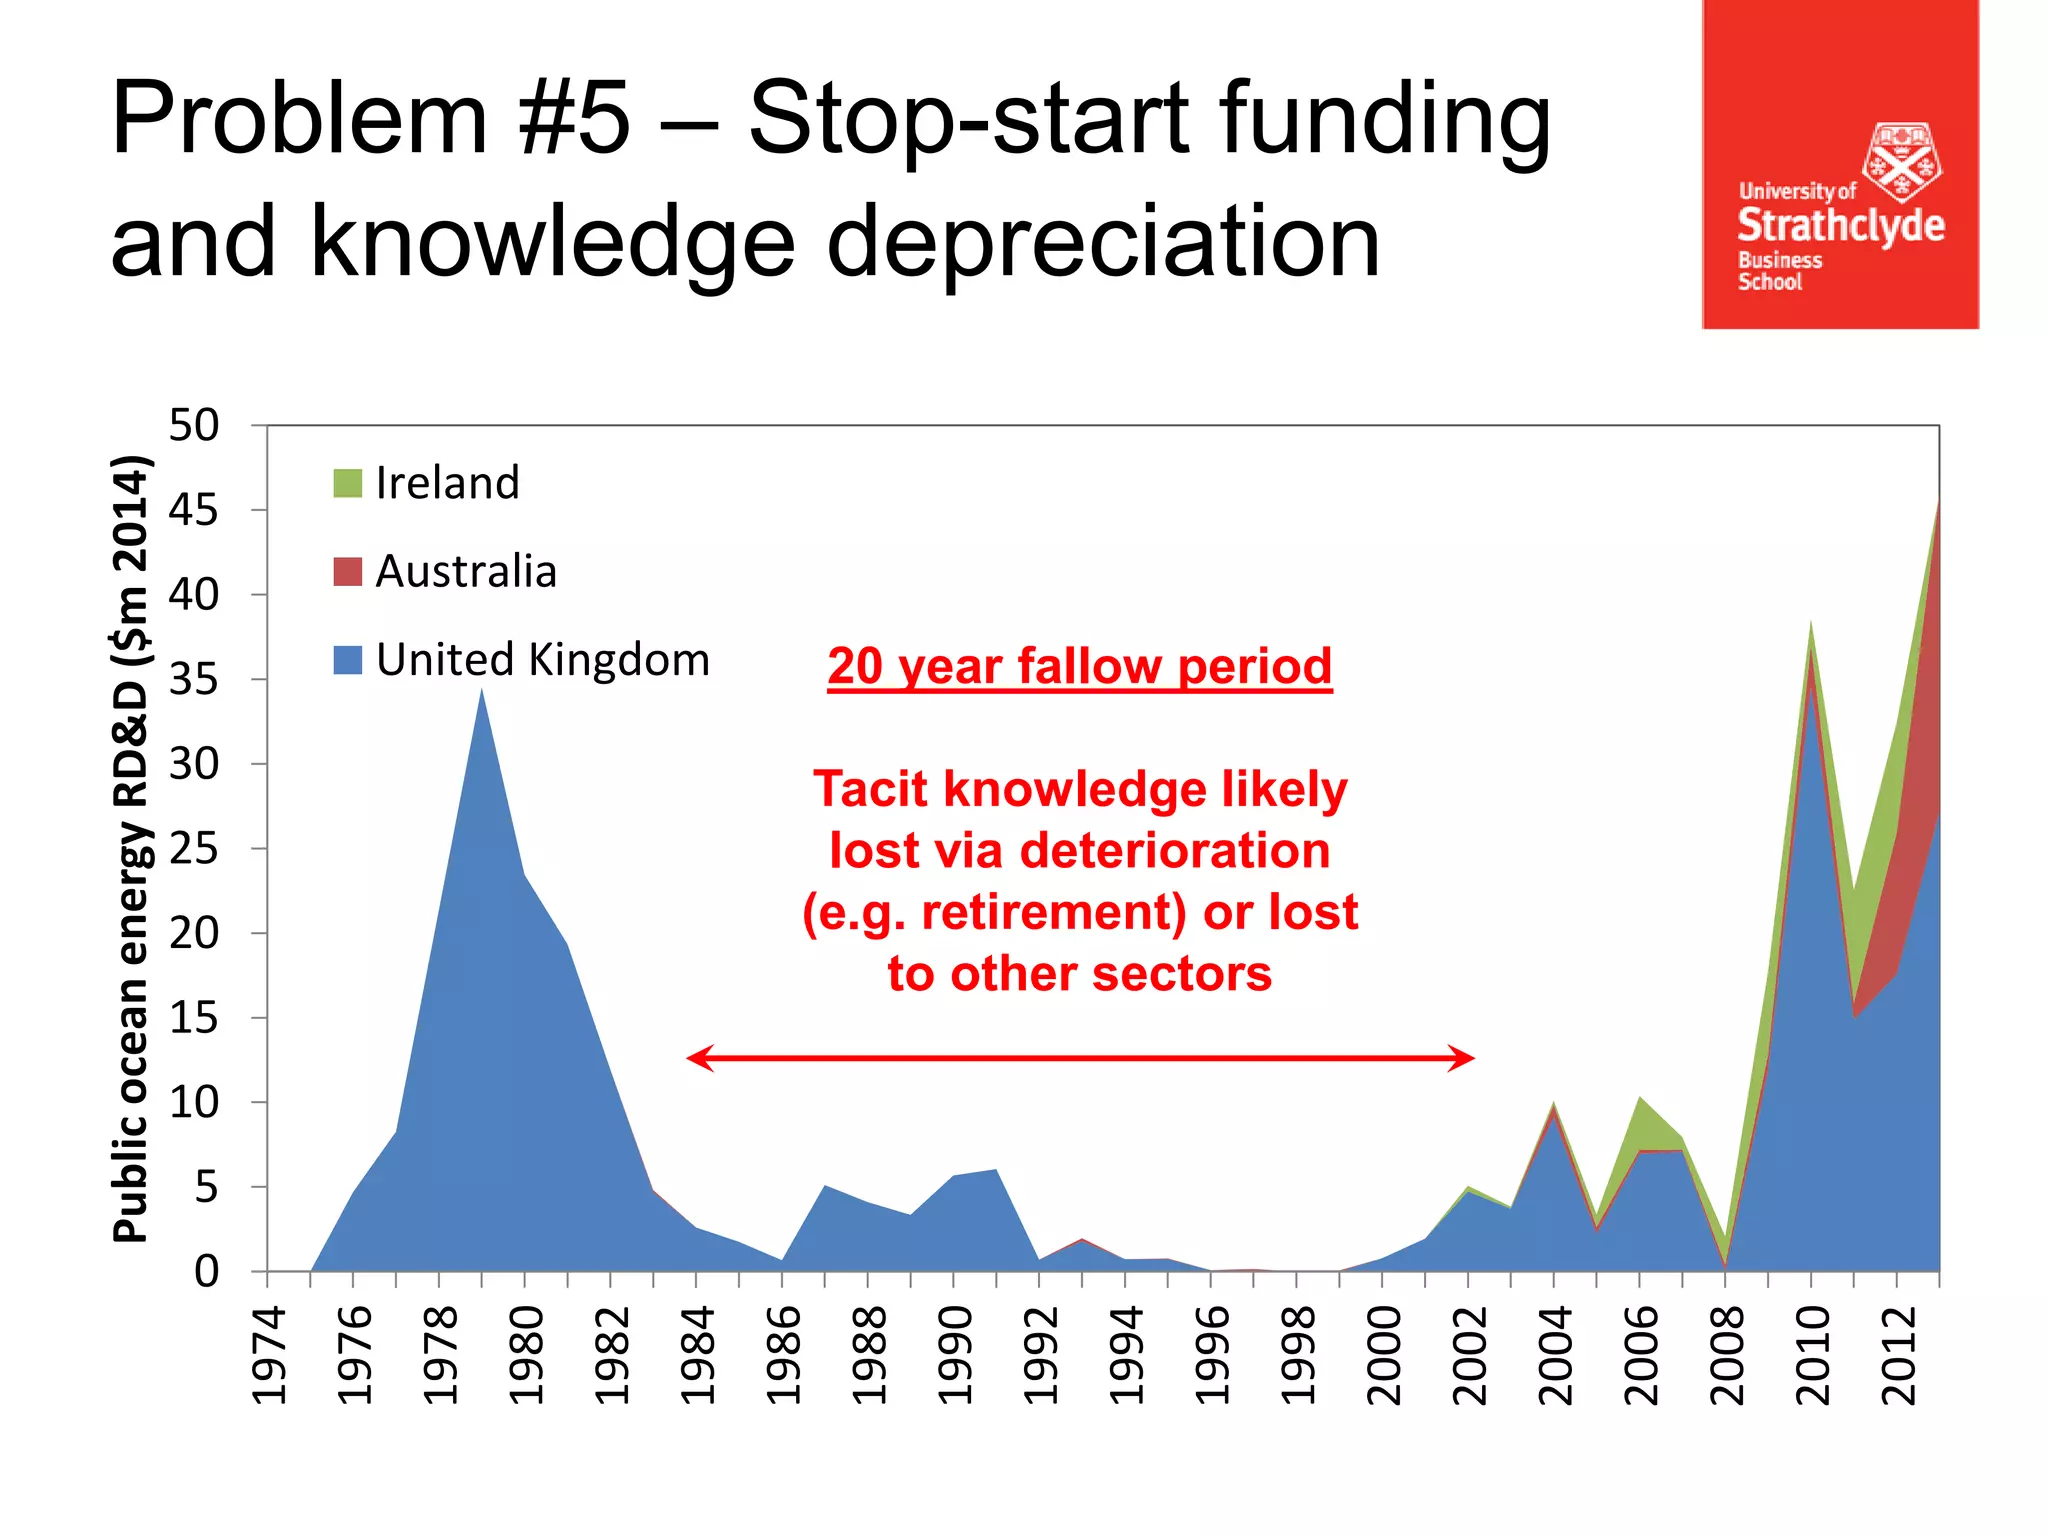
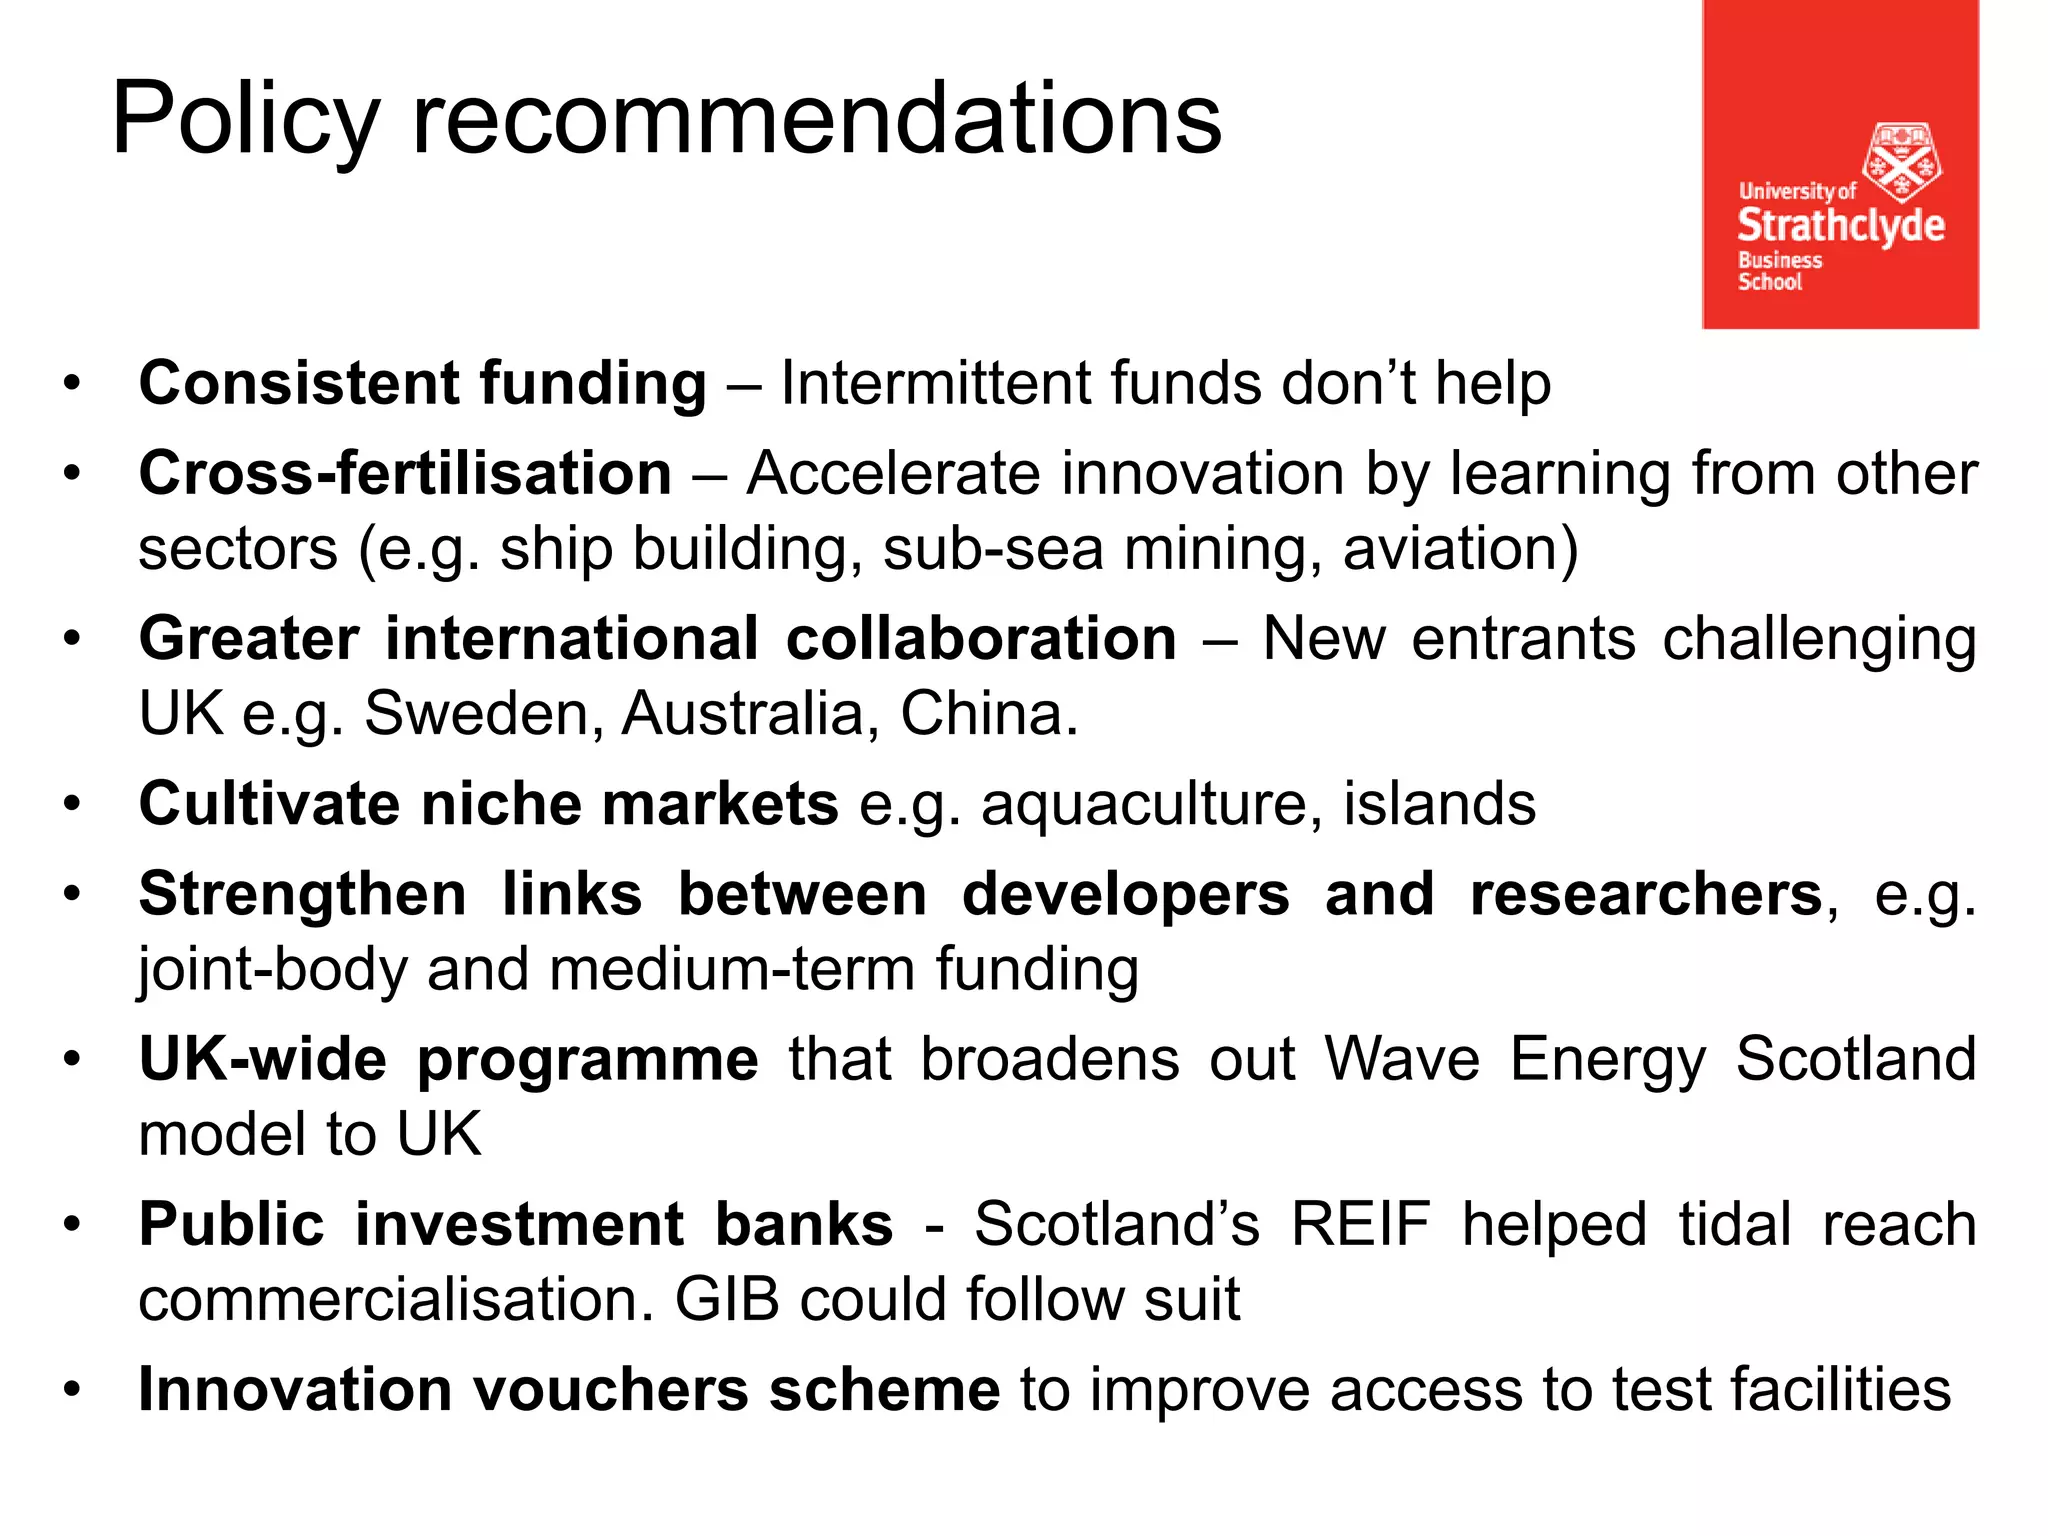
Lost at sea? Charting wave
energy’s difficult innovation
journey towards commercialisation
in the UK
Dr. Matthew Hannon
University of Strathclyde
René van Diemen, Prof. Jim Skea
Imperial College London
Energy Systems Conference, QE2 Centre, London
15th June 2016
• Introducing wave energy
• International comparison of UK’s wave
energy innovation performance
• Five issues that contributed to wave
energy’s slow progress in the UK
• Policy recommendations
• Conclusions and recommendations for
future work
Structure
Wave energy
OnshoreNearshoreOffshore
POINT ABSORBER
ATTENUATOR
OSCILLATING WAVE
SURGE CONVERTER
OSCILLATING WATER
COLUMN
OVERTOPPING/TERMINATOR
DEVICE
SUBMERGED PRESSURE
DIFFERENTIAL
BULGE WAVE ROTATING MASS
Significant lack of technological
convergence indicates an
immature technology
Levelised cost of electricity
Wave = $500/MWh
Tidal = $440/MWh
Offshore wind = $210/MWh
Thin-film PV = $150/MWh
Onshore wind = $85/MWh
Large hydro = $70/MWh
(BNEF H1 2014)
FURTHER
INNOVATION
NEEDED
Public ocean energy RD&D
1974-2013 (INPUT)
(Source: IEA)
Country RD&D (2014 $)
US 722
UK 304
Canada 115
Norway 94
Japan 70
France 38
Sweden 34
Australia 34
Denmark 34
Korea 32
NOTE: Excludes private RD&D. Public budgets not actual spend. All ocean energy,
including tidal range but most components drawn from hydro RD&D
(Source: EPO)
Patents 1979-2011 (OUTPUT)
Rank
Total Ocean Wave
Country
Patent
filings
% Country
Patent
filings
%
1 US 242 18% US 118 17%
2 UK 228 17% UK 118 16%
3 DE 154 11% DE 71 10%
4 FR 79 6% NO 49 7%
5 NO 78 6% AU 34 5%
6 IE 52 4% SE 34 5%
7 JP 50 4% FR 33 5%
8 SE 49 4% IE 30 4%
9 AU 47 3% IT 27 4%
10 IT 45 3% ES 27 4%
Global 1368 - Global 717 52%
NOTE: This study takes the following Y02E patent classifications specific to ocean energy: (10/28) Tidal
stream or damless hydropower, (10/32) Oscillating water column (OWC), (10/34) Ocean thermal energy
conversion (OTEC), (10/36) Salinity gradient and (10/38) Wave energy or tidal swell.
(Source: OES)
Deployment 2007-16 (OUTPUT)
NOTE: Includes both pre-commercial demonstration and commercial deployment between 2007 and 2016
Performance: $ RD&D per patent
NOTE: Excludes countries that have delivered less than 10 patent filings. Also missing Finland and Israel due to lack of RD&D data.
Public ocean energy RD&D is for ocean energy and thus incorporates tidal range, tidal stream, OTEC, salinity gradient etc. Wave energy RD&D not
available.
2.2 5.6 5.6 6.3 8.2 9 9.1 16.1 19.1 20.5
47.9
335.7
0
50
100
150
200
250
300
350
IE AU NL KR DE ES NO DK SE UK CA US
PublicoceanenergyRD&D($m2014)per
MWofinstalledcapacity
Performance: $ RD&D per MW
NOTE: Excludes countries that have delivered less than 150kW of capacity. Also missing Finland and China due to lack of RD&D data
Public ocean energy RD&D is for ocean energy and thus incorporates tidal range, tidal stream, OTEC, salinity gradient etc.
• UK leads wave energy innovation inputs (RD&D $) and
outputs (patents, deployment) but less ‘bang for its
buck’ versus other countries.
• UK not delivered a commercial wave array, with main
developers (Pelamis, Aquamarine) in administration.
• We examine whether the design of the UK’s
innovation support policy (2000-2015) could have
constrained the pace of wave energy technology
innovation?
• Methods: Analysis of UK grant databases, IEA RD&D
data and 32 interviews (March – Oct 2015).
Diagnosing the UK’s wave energy
innovation performance
Problem #1 – Overpromising and
under-delivering
• Unrealistic
expectations wave
energy could be ‘fast-
tracked’
• Money made available
for demonstration and
developers
overpromised but then
under-delivered
• Trust eroded and
leading to scaling back
of VCs and government
“It’s been people like me…guilty of thinking that we could get this
to kick-start, like wind energy, off the back of a couple of
prototypes on a small farm being demonstrated” – Consultant
Problem #2 – Poorly coordinated
& complex innovation system
“There were a number of different streams that were all coming out with different
sources of funding to try and tackle the same problem” – Developer CEO
Our role is to act as
a conduit between
academia, industry
and the
government to
accelerate the
development of
affordable, secure
and sustainable
technologies
Our vision is to make the
Highlands and Islands a
highly successful and
competitive region where
increasing numbers of
people choose to live,
work, study and invest.
Problem #3 – Picked ‘winners’ that
ultimately lost
Entered
administration but
absorbed 45% of
grant funding
2000-2015
Top wave energy demonstration grant awardees in the UK 2000-2015
Problem #4 – Bundling wave into
same schemes with tidal stream
TIDAL
WAVE
“There’s a sense of convergence
around the axial flow turbine
which looks a little bit like a
Danish wind turbine…They’re
standing on the shoulders of
giants” - Funder
Tidal stream received x2 funding
Problem #5 – Stop-start funding
and knowledge depreciation
20 year fallow period
Tacit knowledge likely
lost via deterioration
(e.g. retirement) or lost
to other sectors
0
5
10
15
20
25
30
35
40
45
50
1974
1976
1978
1980
1982
1984
1986
1988
1990
1992
1994
1996
1998
2000
2002
2004
2006
2008
2010
2012
PublicoceanenergyRD&D($m2014)
Ireland
Australia
United Kingdom
Some lessons learnt leading to major changes in
wave energy innovation support system, not
least Wave Energy Scotland:
• P#1 - 100% funding avoids need for private
sector match funding
• P#2 – WES board comprised of reps from
other funders
• P#2, P#3 - Stage-gating criteria to ensure
promising tech receives more funding
• P#4 - Decoupling tidal stream and wave
energy funding
• P#4 - Refocusing at sub-component level to
promote convergence
• P#5 – Capturing knowledge e.g. Pelamis
UK wave energy innovation
support has been re-calibrated
• Consistent funding – Intermittent funds don’t help
• Cross-fertilisation – Accelerate innovation by learning from other
sectors (e.g. ship building, sub-sea mining, aviation)
• Greater international collaboration – New entrants challenging
UK e.g. Sweden, Australia, China.
• Cultivate niche markets e.g. aquaculture, islands
• Strengthen links between developers and researchers, e.g.
joint-body and medium-term funding
• UK-wide programme that broadens out Wave Energy Scotland
model to UK
• Public investment banks - Scotland’s REIF helped tidal reach
commercialisation. GIB could follow suit
• Innovation vouchers scheme to improve access to test facilities
Policy recommendations
• UK is a leader of ocean energy innovation outputs but lags behind
other countries in terms of effectiveness i.e. ‘bang for its buck’
• Why? Weaknesses identified in the UK’s wave energy innovation
support system: (1) going too fast too soon; (2) poorly coordinated
and complex landscape; (3) backing the wrong ‘winners’; (4)
bundling technologies together at different TRLs; and (5)
intermittent support
• BUT effective learning and system re-configuration has taken place
• Policy recommendations include more consistent support, cross-
fertilization; international and private-public collaboration, UK-wide
coordination and affordable access to test infrastructure
• Next steps? (1) Compare wave vs. tidal stream in UK. (2) Explore
best and worst international performers. (3) Additional innovation
indicators. (4) Understand nature of innovation support learning
Conclusions
Email: matthew.hannon@strath.ac.uk
Twitter: @hannon_matthew
Research Gate: http://tinyurl.com/zseak45
The Fighting Temeraire. 1839, by J. M. W Turner

20160615 EI Energy Systems final

  • 1.
    Lost at sea?Charting wave energy’s difficult innovation journey towards commercialisation in the UK Dr. Matthew Hannon University of Strathclyde René van Diemen, Prof. Jim Skea Imperial College London Energy Systems Conference, QE2 Centre, London 15th June 2016
  • 2.
    • Introducing waveenergy • International comparison of UK’s wave energy innovation performance • Five issues that contributed to wave energy’s slow progress in the UK • Policy recommendations • Conclusions and recommendations for future work Structure
  • 3.
    Wave energy OnshoreNearshoreOffshore POINT ABSORBER ATTENUATOR OSCILLATINGWAVE SURGE CONVERTER OSCILLATING WATER COLUMN OVERTOPPING/TERMINATOR DEVICE SUBMERGED PRESSURE DIFFERENTIAL BULGE WAVE ROTATING MASS Significant lack of technological convergence indicates an immature technology Levelised cost of electricity Wave = $500/MWh Tidal = $440/MWh Offshore wind = $210/MWh Thin-film PV = $150/MWh Onshore wind = $85/MWh Large hydro = $70/MWh (BNEF H1 2014) FURTHER INNOVATION NEEDED
  • 4.
    Public ocean energyRD&D 1974-2013 (INPUT) (Source: IEA) Country RD&D (2014 $) US 722 UK 304 Canada 115 Norway 94 Japan 70 France 38 Sweden 34 Australia 34 Denmark 34 Korea 32 NOTE: Excludes private RD&D. Public budgets not actual spend. All ocean energy, including tidal range but most components drawn from hydro RD&D
  • 5.
    (Source: EPO) Patents 1979-2011(OUTPUT) Rank Total Ocean Wave Country Patent filings % Country Patent filings % 1 US 242 18% US 118 17% 2 UK 228 17% UK 118 16% 3 DE 154 11% DE 71 10% 4 FR 79 6% NO 49 7% 5 NO 78 6% AU 34 5% 6 IE 52 4% SE 34 5% 7 JP 50 4% FR 33 5% 8 SE 49 4% IE 30 4% 9 AU 47 3% IT 27 4% 10 IT 45 3% ES 27 4% Global 1368 - Global 717 52% NOTE: This study takes the following Y02E patent classifications specific to ocean energy: (10/28) Tidal stream or damless hydropower, (10/32) Oscillating water column (OWC), (10/34) Ocean thermal energy conversion (OTEC), (10/36) Salinity gradient and (10/38) Wave energy or tidal swell.
  • 6.
    (Source: OES) Deployment 2007-16(OUTPUT) NOTE: Includes both pre-commercial demonstration and commercial deployment between 2007 and 2016
  • 7.
    Performance: $ RD&Dper patent NOTE: Excludes countries that have delivered less than 10 patent filings. Also missing Finland and Israel due to lack of RD&D data. Public ocean energy RD&D is for ocean energy and thus incorporates tidal range, tidal stream, OTEC, salinity gradient etc. Wave energy RD&D not available.
  • 8.
    2.2 5.6 5.66.3 8.2 9 9.1 16.1 19.1 20.5 47.9 335.7 0 50 100 150 200 250 300 350 IE AU NL KR DE ES NO DK SE UK CA US PublicoceanenergyRD&D($m2014)per MWofinstalledcapacity Performance: $ RD&D per MW NOTE: Excludes countries that have delivered less than 150kW of capacity. Also missing Finland and China due to lack of RD&D data Public ocean energy RD&D is for ocean energy and thus incorporates tidal range, tidal stream, OTEC, salinity gradient etc.
  • 9.
    • UK leadswave energy innovation inputs (RD&D $) and outputs (patents, deployment) but less ‘bang for its buck’ versus other countries. • UK not delivered a commercial wave array, with main developers (Pelamis, Aquamarine) in administration. • We examine whether the design of the UK’s innovation support policy (2000-2015) could have constrained the pace of wave energy technology innovation? • Methods: Analysis of UK grant databases, IEA RD&D data and 32 interviews (March – Oct 2015). Diagnosing the UK’s wave energy innovation performance
  • 10.
    Problem #1 –Overpromising and under-delivering • Unrealistic expectations wave energy could be ‘fast- tracked’ • Money made available for demonstration and developers overpromised but then under-delivered • Trust eroded and leading to scaling back of VCs and government “It’s been people like me…guilty of thinking that we could get this to kick-start, like wind energy, off the back of a couple of prototypes on a small farm being demonstrated” – Consultant
  • 11.
    Problem #2 –Poorly coordinated & complex innovation system “There were a number of different streams that were all coming out with different sources of funding to try and tackle the same problem” – Developer CEO Our role is to act as a conduit between academia, industry and the government to accelerate the development of affordable, secure and sustainable technologies Our vision is to make the Highlands and Islands a highly successful and competitive region where increasing numbers of people choose to live, work, study and invest.
  • 12.
    Problem #3 –Picked ‘winners’ that ultimately lost Entered administration but absorbed 45% of grant funding 2000-2015 Top wave energy demonstration grant awardees in the UK 2000-2015
  • 13.
    Problem #4 –Bundling wave into same schemes with tidal stream TIDAL WAVE “There’s a sense of convergence around the axial flow turbine which looks a little bit like a Danish wind turbine…They’re standing on the shoulders of giants” - Funder Tidal stream received x2 funding
  • 14.
    Problem #5 –Stop-start funding and knowledge depreciation 20 year fallow period Tacit knowledge likely lost via deterioration (e.g. retirement) or lost to other sectors 0 5 10 15 20 25 30 35 40 45 50 1974 1976 1978 1980 1982 1984 1986 1988 1990 1992 1994 1996 1998 2000 2002 2004 2006 2008 2010 2012 PublicoceanenergyRD&D($m2014) Ireland Australia United Kingdom
  • 15.
    Some lessons learntleading to major changes in wave energy innovation support system, not least Wave Energy Scotland: • P#1 - 100% funding avoids need for private sector match funding • P#2 – WES board comprised of reps from other funders • P#2, P#3 - Stage-gating criteria to ensure promising tech receives more funding • P#4 - Decoupling tidal stream and wave energy funding • P#4 - Refocusing at sub-component level to promote convergence • P#5 – Capturing knowledge e.g. Pelamis UK wave energy innovation support has been re-calibrated
  • 16.
    • Consistent funding– Intermittent funds don’t help • Cross-fertilisation – Accelerate innovation by learning from other sectors (e.g. ship building, sub-sea mining, aviation) • Greater international collaboration – New entrants challenging UK e.g. Sweden, Australia, China. • Cultivate niche markets e.g. aquaculture, islands • Strengthen links between developers and researchers, e.g. joint-body and medium-term funding • UK-wide programme that broadens out Wave Energy Scotland model to UK • Public investment banks - Scotland’s REIF helped tidal reach commercialisation. GIB could follow suit • Innovation vouchers scheme to improve access to test facilities Policy recommendations
  • 17.
    • UK isa leader of ocean energy innovation outputs but lags behind other countries in terms of effectiveness i.e. ‘bang for its buck’ • Why? Weaknesses identified in the UK’s wave energy innovation support system: (1) going too fast too soon; (2) poorly coordinated and complex landscape; (3) backing the wrong ‘winners’; (4) bundling technologies together at different TRLs; and (5) intermittent support • BUT effective learning and system re-configuration has taken place • Policy recommendations include more consistent support, cross- fertilization; international and private-public collaboration, UK-wide coordination and affordable access to test infrastructure • Next steps? (1) Compare wave vs. tidal stream in UK. (2) Explore best and worst international performers. (3) Additional innovation indicators. (4) Understand nature of innovation support learning Conclusions
  • 18.
    Email: matthew.hannon@strath.ac.uk Twitter: @hannon_matthew ResearchGate: http://tinyurl.com/zseak45 The Fighting Temeraire. 1839, by J. M. W Turner