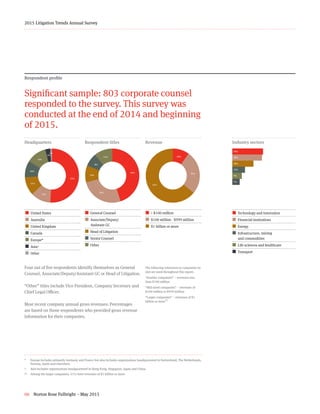
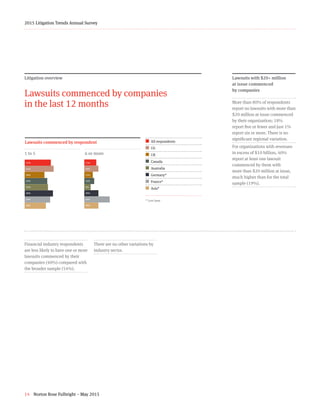
The document summarizes the key findings of Norton Rose Fulbright's 2015 Litigation Trends Annual Survey, which polled 803 corporate counsel from 26 countries. It finds that contract disputes were the most numerous type of litigation over the past year (38% of respondents), while regulatory/investigations matters were the top concern (39% of respondents). Labor/employment litigation was also very common (37% of respondents). The types of disputes varied by region and industry, with IP/patents cases more prevalent in the US, for example, while banking/finance disputes were more common for UK respondents. Overall, the survey provides insights into the global litigation issues currently facing many major companies.

![20 Norton Rose Fulbright – May 2015
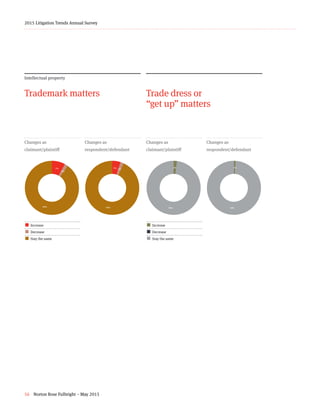
2015 Litigation Trends Annual Survey
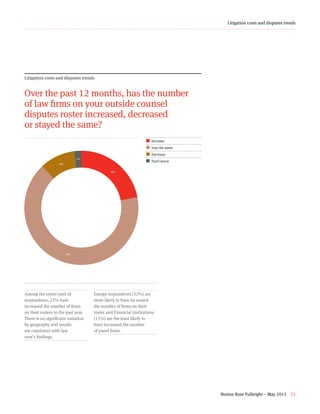
Litigation costs and disputes trends
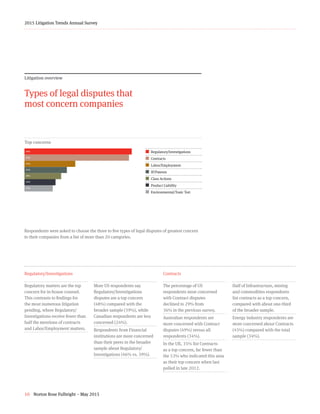
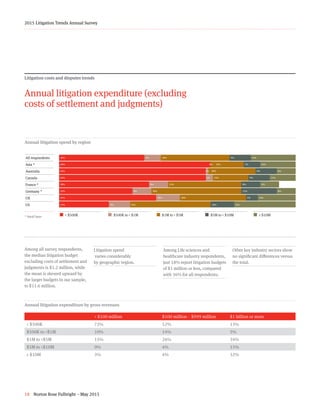
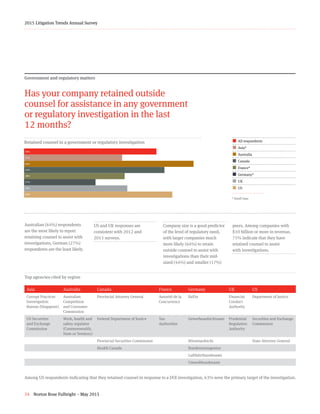
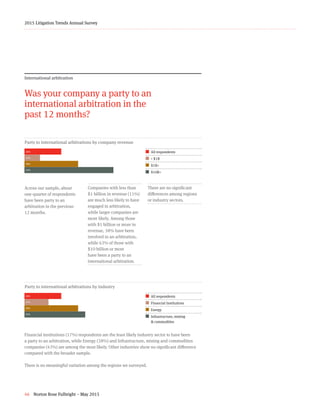
Do you expect the number of legal disputes your company will face
in the next 12 months to increase, decrease or stay the same?
25+59+14+2+z
All respondents
¢ Increase
¢ Stay the same
¢ Decrease
¢ None pending
There are no significant
differences by region,
industry sector or
company size.
Sentiments in the US and UK
are unchanged since 2012,
the last time this question
was posed.
Why do you expect an increase?
23+17+12+8¢ Company is expanding / growing (incl. M&A)
¢ Aware of disputes that are likely to emerge
¢ Increasingly litigious environment /
impact of high profile settlements
¢ Economic climate
“As we acquire more assets, that necessarily brings more
opportunity for disputes.” – US Energy Company GC
“We have got a few matters that are on the horizon that
we can see already.” – UK Energy AGC
“I think [Australia is] becoming a more litigious
environment.” – Australian Transport Company GC
“We all are expecting a softer economy next year and
that usually will bring about more disputes.” – US
Finance AGC
“Because relations with suppliers, or with partners,
are more and more tense. Negotiations getting more
complicated.” – French Technology & Innovation GC
“Increasing appetite of external regulators to
bring FCPA/UK Bribery Act enforcement claims.” –
Asia-based Chief Compliance Officer of US Technology
& Innovation company
Why do you expect a decrease?
33+23+21+10
¢ Current disputes will be resolved
¢ Do not anticipate new disputes / cases arising
¢ Better management / prevention /
more proactive (inc. contacts)
¢ Higher number of disputes than normal this year /
disputes will decline / revert to usual level
“Because what we have pending right now is probably
going to be resolved by the end of the year.” – US
Technology & Innovation Company GC
“We have implemented some new procedures for our
front-line personnel so that we are addressing disputes
before they become litigious.” - Canadian Infrastructure,
mining and commodities industry GC
“We are just getting tighter on our legal spend, and
probably will be looking for ways to keep control of it.”
- Chinese Financial Institution GC
25%
59%
14%
2%
23%
17%
12%
8%
33%
23%
21%
10%](https://image.slidesharecdn.com/39a2dafd-ec14-4011-bf5d-3e8dc571786d-150516162818-lva1-app6891/85/2015-Litigation-Trends-Survey-LTS-v22-20-320.jpg)

![28 Norton Rose Fulbright – May 2015
2015 Litigation Trends Annual Survey
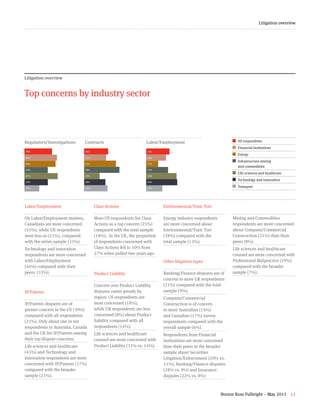
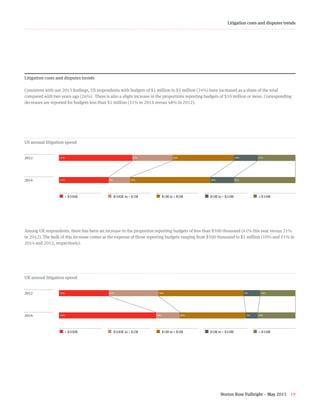
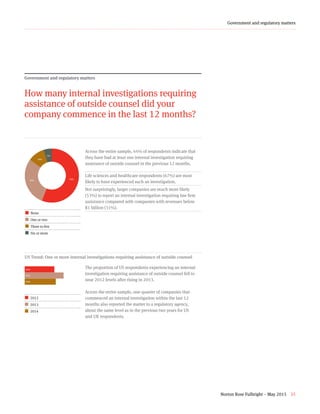
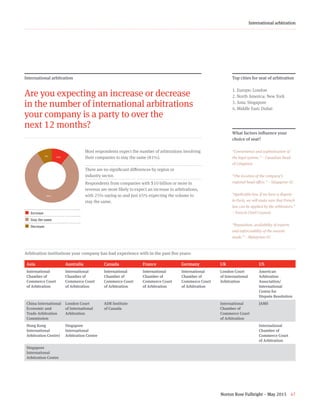
41+57+2+z
Expectations of an increase in AFA use ¢ Increase
¢ Stay the same
¢ Decrease
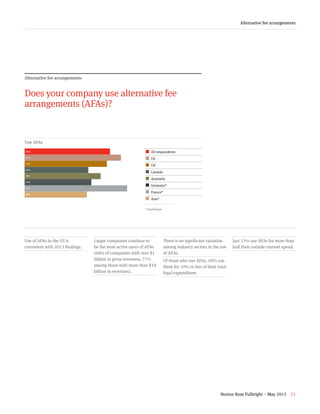
Alternative fee arrangements
Expectations of an increase in AFA use
Respondents were asked if they expect their use of AFAs to increase, decrease or stay the
same over the next 12 months.
Why are respondents expecting
to increase use of AFAs?
“These arrangements lower legal
spend generally. They also tend
to speed transactions by limiting
‘make work’ advisor behaviour.” –
Australia-based GC of a Hong
Kong Transport Company
“Success in alternative fee billing is an
extremely effective way of measuring
just how good (1) the in-house legal
department is, and (2) how well
external counsel is performing.” –
Canadian Energy Company GC
“Because a fixed price, for example,
could in some cases be of more
interest than an agreed hourly rate
– easier to calculate.” – German
Financial Industry Senior Counsel
“Just to be able to go to [our board of
directors] and say ‘a second opinion
on this will cost ten thousand pounds
or twenty thousand pounds’ is just so
helpful. So I suspect that having had
the positive experience… it’s likely that
we will do it more.” – UK Financial
Industry Senior Counsel
“We want to move to value-based
arrangements because we think that is
a better alignment of incentives – for
both the corporation and law firm.” –
US Technology & Innovation AGC
Among US and UK respondents,
there was no change versus 2012
and 2013 surveys.
There are no significant
differences among regional
or industry segments.
41%
57%
2%](https://image.slidesharecdn.com/39a2dafd-ec14-4011-bf5d-3e8dc571786d-150516162818-lva1-app6891/85/2015-Litigation-Trends-Survey-LTS-v22-28-320.jpg)

![Norton Rose Fulbright – May 2015 37
Government and regulatory matters
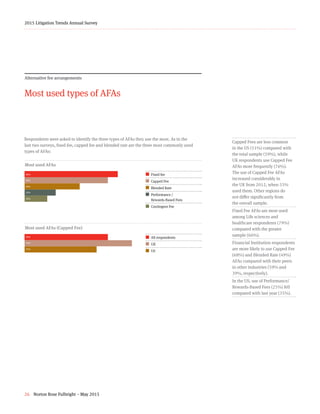
Government and regulatory matters
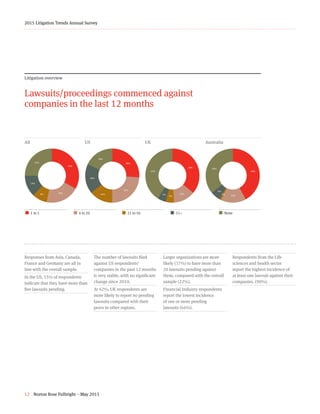
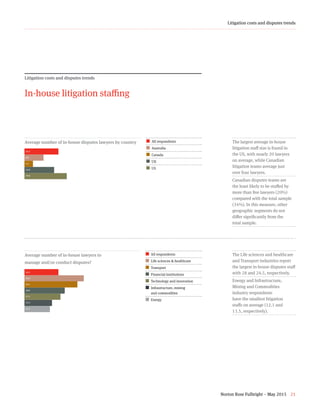
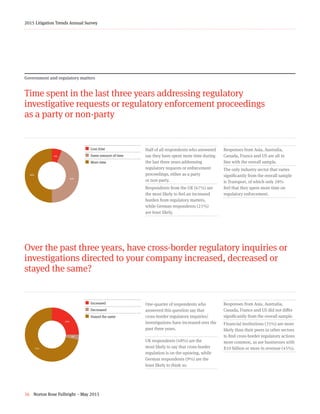
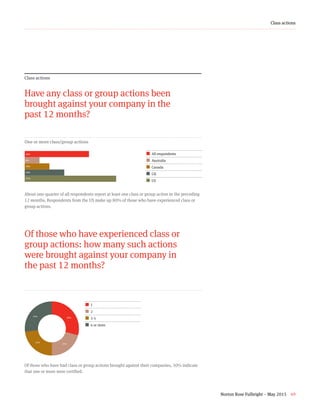
Where you have a cross-border dispute or
regulatory investigation, do you prefer using
a single law firm?
Reasons for preferring
a single firm:
1. Consistency/continuity
2. Centralized/single point
of contact
3. Coordination/logistics
4. Efficiency/more
efficient service
5. Cost effective
“Uniform flow of information and
process handling.” – German
conglomerate GC
“[A single firm may] act almost as
our outsourced in-house counsel
function.” - Australian Financial
Institution GC
“I prefer to use large firms with
multiple international offices so that
they can address all of the concerns
in one place.” – US Technology and
innovation GC
“Coordinating law firms—or rather
lack of coordination between different
firms—can often be a problem.” – UK
Financial Institution GC
“Because for us to be efficient, the
law firm needs a thorough knowledge
of our business, so with several law
firms, we would need to repeat the
same thing several times, and we’d
also have to pay each time.” – French
Technology and innovation CEO
73+27+zNearly three-quarters of
respondents prefer to use a single
law firm when facing cross-
border disputes or investigations.
¢ Yes
¢ No
German (95%) and Australian
(90%) respondents are
most likely to use one firm
across borders.
Responses from Asia, Canada,
France, UK and US do not
differ significantly from the
overall sample.
Mid-sized companies (90%) and
those with litigation budgets of
$1 million -$3 million (92%) are
more likely than their larger and
smaller peers to favor using one
law firm.
Energy industry respondents
(55%) are the least inclined to
prefer using a single firm.
73%
27%](https://image.slidesharecdn.com/39a2dafd-ec14-4011-bf5d-3e8dc571786d-150516162818-lva1-app6891/85/2015-Litigation-Trends-Survey-LTS-v22-37-320.jpg)

![Norton Rose Fulbright – May 2015 41
Electronic discovery
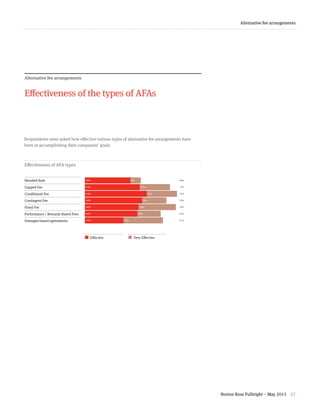
Electronic discovery
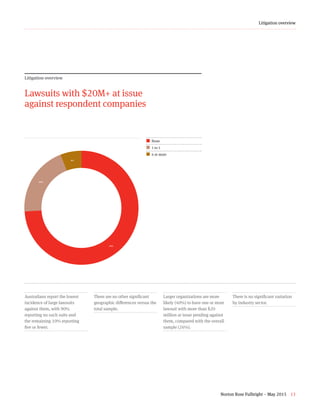
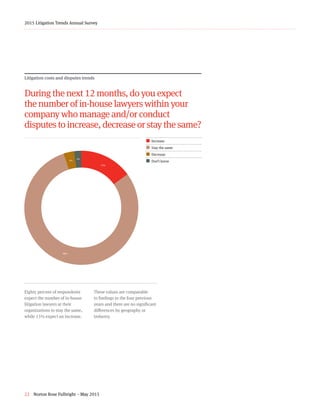
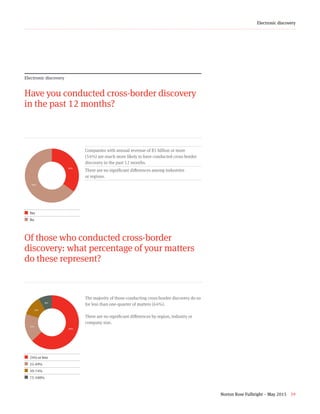
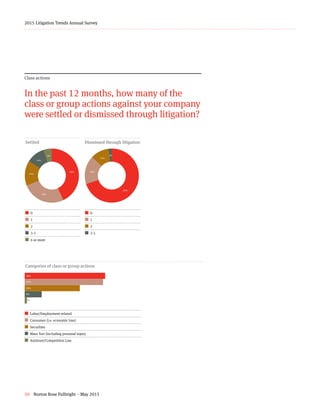
In what percentage of cases do you primarily
rely upon self-preservation?
26+9+5+12+19+29+z¢ None
¢ 1-24%
¢ 25-49%
¢ 50-74%
¢ 75-99%
¢ 100%
Life sciences and healthcare respondents (88%) are the most
likely to rely on self-preservation for at least some matters,
compared with the total sample (74%).
There are no other significant differences among regions,
industry or company size.
62+35+22
¢ IT collects data
¢ Company maintains data sources that prevent modifications
¢ Discovery vendor collects data
Top reasons respondents do not
rely on self-preservation
1. Cannot always rely on/
trust individuals
2. Greater certainty/
defensibility, lower risk
3. IT is more effective
4. Automatic storage/back-up
of data
“We can’t rely upon our employees
to know what is relevant, what is
not.” – Canadian Technology and
innovation GC
“Employees don’t understand the
impact of spoliation.” - US GC
“[Self-preservation] is not as reliable
as if you’re using an automated
system.” – UK GC
“We have a disaster recovery centre so
everything’s backed up.” – Australian
Technology and innovation GC
When you don’t rely on self-preservation,
how do you preserve potentially
relevant documents?
26%
9%
5%
12%
19%
29%
62%
35%
22%](https://image.slidesharecdn.com/39a2dafd-ec14-4011-bf5d-3e8dc571786d-150516162818-lva1-app6891/85/2015-Litigation-Trends-Survey-LTS-v22-41-320.jpg)


![Norton Rose Fulbright – May 2015 61
Forward-looking trends
Forward-looking trends
In your view, what is the most important
issue or trend in litigation impacting
your company?
Across our sample, the most cited
issue is an increasing number of
class actions.
Other top concerns include:
Employment/Labor issues
Increased oversight/scrutiny
by regulators
Costs of litigation
Increasingly litigious
environment
Intellectual property/patent
troll litigation
Increased/changing regulation
E-Discovery cost
Geographical region Trends
US Class actions and employment
UK Litigious environment and labor matters
Canada Class actions and changing legislation/court decisions
Australia
Class actions, increasing legal costs and a more
litigious environment
Germany
Increasing use of Alternative Dispute Resolution and increasing
class action volume
France
Class actions, higher litigation volume and more
contract litigation
Asia Increasing cost of time-consuming, sometimes frivolous litigation
Important trends
from respondents
“We are seeing class actions brought
where there is no harm and we are
starting to see courts allow this and it
creates substantial potential liability,
where there should be none.” – US
Technology and innovation company
Head of Litigation
“How easy it is for individuals to
bring lawsuits online, which I think
makes people more litigious.” – UK
Technology and innovation company
Chief Legal Officer
“The recent Supreme Court of
Canada's decision on good faith
obligation in contracts.” – Canadian
Energy company GC
“I think it is probably the class action
litigation particularly in the US. A lot
of the times it is without foundation,
you end up tackling it just to avoid the
ongoing cost of being involved in the
process, it is a pretty unsatisfactory
global system for class action in that
regard.” – Australian Technology and
innovation company GC
“The environment is getting tense.
Companies, when they have trouble
paying, will search in their contract
for a way not to [pay].” – French
Technology and innovation
company GC
“The trend in litigation will lead to
arbitration… [increasingly] in a third
country. It is happening more often
that neither of the two [parties] is
prepared to concede to the other
that they use their own country.” –
German Life sciences and healthcare
industry GC
“Frivolous legal actions claiming
extortionate amounts - a sign of a
more litigious society.” – Malaysian
Infrastructure, mining and
commodities industry GC](https://image.slidesharecdn.com/39a2dafd-ec14-4011-bf5d-3e8dc571786d-150516162818-lva1-app6891/85/2015-Litigation-Trends-Survey-LTS-v22-61-320.jpg)