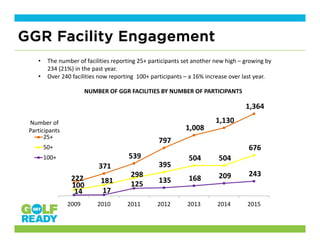
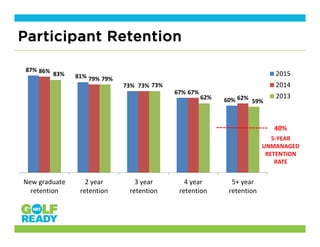
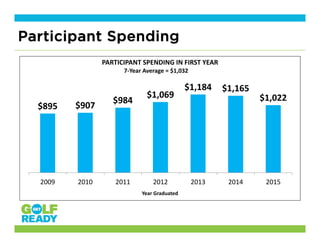
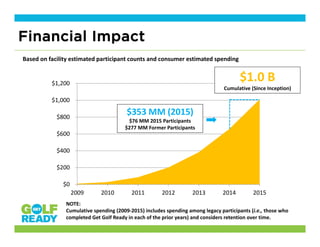
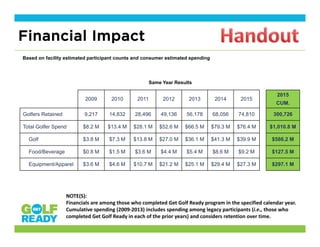
17,725
28,755
51,532
75,898
85,677
98,919107,485
2009 2010 2011 2012 2013 2014 2015
25.3
31.9
40.5
35.2 35.7 37.9 40.9
2009 2010 2011 2012 2013 2014 2015
Growth in Facility Execution
700 902
1,271
2,156
2,399 2,610 2,628
2009 2010 2011 2012 2013 2014 2015
2,628 Active Facilities
40.9 Students Per Facility
8% increase over 2014
107,500 GGR Students
9% increase over 2014
222 
371 
539 
797 
1,008 
1,130 
1,364 
100 
181 
298 
395 
504  504 
676 
14  17 
125  135  168  209  243 
2009 2010 2011 2012 2013 2014 2015
25+
50+
100+
GGR Facility Engagement
• The number of facilities reporting 25+ participants set another new high – growing by 
234 (21%) in the past year.
• Over 240 facilities now reporting  100+ participants – a 16% increase over last year.
Number of 
Participants
NUMBER OF GGR FACILITIES BY NUMBER OF PARTICIPANTS
Participant Overview
66%
24%
39%
97%
62%
21%
35%
98%
60%
20%
39%
96%
Female Minority Never played
golf before
GGR met/exceeded
expectations
2015
2014
2013
87%
81%
73%
67%
60%
86%
79%
73%
67%
62%
83%
79%
73%
62%
59%
New graduate
retention
2 year
retention
3 year
retention
4 year
retention
5+ year
retention
2015
2014
2013
Participant Retention
5‐YEAR
UNMANAGED
RETENTION
RATE
40%
PARTICIPANT SPENDING IN FIRST YEAR
$895  $907 
$984 
$1,069 
$1,184  $1,165 
$1,022 
2009 2010 2011 2012 2013 2014 2015
Participant Spending
7‐Year Average = $1,032
Year Graduated
Based on facility estimated participant counts and consumer estimated spending
NOTE: 
Cumulative spending (2009‐2015) includes spending among legacy participants (i.e., those who 
completed Get Golf Ready in each of the prior years) and considers retention over time.
$0
$200
$400
$600
$800
$1,000
$1,200
2009 2010 2011 2012 2013 2014 2015
$1.0 B
Cumulative (Since Inception)
$353 MM (2015)
$76 MM 2015 Participants
$277 MM Former Participants 
Financial Impact
Introductory Adult Group Instruction
6,177
Offered introductory 
adult group instruction 
program(s) in 2015
Offer GGR
2,628
Offer other introductory adult 
program(s) only
(Influenced by GGR)
1,224
Offer other
introductory adult 
program(s) only
(Not influenced by GGR)
2,325
Financial Impact
2009 2010 2011 2012 2013 2014 2015
2015
CUM.
Golfers Retained 9,217 14,832 28,496 49,136 56,178 68,056 74,810 300,726
Total Golfer Spend $8.2 M $13.4 M $28.1 M $52.6 M $66.5 M $79.3 M $76.4 M $1,010.8 M
Golf $3.8 M $7.3 M $13.8 M $27.0 M $36.1 M $41.3 M $39.9 M $586.2 M
Food/Beverage $0.8 M $1.5 M $3.6 M $4.4 M $5.4 M $8.6 M $9.2 M $127.5 M
Equipment/Apparel $3.6 M $4.6 M $10.7 M $21.2 M $25.1 M $29.4 M $27.3 M $297.1 M
Based on facility estimated participant counts and consumer estimated spending
NOTE(S): 
Financials are among those who completed Get Golf Ready program in the specified calendar year. 
Cumulative spending (2009‐2013) includes spending among legacy participants (i.e., those who 
completed Get Golf Ready in each of the prior years) and considers retention over time.
Same Year Results

2015 GGR Results