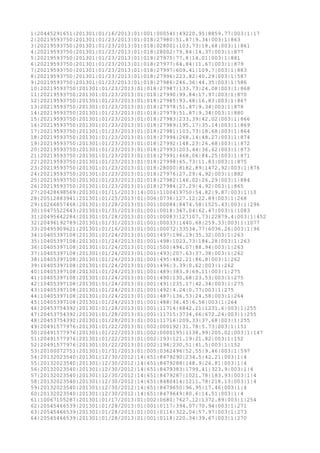
The document appears to contain 100 rows of transaction data, with each row containing 14 values including an account number, date, item codes, and monetary amounts. The transactions span multiple dates from January 11th to January 31st, 2013 and include a wide range of amounts from $0.62 to over $127,000.
The document provides a table of critical values for the chi-square distribution for degrees of freedom ranging from 1 to 100. The table includes critical values for several common significance levels including 0.25, 0.10, 0.05, 0.01, 0.005, and 0.001. Each row of the table lists the critical value of the chi-square distribution for a given degree of freedom at each of the six significance levels.
The document contains a table with various hydraulic parameters including:
- K coefficient
- Angle (radians and degrees)
- Dimensionless parameters involving angle
- Differences between parameters
- Wetted area, wetted perimeter, hydraulic radius, velocity, depth, and diameter.
The table contains values for these parameters for different pipe materials with varying angles and coefficients.
- The document appears to contain experimental data from a dilatometer test measuring various parameters like strain, stress, temperature over time as a sample is heated to 600°C.
- Metrics like dilatometer reading, force, stroke, and temperature from thermocouples are recorded at regular time intervals as the test is conducted.
- The data shows changes in things like strain, stress, and temperature as the material is heated and expands over the duration of the 80 second test.
This document contains a table with statistical significance levels (p-values) for different degrees of freedom and alpha values. The table lists critical values for p-values of 0.01, 0.025, 0.05, 0.075 and 0.1, with corresponding alpha levels and confidence intervals. It provides critical values for statistical significance testing with degrees of freedom ranging from 1 to 30.
This document contains three tables related to finance mathematics:
1. Table I shows the accumulation factor of capital for interest rates ranging from 1% to 18% compounded annually over periods of 1 to 18 years.
2. Table II shows the present value factor of a series of payments for the same range of interest rates and time periods.
3. Table III shows the accumulation factor of capital for a series of payments with interest rates from 1% to 18% over periods of 1 to 13 years.
Matemática financeira 6 tabelas financeiras de alto nível - by prof. shibat...prof. Renan Viana
This document contains two tables. The first table shows the number of days in each month for a standard 365 day year and a leap (366 day) year. The second table contains factors used to calculate compound interest over different periods of time at varying annual interest rates.
The document appears to contain numerical data across multiple categories including potential threats, equipment types, response times, and other factors. The data includes 77 entries with values ranging from -0.087866 to 0.246748 for the first category. Location or device-based data is also included for some categories.
The document contains a list of 85 identification numbers, each associated with a quantity. It also includes two tables with additional identification numbers, quantities, dates and other details. The identification numbers appear to be for chemical or pharmaceutical products but no other context is provided.
The document contains two tables providing future value interest factors for one dollar and one dollar annuities compounded at various interest rates over different periods of time. Table A-1 shows the future value of $1 invested at rates from 1% to 30% over periods from 1 to 30 years. Table A-2 shows the future value of a $1 annuity invested at the same rates and periods. The tables allow users to determine the future values of single investments and annuities based on the interest rate and time horizon.
This document contains tables of compound interest factors for interest rates of 1/4%, 1/2%, and 3/4% compounded annually. The tables show the factors needed to calculate future and present values of single payments, uniform series payments, and arithmetic gradient series payments over a range of time periods from 1 to 480 years.
The document contains tables listing future value interest factors and future value interest factors of an ordinary annuity for interest rates ranging from 1% to 20% over periods of 1 to 40 years. The future value interest factor table shows the factor needed to calculate the future value of a present amount given a certain interest rate and time period. The future value interest factor of an ordinary annuity table shows the factor required to calculate the future value of an annuity with regular payments made over a certain time period.
The document appears to contain tabular data with measurements of various angles, ratios, and quantities across increasing h/D values. There are 17 columns of numeric data ranging from 0.0005 to 0.554 for the h/D column. The remaining columns contain measurements of grad, R/RII, V/VII, Q/QII, and R/D.
This document contains a table of critical values for the chi-square distribution with degrees of freedom (df) ranging from 0 to 136 and significance levels of 0.1, 0.05, 0.025, 0.001, and 0.005. The table lists the critical value that corresponds to each combination of df and significance level.
The document appears to be a table containing stock price and valuation data for multiple companies. It includes columns for stock price, estimated fair price, percentage difference between current and fair price, and other valuation metrics. The table contains data for over 100 stock ticker symbols.
This document contains tables of compound interest factors for interest rates of 0.25% and 0.5% compounded annually over various time periods from 1 to 480 years. The tables show the compound amount, present worth, sinking fund, capital recovery, uniform series, and gradient factors for single payments, arithmetic gradients, and present worth calculations.
This document contains a table of critical values for the chi-squared distribution for different probabilities (p-values) and degrees of freedom (ν). The table lists the minimum value of the chi-squared statistic that would be considered statistically significant for various combinations of p-values ranging from 0.001 to 0.5 and ν ranging from 1 to 200, 300, 500, 600.
MR. AMIR IKRAM is a resource person with an MPhil from GC University Lahore and an MBIT in Finance from Punjab University. The document contains tables with values for future value (FV), present value (PV), and other time value of money calculations at varying interest rates and time periods. The tables provide the calculations for interest rates from 2% to 18% and time periods from 1 to 50 years for future value, and periods from 1 to 20 years for present value.
The document provides a table of thermophysical properties of refrigerant 22 (chlorodifluoromethane) at various temperatures ranging from -100°C to 32°C. For each temperature, the table lists properties of saturated liquid and saturated vapor including pressure, density, enthalpy, entropy, specific heat, and more. The extensive table acts as a reference for engineers to look up refrigerant 22 properties under different temperature conditions.
Multi Objective Optimization of PMEDM Process Parameter by Topsis Methodijtsrd
In this study, MRR, SR, and HV in powder mixed electrical discharge machining PMEDM were multi criteria decision making MCDM by TOPSIS method. The process parameters used included work piece materials, electrode materials, electrode polarity, pulse on time, pulse off time, current, and titanium powder concentration. Some interaction pairs among the process parameters were also used to evaluate. The results showed that optimal process parameters, including ton = 20 µs, I= 6 A, tof = 57 µs, and 10 g l. The optimum characteristics were MRR = 38.79 mm3 min, SR = 2.71 m, and HV = 771.0 HV. Nguyen Duc Luan | Nguyen Duc Minh | Le Thi Phuong Thanh ""Multi-Objective Optimization of PMEDM Process Parameter by Topsis Method"" Published in International Journal of Trend in Scientific Research and Development (ijtsrd), ISSN: 2456-6470, Volume-3 | Issue-4 , June 2019, URL: https://www.ijtsrd.com/papers/ijtsrd23169.pdf
Paper URL: https://www.ijtsrd.com/engineering/manufacturing-engineering/23169/multi-objective-optimization-of-pmedm-process-parameter-by-topsis-method/nguyen-duc-luan
This document contains a table of critical values for the chi-squared distribution. The table lists the critical value of chi-squared for different degrees of freedom and significance levels ranging from 0.001 to 0.995. The table is used to determine if a calculated chi-squared value is statistically significant for hypothesis testing.
ENERGIEEFFIZIENZ Standortkiller oder Innovationstreiber?Mateus Siwek
Die Studie liefert folgende Informationen:
› Konkrete Einsparmöglichkeiten
› Potenziale der verschiedenen Technologien und ihren ROI
› Finanzielle Fördermöglichkeiten
› Aufgaben und Hilfestellungen für den Energiemanager
› Strategischer Einsatz von Energieeffizienzmaßnahmen und Schaffung
von Standortvorteilen
› Energiemanagement
› Wirtschaftliche und rechtliche Rahmenbedingungen
› Verbreitung und Erfolg der verschiedenen Energieeffizienzmaßnahmen
Willkommen im Hotel Neubergerhof, willkommen an einem der schönsten Urlaubsplätze im Salzburger Land.
Erleben Sie tolle Momente mit der ganzen Familie bei einer Wanderung über Wiesen und Wälder am Fuße der Bischosfmütze und des Dachsteins.
Auch für Mountainbiker hat das Bergdorf Filzmoos einiges zu bieten. E-Bikes sind super für all diejenigen, die die Bergwelt auf die bequeme Art und Weiseerkunden möchten.
Während eines Geländeausrittes mit unserer Reitbetreuerin Geli liefern sich WASTL und seine Pferdekollegen spannende Wettrennen über die Forststraßen der Neuberger Wälder.
Auch Kletter auf Felsen und auf der 6m hohen Indoor Kletterwand ist möglich. Begleitet von ausgebildeten Guides erklimmen Sie Ihren ganz persönlichen Gipfel!
Aktivurlaub wird im Hotel Neubergerhof in Filzmoos ganz groß geschrieben. Aber auch die erholsamen Momente sollen nicht zu kurz kommen.
Wir freuen uns auf Ihren Besuch!
Ihre Familie Reiter
und das gesamte Neubergerhof Team
Valorisation d'itinéraires touristiques sur le thème du personnage de Saint-M...aucharle
Etude réalisée autour de la problématique : Quelles activités peut-on proposer pour valoriser économiquement les chemins de Saint Martin de Tours?
Quatre options ont particulièrement été développées, les activités :
- religieuses ;
- culturelles ;
- basées sur le patrimoine culinaire et viticole ;
- basées sur le thème du partage citoyen.
Observance fiscale: Quels défis pour les organismes de bienfaisance. Jean-Pau...Philanthropie-qc
Philanthropie Québec a tenu son premier déjeuner-conférence intitulé Observance fiscale : quels défis à relever pour un Organisme de bienfaisance, le 29 février 2012.
The document contains progress reports from 2008 to 2010. It likely details various projects and initiatives that were ongoing during that period, providing updates on progress made, challenges encountered, and next steps planned. The reports allow tracking of developments over multiple years on whatever topics were being addressed from 2008 through 2010.
Retour d’expérience "La Boutique en ligne de Tunisiana"MEDIANET
Retour d’expérience La Boutique en ligne de Tunisiana. présentée par Mr. Marwen Ben Messaoud (Responsable Web et E-commerce Tunisiana) et Mr. Iheb BEJI (Directeur Général MEDIANET).
http:\\laboutique.tunisiana.com
This document provides an overview and instructions for using PgRouting. It begins by explaining what PgRouting is and its applications for routing and graph analysis. It then covers importing data from OpenStreetMaps, shapefiles and other sources. The document proceeds to demonstrate various routing algorithms like Dijkstra's algorithm, A* algorithm and K-shortest paths. It also shows how to calculate driving distances and generate isochrone maps. Visualizing results in QGIS is also demonstrated. The document provides a practical guide to using PgRouting's functions for routing and network analysis.
This document provides a table that converts fractions of an inch to millimeters and vice versa in increments from 1/64 of an inch up to 1 inch. It includes both fractional inch and decimal inch equivalents as well as the corresponding millimeter measurements.
The document appears to contain numerical data in a table format with percentages listed across the top and increasing whole numbers down the left side. The interior of the table contains increasing decimal values with up to 4 decimal places.
This document provides stock price data for 8 companies (TSLA, AMZN, WMT, AAPL, F, DIS, IBM, MSFT) from July 2010 to December 2016 in a table with the adjusted closing price for each stock listed for each month. The data will be used for a project analyzing the efficient frontier for a portfolio of these stocks.
The document shows a table with interest compounding factors over 31 periods for interest rates ranging from 1% to 15%. The table allows users to look up the factor that accounts for interest compounding over a given number of periods at a particular interest rate. Factors increase as the interest rate or number of periods increase, showing how savings grow faster with higher rates or longer investment timelines with compound interest.
The document shows a table with interest compounding factors over time for interest rates ranging from 1% to 15% annually. The table has the factors for time periods from 1 to 31 years across columns for the different interest rates. The factors show how much an initial investment will grow to over time with compound interest at the given annual rates.
This document contains a table showing the factor of capital accumulation with compound interest over time. The table shows the factor for interest rates ranging from 1% to 15% over periods of 1 to 40 years in intervals of 1 year. The higher the interest rate and number of years, the higher the factor and accumulated capital value.
This document contains a table with percentiles for the chi-squared distribution across various degrees of freedom (g.l.) and significance levels. It shows the critical value needed to reject the null hypothesis for different sample sizes and confidence levels in chi-squared tests of independence and goodness of fit.
Laporan 1 Sistem dan Signal (DFT Ms. Excel)Bayu Nurcahyo
Menganalisis gelombang suara manusia dengan merekam suara bernada diatonis pada Software Spectraplus V5.0. lalu mencari persamaan gelombang dengan bantuan pengolahan data Ms. Excel
Sample Calculations for solar rooftop project in Indiadisruptiveenergy
This document provides a financial analysis of a proposed solar PV rooftop project over 25 years. It outlines key steps and parameters to consider, including net metering rules, installation costs, internal rate of return, return on investment, payback period, lifetime savings, and discount rate. Tables show projected annual energy generation, costs, revenues, and financial metrics to help evaluate the project's feasibility and profitability. The analysis aims to help consumers make informed decisions without being misled by inaccurate information from solar companies or officials.
Como se utiliza la tabla t de student (formulas)Zully HR
The document contains tables of values with increasing levels from 0.55 to 0.995. The values seem to correspond to statistical calculations for levels of significance and critical values.
The document contains tables of values with increasing levels from 0.55 to 0.995. The values seem to relate to statistical calculations for determining critical values and levels of significance across different sample sizes and distributions.
This document appears to be a list of 84 item codes along with associated dates and values. Each item has a unique identification code, date in the format of month/day, and a number value between 1-4.
The document contains tables with factors for compound interest accumulation and present value of uniform series in postponed payments. The compound interest accumulation table shows the factor, which is (1+i)^n, for interest rates from 1% to 15% and periods from 1 to 40 years. The uniform series present value table shows the factor, an,i, for calculating present value of uniform series payments with interest rates from 1% and periods from 1 to 40 years.
1) The document presents the results of two GARCH models (GARCH(1,1) and GARCH(1,1)-AR(2)) fitted to RKLCI return data from 2000 to 2005.
2) Both models show no autoregression or heteroskedasticity based on diagnostic tests of the residuals.
3) Model 2, which includes an AR(2) term, has a slightly better fit based on information criteria.
This document appears to contain statistical analysis results from measuring 120 people on 74 items, including differential item functioning (DIF) measures. It lists DIF measures, standard errors, contrasts, t-statistics, and probability values for comparisons between different person groups on several test items. Significant DIF was found for some items between different person groups.
The document lists American Wire Gauge (AWG) wire sizes from 36 to 2000 in both imperial and metric units, providing the wire diameter, cross-sectional area, and standard size for each listing. Wire sizes range from 0.0050 inches to 2 inches in diameter, and include common wire gauges for solid copper conductors used in electrical work.
The document appears to be a log of financial transactions, listing transaction details such as transaction amounts, fees, and net amounts for 14 separate transactions ranging from $1.48 to $3388.69. Key details provided for each transaction include dates, transaction IDs, account numbers, amounts, fees and net amounts.
This document contains a table of values representing the area under the standard normal distribution curve to the left of given z-scores, ranging from -3.9 to 3.9. The table provides the cumulative probability or proportion of the total area under the normal curve that lies between minus infinity and the given z-score.