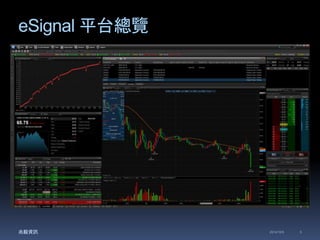
#2 大家好,非常榮幸今天有機會來到 XX 證券拜訪,兆毅資訊在最近取得了 Interactive Data 的產品代理。在正式推出之前,我們想先聽聽各位業內專業人士對產品的看法,以便做為上市前的參考依據。
那在開始之前,想請問各位有聽過 Interactive Data 這家公司嗎?
沒有:
那讓我鮮花點時間介紹一下 Interactive Data 這家公司的主要業務及產品服務
有:
那麼可以請你大略描述你對 Interactive Data 的印象嗎?
非常好!那就讓我做更進一步的詳細說明 Interactive Data 這家公司的主要業務及產品服務
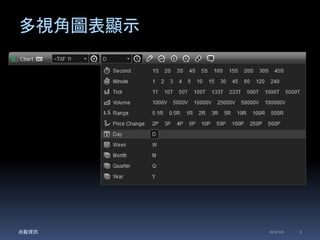
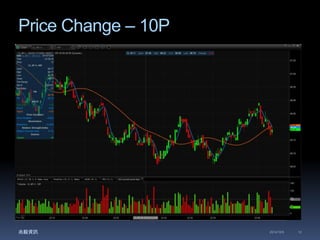
#9 Price Change Bar Chart: A Price Change Bar chart is an Interval chart that uses changes in price, instead of time, to display the data. Instead of using a 1 minute chart, you might want 10 price changes per bar. Only a price change counts in this type of bar chart.
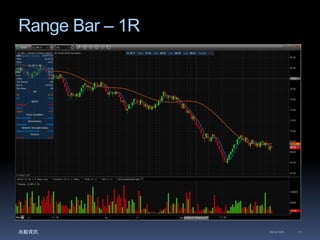
Range Bar Chart A Range Bar chart is a type of tick chart that creates new bars based on a predetermined price range. This range is set by the user to calculate the difference between the high and low value for each bar. The bar will continue to build as long as this high/low range is less than or equal to the user defined range. Once a trade occurs outside this range, a new bar is formed and the calculation resets and continues. For example, if you set a $1 range for a non-volatile stock, if the trading activity never expands beyond $1 (i.e. a trading range of 25.50 to 25.80), then you'd only paint one bar for that activity. Note: Range Bar charts are available with eSignal Version 10.0 or higher.