Hyundai Commercial presented its 2012 financial results showing:
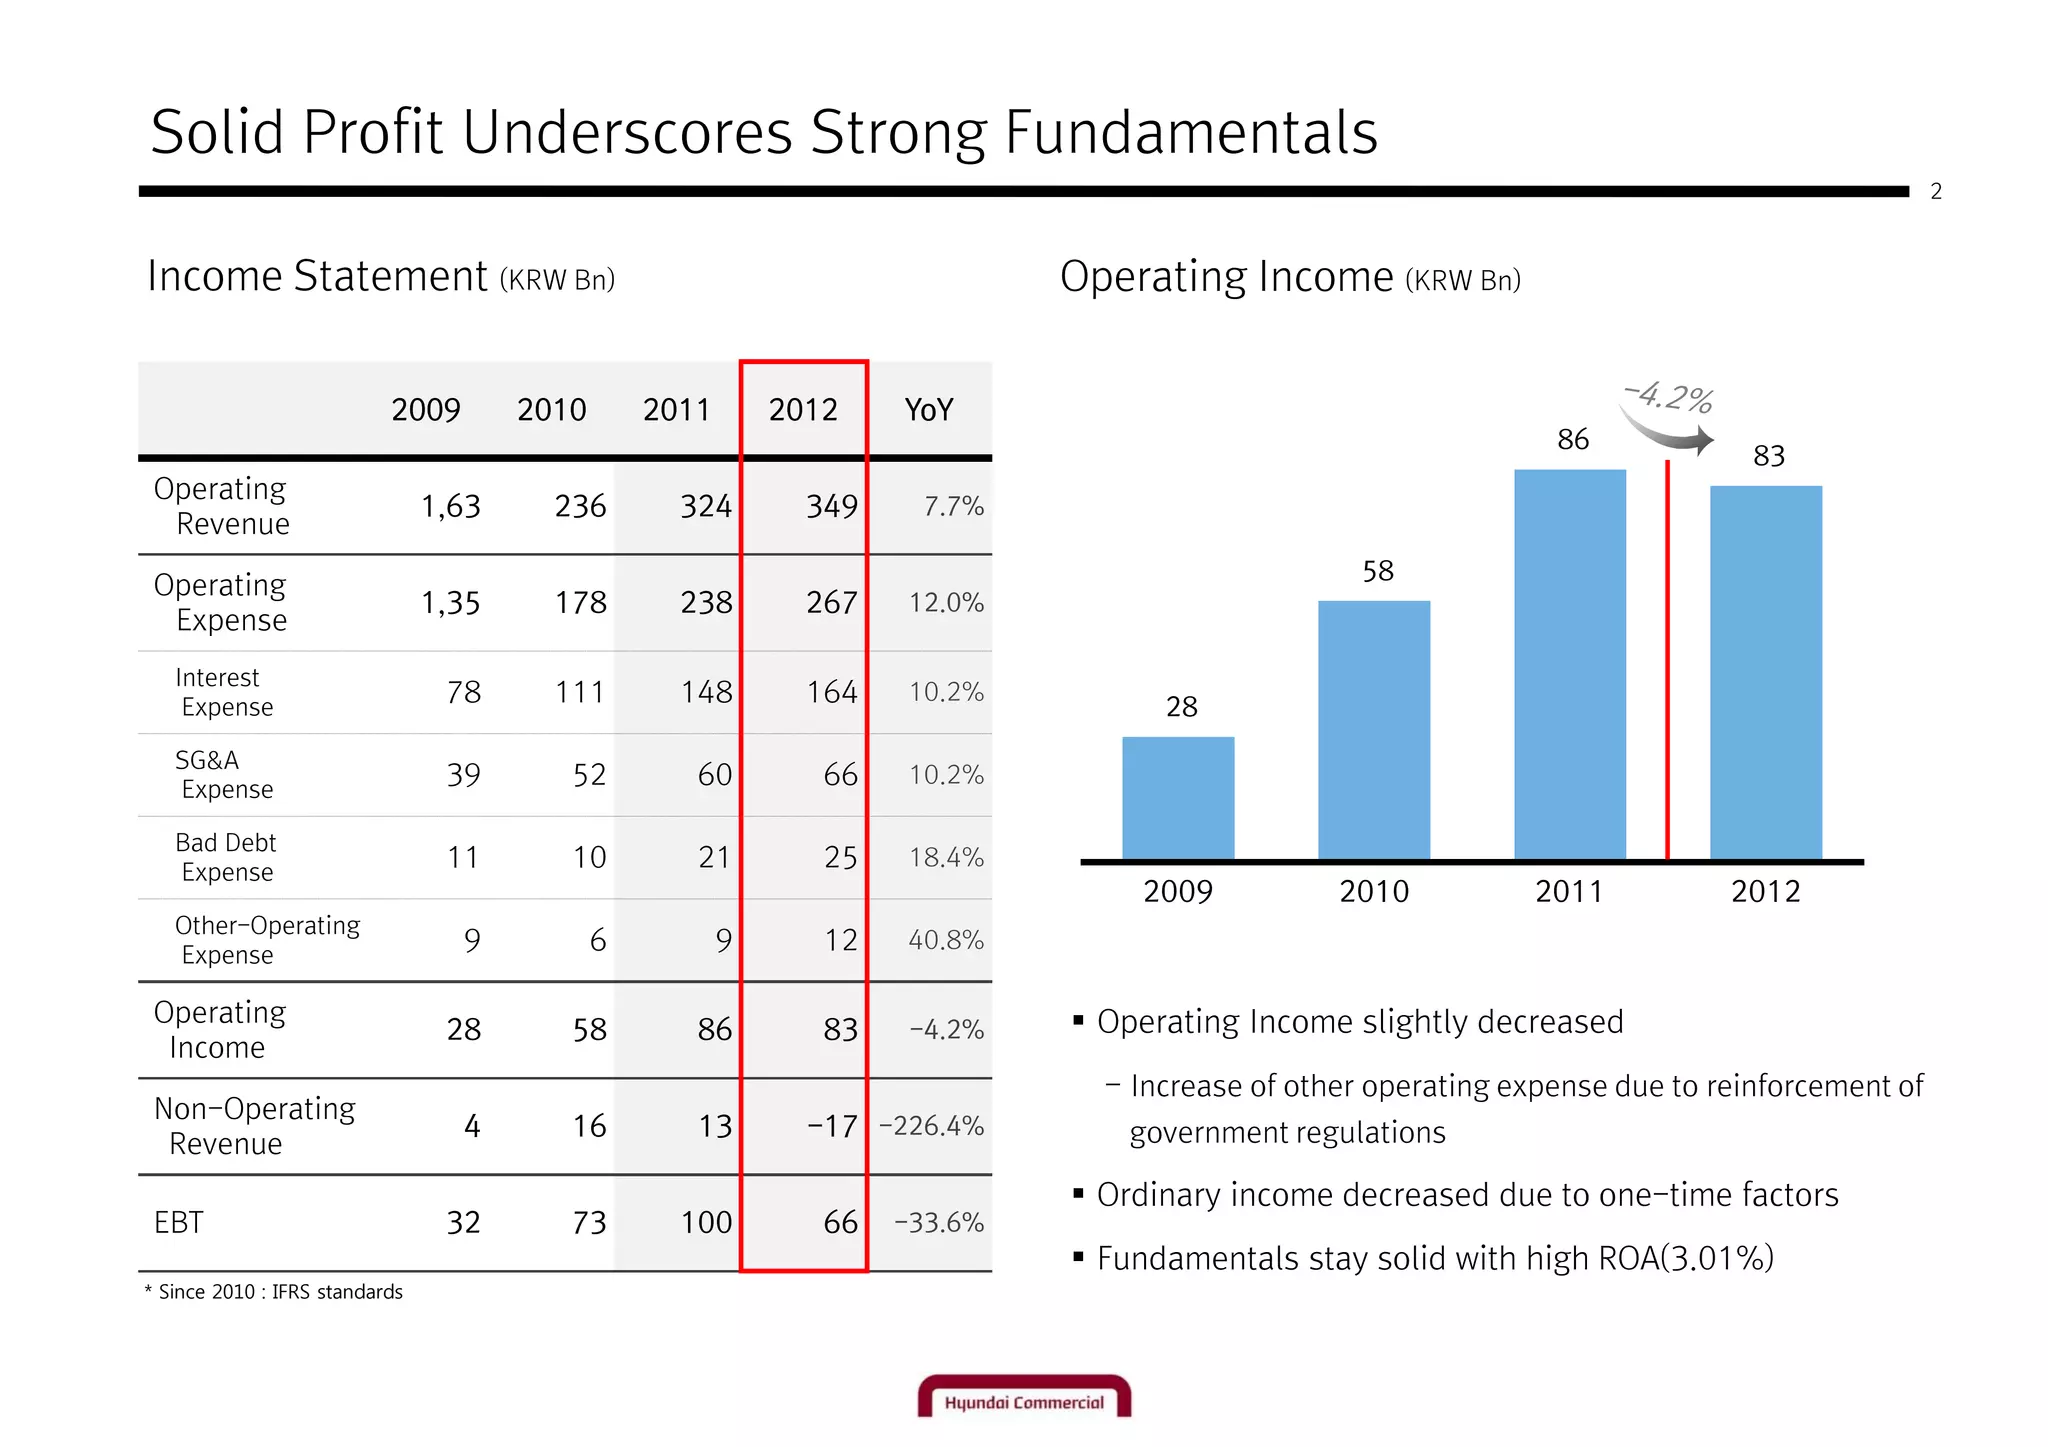
1) Operating income slightly decreased from the previous year due to increases in other operating expenses from government regulations.
2) While ordinary income decreased due to one-time factors, the company's fundamentals remained solid with a high return on assets of 3.01%.
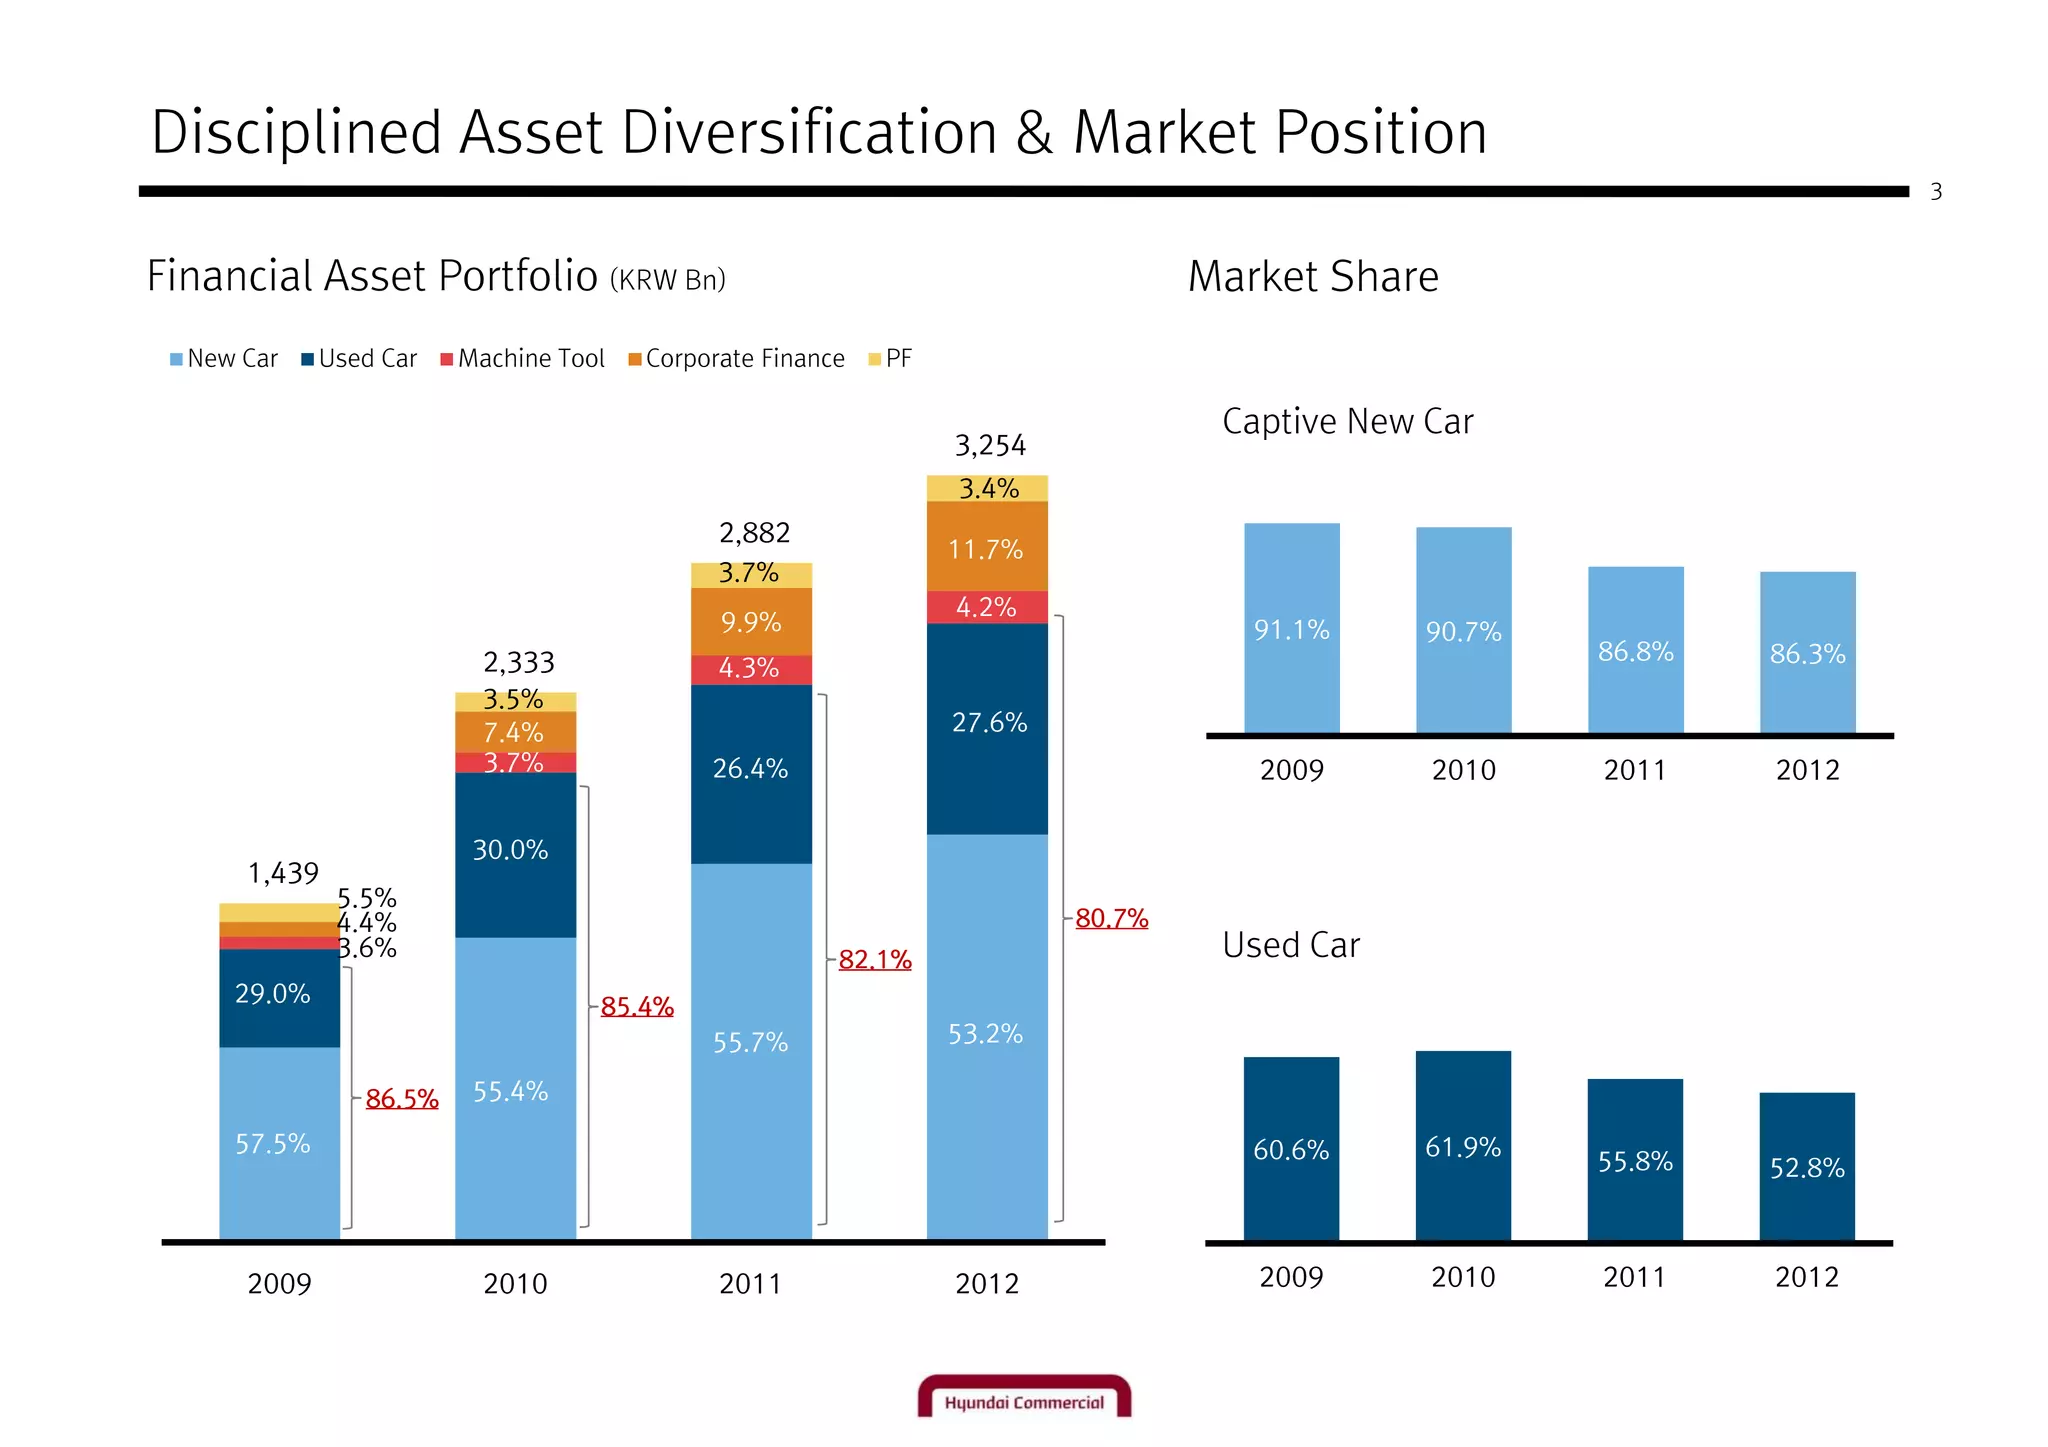
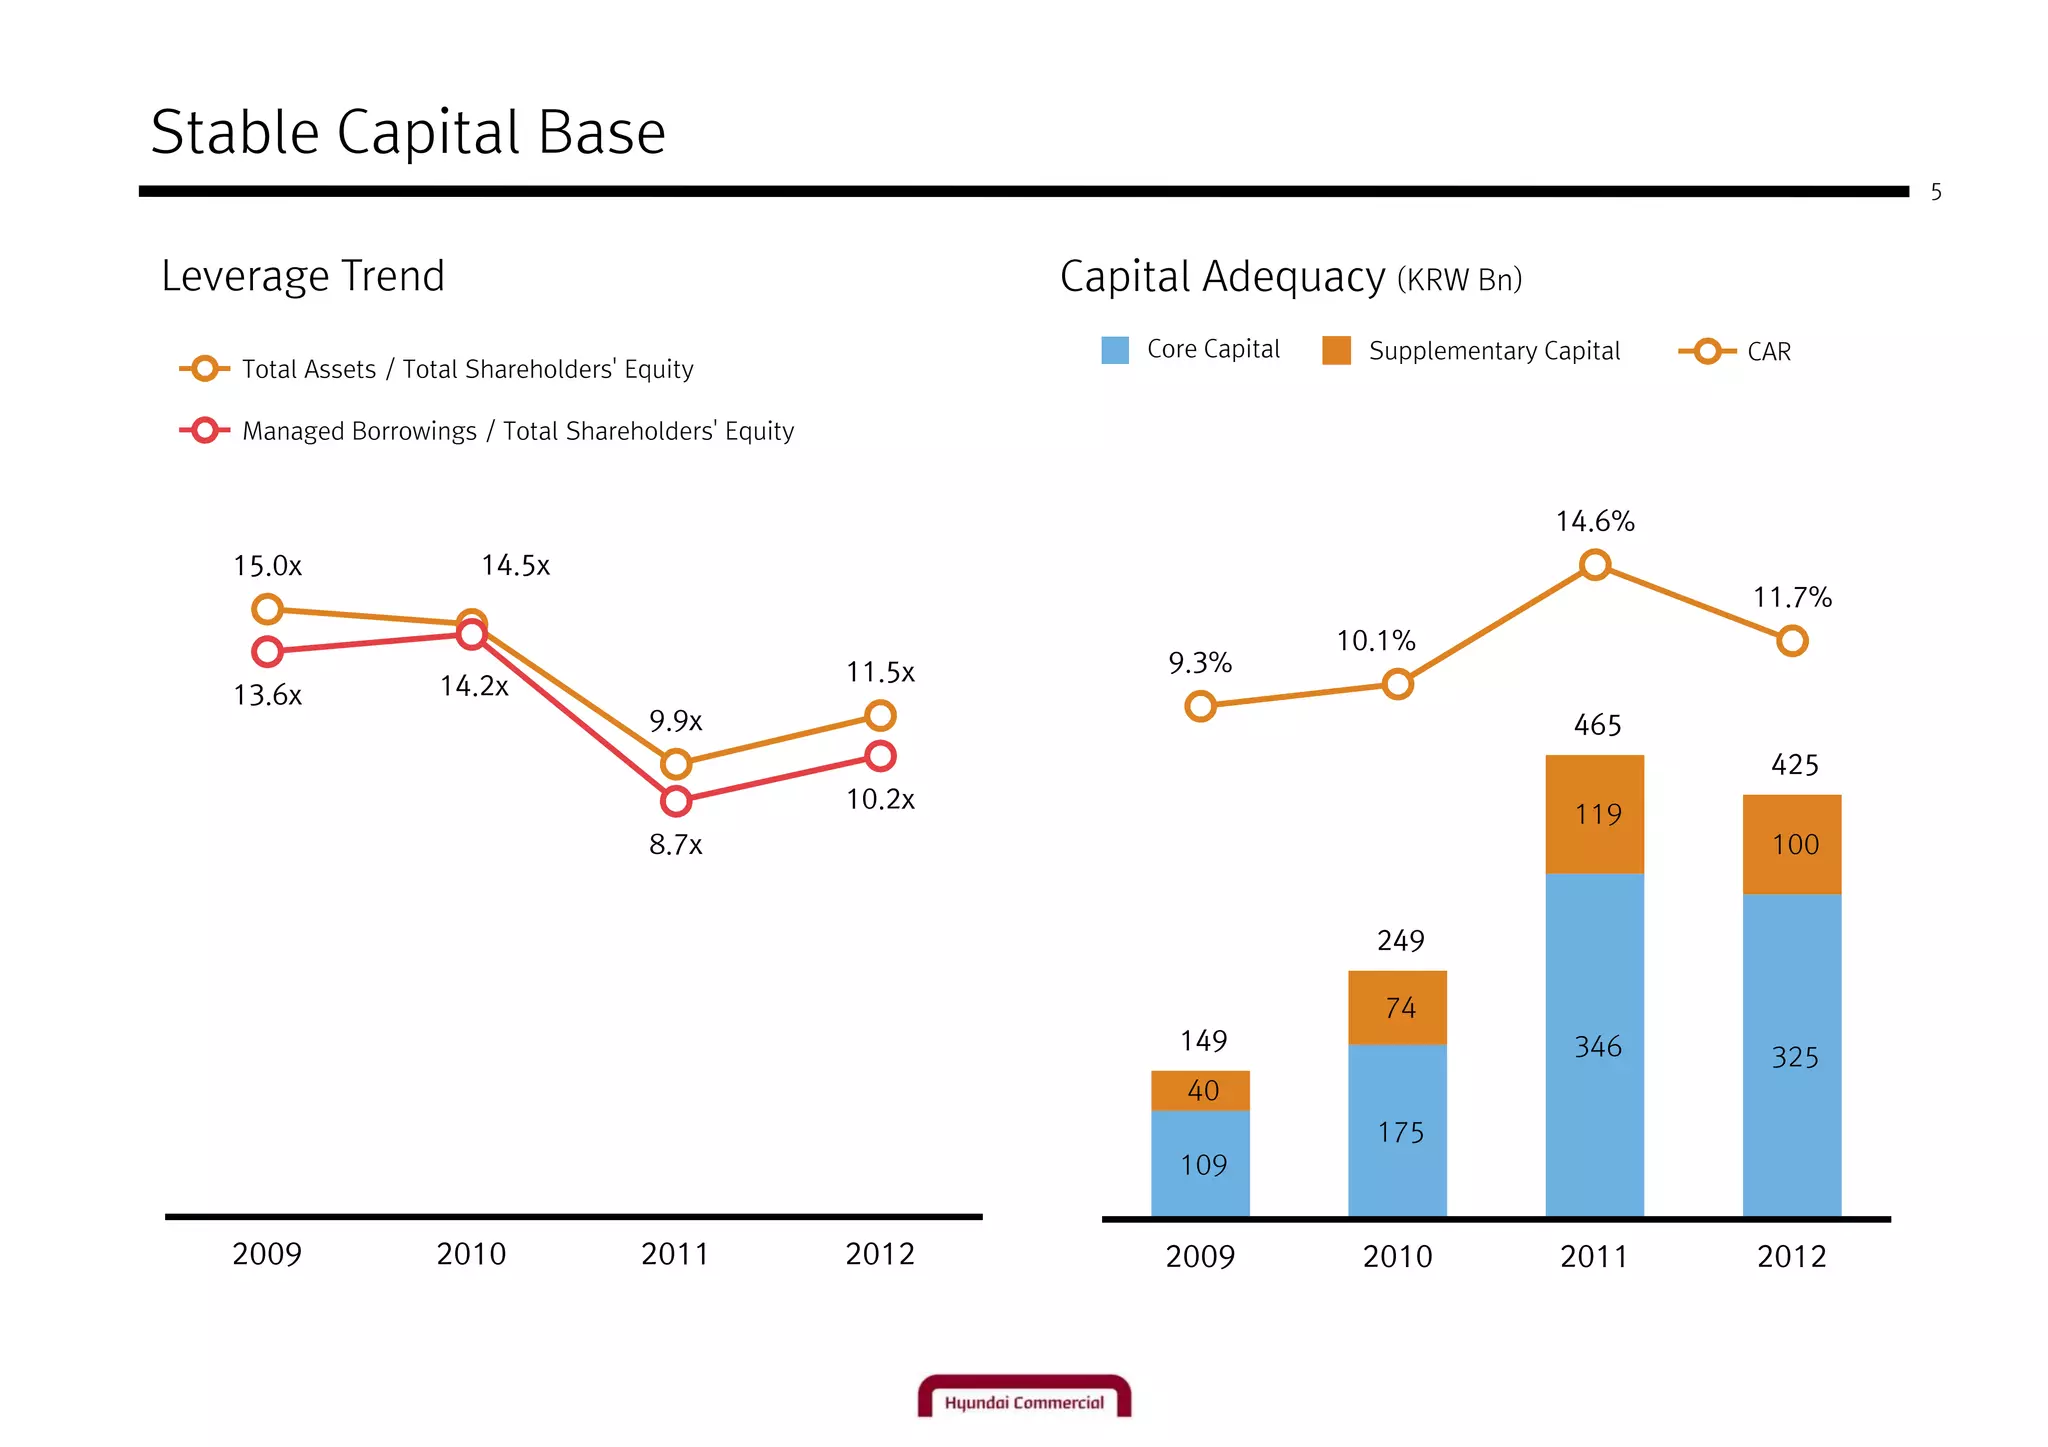
3) The company maintained disciplined asset diversification across its financial businesses and stable capital levels above regulatory requirements.
![[Appendix 1] Fact Sheet - HCI
(Unit : KRW Bn) 2008 2009 2010 2011 2012
Domestic Sales of Sum(unit) 20,152 19,795 21,479 18,842 15,620
Commercial Vehicles HMC/KMC M/S 54.0% 60.1% 64.2% 65.8% 62.3%
Total 1,050 1,439 2,333 2,882 3,254
Asset
Auto Sector 77.8% 86.4% 85.4% 82.1% 80.7%
Portfolio
Others 22.2% 13.6% 14.6% 17.9% 19.3%
Substandard & Below 1.2% 0.7% 0.9% 1.2% 1.5%
Asset NPL 1.2% 0.6% 0.6% 1.0% 1.0%
Quality 30+ Delinquency 2.1% 0.9% 1.0% 0.8% 1.1%
NPL Coverage ratio 140.8% 224.7% 172.5% 84.1% 114.8%
Profitability Operating Income 14.1 27.6 57.5 86.4 82.8
Asset & Capital Adequacy Ratio 7.8% 9.3% 10.1% 14.6% 11.7%
Leverage Borrowing Leverage 15.3X 15.0X 14.5X 9.9X 11.5X
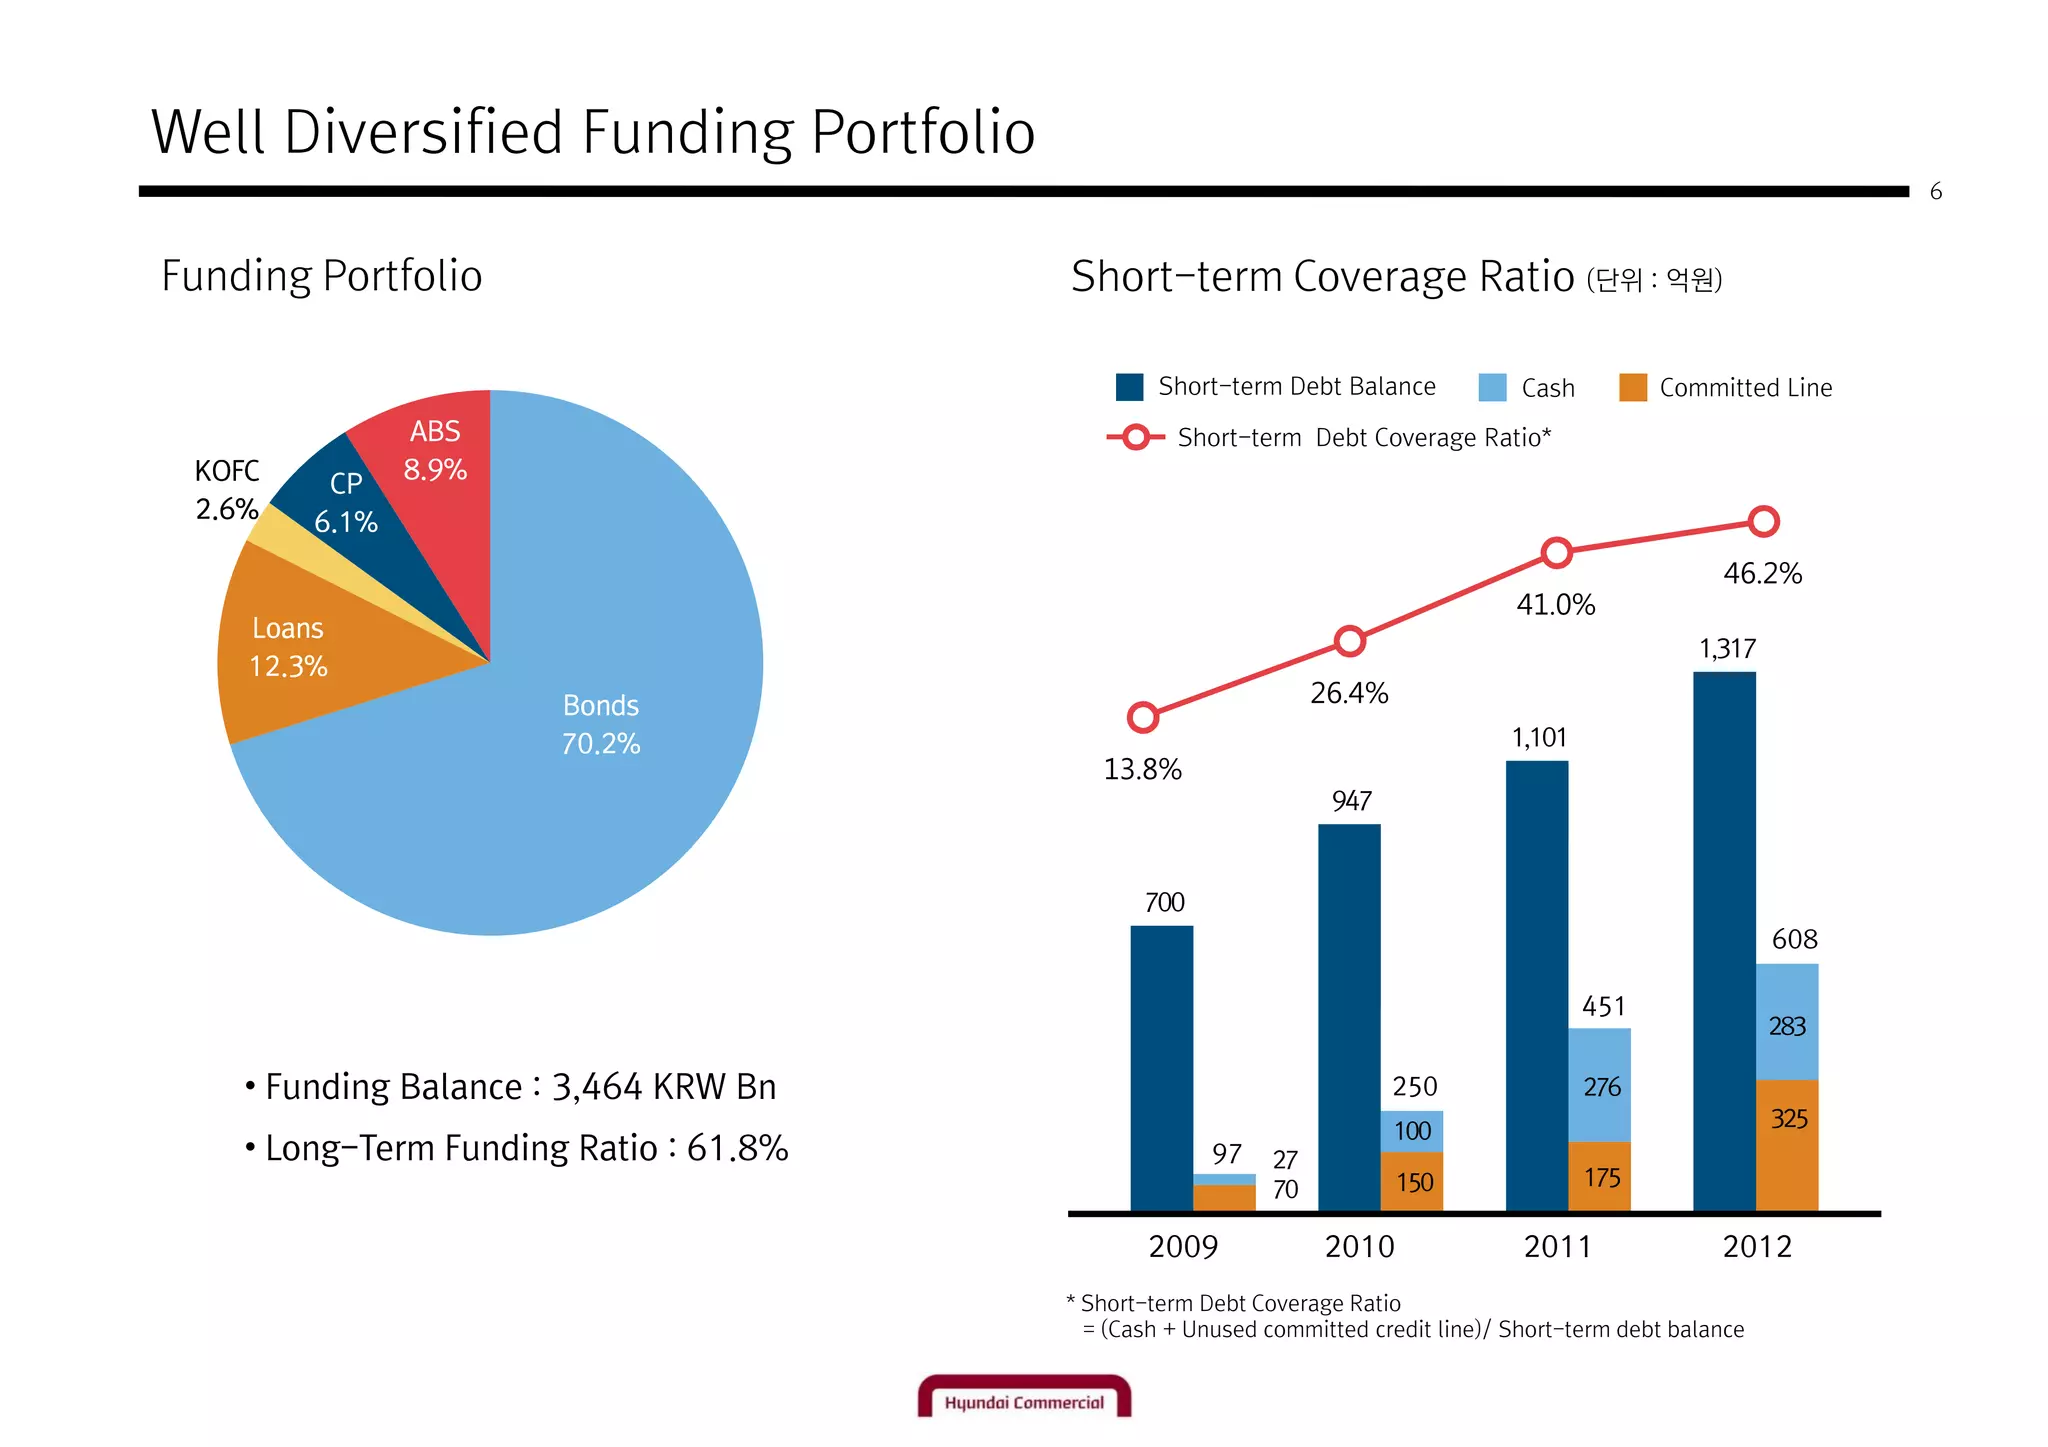
Bond / Loan 91.1% 80.9% 78.8% 83.5% 85.0%
CP 8.9% 19.1% 13.0% 4.6% 6.1%
Funding
ABS - - 8.1% 11.9% 8.9%
Portfolio
Total 998 1,481 2,477 3,026 3,464
CP Coverage 124.1% 34.2% 77.4% 322.1% 289.4%
Debt Maturity - 1.37Y 1.69Y 1.79Y 1.66Y
Debt
Maturity 2013 2014 2015 2016 2017∼
Maturity
Volume 1,317 1,062 586 300 200](https://image.slidesharecdn.com/2012hcieng-130228022450-phpapp02/75/2012-hci-_-_eng-7-2048.jpg)


