Magnolia TX 77354 | Real Estate Home Sales ReportKen Brand
Magnolia 77354 Real Estate Home Sales Report - November 2012
Average and Median Sold Prices
Average Price Per Square Foot
Average Days On Market
Months Supply of Inventory
Magnolia TX 77354 | Real Estate Home Sales ReportKen Brand
Magnolia 77354 Real Estate Home Sales Report - November 2012
Average and Median Sold Prices
Average Price Per Square Foot
Average Days On Market
Months Supply of Inventory
Objective Capital Precious Metals, Diamonds and Gemstones Investment Summit
The impact of turbulence in the financial markets on the euro, dollar and gold
20 May 2010
by Marino Pieterse - Goldletter International
Spring 77386 Real Estate Sales REport | November 2012Ken Brand
Spring/77386 Real Estate Homes Sales Report
Average and Median Sold Prices
Average Price Per Square Foot
Average Days On Market
Months Supply of Inventory
Sprint TX Real Estate and Homes Sales Report | December 2013
20111228 pfl biofuelmarketsdaily
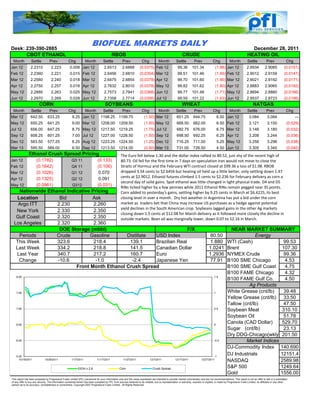
1. Desk: 239-390-2885
BIOFUEL MARKETS DAILY December 28, 2011
CBOT ETHANOL RBOB CRUDE HEATING OIL
Month Settle Prev Chg Month Settle Prev Chg Month Settle Prev Chg Month Settle Prev Chg
Jan 12 2.2310 2.223 0.008 Jan 12 2.6513 2.6888 (0.0375) Feb 12 99.36 101.34 (1.98) Jan 12 2.8934 2.9085 (0.0151)
Feb 12 2.2360 2.221 0.015 Feb 12 2.6456 2.6810 (0.0354) Mar 12 99.51 101.46 (1.95) Feb 12 2.9012 2.9159 (0.0147)
Mar 12 2.2580 2.240 0.018 Mar 12 2.6475 2.6854 (0.0379) Apr 12 99.70 101.60 (1.90) Mar 12 2.9021 2.9192 (0.0171)
Apr 12 2.2750 2.257 0.018 Apr 12 2.7632 2.8010 (0.0378) May 12 99.82 101.62 (1.80) Apr 12 2.8883 2.9065 (0.0182)
May 12 2.2880 2.263 0.025 May 12 2.7573 2.7941 (0.0368) Jun 12 99.77 101.48 (1.71) May 12 2.8694 2.8880 (0.0186)
Jun 12 2.2970 2.269 0.028 Jun 12 2.7358 2.7714 (0.0356) Jul 12 99.59 101.22 (1.63) Jun 12 2.8537 2.8723 (0.0186)
CORN SOYBEANS WHEAT NATGAS
Month Settle Prev Chg Month Settle Prev Chg Month Settle Prev Chg Month Settle Prev Chg
Mar 12 642.50 633.25 9.25 Jan 12 1198.25 1199.75 (1.50) Mar 12 651.25 644.75 6.50 Jan 12 3.084 3.084 ---
May 12 650.25 641.25 9.00 Mar 12 1208.00 1209.50 (1.50) May 12 668.50 662.00 6.50 Feb 12 3.121 3.150 (0.029)
Jul 12 656.00 647.25 8.75 May 12 1217.50 1219.25 (1.75) Jul 12 682.75 676.00 6.75 Mar 12 3.148 3.180 (0.032)
Sep 12 608.25 601.25 7.00 Jul 12 1227.00 1228.50 (1.50) Sep 12 698.50 692.25 6.25 Apr 12 3.208 3.244 (0.036)
Dec 12 583.50 577.25 6.25 Aug 12 1223.25 1224.50 (1.25) Dec 12 716.25 711.00 5.25 May 12 3.258 3.296 (0.038)
Mar 13 595.50 589.00 6.50 Sep 12 1213.50 1214.00 (0.50) Mar 13 731.00 726.50 4.50 Jun 12 3.305 3.345 (0.040)
Ethanol Crush Spread Pricing The Euro fell below 1.30 and the dollar index rallied to 80.52, just shy of the recent high of
Jan 12 (0.1782) Q3 11 (0.133) 80.73. Oil fell for the first time in 7 days on speculation Iran would not move to close the
Feb 12 (0.1642) Q4 11 (0.106) Straits of Hormuz and the February WTI contract closed at $99.36 a loss of $1.98. RBOB
Mar 12 (0.1026) Q1 12 0.070 dropped 3.54 cents to $2.6456 but heating oil held up a little better, only settling down 1.47
Apr 12 (0.1325) Q2 12 0.091 cents at $2.9012. Ethanol futures climbed 1.5 cents to $2.236 for February delivery as corn a
second day of solid gains. Spot ethanol was little changed in light physical trade. D4 and D5
May 12 (0.0961) Q312 (0.031)
RINs ticked higher by a few pennies while 2011 Ethanol RINs remain pegged near 35 points.
Nationwide Ethanol Indicative Pricing Corn added to yesterday's gains, settling higher by 9.25 cents in March at $6.4225, its best
Location Bid Ask closing level in over a month. Dry hot weather in Argentina has put a bid under the corn
Argo ITT 2.230 2.260 market as traders bet that China may increase US purchases as a hedge against potential
yield declines in the South American crop. Soybeans lagged gains in the other Ag markets
New York 2.330 2.350
closing down 1.5 cents at $12.08 for March delivery as it followed more closely the decline in
Gulf Coast 2.320 2.350 outside markets. Bean oil was marginally lower, down 0.07 to 52.16 in March.
Los Angeles 2.320 2.360 f
DOE Storage (mbbl) F/X NEAR MARKET SUMMARY
Periods Crude Gasoline Distillate USD Index 80.50 Energy
This Week 323.6 218.4 139.1 Brazilian Real 1.880 WTI (Cash) 99.53
Last Week 334.2 218.8 141.5 Canadian Dollar 1.0241 Brent 107.30
Last Year 340.7 217.2 160.7 Euro 1.2936 NYMEX Crude 99.36
Change -10.6 -1.0 -2.4 Japanese Yen 77.91 B100 SME Chicago 4.53
Front Month Ethanol Crush Spread B100 SME Gulf Coast 4.75
B100 FAME Chicago 4.32
8.00 1.5
B100 FAME Gulf Co. 4.50
Ag Products
7.50 1 White Grease (cnt/lb) 39.48
Yellow Grease (cnt/lb) 33.50
Tallow (cnt/lb) 47.50
7.00 0.5
Soybean Meal 310.10
Soybean Oil 51.78
6.50 0
Canola (CAD Dollar) 529.70
Sugar (cnt/lb) 23.13
Dry DDG-Chicago(wkly 201.50
6.00 -0.5 Market Indices
DJ-Commodity Index 140.690
5.50 -1
DJ Industrials 12151.4
10/18/2011 10/28/2011 11/7/2011 11/17/2011 11/27/2011 12/7/2011 12/17/2011 12/27/2011
NASDAQ 2589.98
EtOH x 2.8 Corn Crush Spread S&P 500 1249.64
Gold 1556.00
This report has been prepared by Progressive Fuels Limited (PFL) personnel for your information only and the views expressed are intended to provide market commentary and are not recommendations. This report is not an offer to sell or a solicitation
of any offer to buy any security. The information contained herein has been compiled by PFL from sources believed to be reliable, but no representation or warranty, express or implied, is made by Progressive Fuels Limited, its affiliates or any other
person as to its accuracy, completeness or correctness. Copyright 2007 Progressive Fuels Limited. All Rights Reserved.
2. PFL BIOFUEL MARKETS DAILY COMMENTARY December 28, 2011
RBOB/Ethanol/RINs
3.00 0.10
2.90 0.09
2.80 0.08
2.70 0.07
2.60 0.06
2.50 0.05
2.40 0.04
2.30 0.03
2.20 0.02
2.10 0.01
2.00 0.00
18-Oct 7-Nov 27-Nov 17-Dec
RBOB Ethanol 10 E RINs 11 E RINS
Ethanol RIN Pricing (cts/RIN) Biodiesel RIN Pricing (cts/RIN)
Year Type Bid Ask Year Type Bid Ask
2010 D6 0.05 0.10 2010 D4 131.00 135.00
2010 D3 90.00 105.00 2010 D5 60.00 70.00
2011 D6 0.30 0.35 2011 D4 122.00 127.00
2011 D3 113.00 113.00 2011 D5 75.00 80.00
2012 D6 2.00 2.25 2012 D4 147.00 152.00
2012 D3 113.00 113.00 2012 D5 90.00 95.00
D6 = Corn Ethanol RIN D4 = Biodiesel RIN
D3 = Cellulosic Ethanol RIN D5 = Advanced Biodiesel or Renewable Diesel RIN
RBOB CBOT Ethanol RBOB/Etoh Ethanol Swaps Nationwide Etoh Pricing
Month(s) Spread CBOT Location Bid Ask
Jan 12 2.6513 2.2310 (0.4203) Month(s) Bid Ask Atlanta/Doraville 2.350 2.370
Feb 12 2.6456 2.2360 (0.4096) Jan-12 2.230 2.245 Chicago Rule 11 2.200 2.220
Mar 12 2.6475 2.2580 (0.3895) Feb-12 2.250 2.265 Dallas 2.260 2.280
Apr 12 2.7632 2.2750 (0.4882) Q1 12 2.250 2.265 FOB NE BN 2.050 2.070
May 12 2.7573 2.2880 (0.4693) Q2 12 2.290 2.305 FOB NE UP 2.070 2.090
Jun 12 2.7358 2.2970 (0.4388) Q3 12 2.245 2.265 Northern California 2.340 2.360
Jul 12 2.7093 2.3100 (0.3993) Q4 12 2.120 2.140 Pacifc Northwest 2.320 2.350
Soybean Oil/Heating Oil/Biodiesl RINs
2.0000
4.30
4.10
1.8000
3.90
1.6000
3.70
3.50 1.4000
26.85
3.30
1.2000
3.10
1.0000
2.90
2.70 0.8000
18-Oct 28-Oct 7-Nov 17-Nov 27-Nov 7-Dec 17-Dec 27-Dec
BO $/gal HO 10 BD 11 BD
This report has been prepared by Progressive Fuels Limited (PFL) personnel for your information only and the views expressed are intended to provide market commentary and are not recommendations. This report is not an offer to sell or a solicitation of any
offer to buy any security. The information contained herein has been compiled by PFL from sources believed to be reliable, but no representation or warranty, express or implied, is made by Progressive Fuels Limited, its affiliates or any other person as to its
accuracy, completeness or correctness. Copyright 2007 Progressive Fuels Limited. All Rights Reserved.
3. PFL BIOFUEL MARKETS DAILY COMMENTARY December 28, 2011
ETHANOL CHART CORN
R3 2.399 660 R3 676.3
2.800 R2 2.348 650 R2 666.5
2.700 R1 2.300 640
R1 655.6
630
2.600 S1 2.166 620
S1 629.9
2.500 S2 2.125 610 S2 619.0
2.400 S3 2.085 600 S3 609.6
2.300 5DMA 2.194 590
5DMA 626.5
580
2.200
20DMA 2.211 570
20DMA 608.2
2.100
100DMA 2.591 560 100DMA 639.1
2.000 3-Nov 18-Nov 3-Dec 18-Dec
10-Nov 25-Nov 10-Dec 25-Dec
RBOB SOYBEANS
2.8
R3 2.8205 1240
R3 1264.0
2.75
R2 2.7618 R2 1240.4
1220
R1 2.7333 R1 1222.7
2.7
1200
S1 2.5741 S1 1174.8
2.65
S2 2.5250 1180 S2 1158.8
2.6
S3 2.4779 1160 S3 1132.6
2.55
5DMA 2.6463 1140
5DMA 1178.0
2.5
20DMA 2.5974 20DMA 1151.1
1120
2.45 100DMA 2.6831 100DMA 1218.7
1100
2.4
3-Nov 18-Nov 3-Dec 18-Dec
3-Nov 18-Nov 3-Dec 18-Dec
.
CRUDE WHEAT
R3 110.40 665
R3 703.3
102
R2 105.70 655 R2 692.8
R1 102.43 645 R1 678.4
97 S1 96.47 635
S1 626.2
625
S2 93.74 S2 614.4
615
92 S3 90.33 605
S3 752.2
5DMA 99.34 595
5DMA 632.7
87 20DMA 98.14 585 20DMA 609.4
100DMA 94.15 575 100DMA 637.7
82 565
3-Nov 15-Nov 27-Nov 9-Dec 21-Dec 3-Nov 18-Nov 3-Dec 18-Dec
HEATING OIL NATURAL GAS
3.2 R3 3.0602 R3 3.352
3.15 R2 2.9752 3.9 R2 3.246
3.1
R1 2.9300 3.8 R1 3.147
3.05
S1 2.8577 3.7
S1 3.024
3 3.6
2.95
S2 2.8228 S2 2.937
3.5
2.9 S3 2.7517 3.4
S3 2.892
2.85 5DMA 2.8909 3.3 5DMA 3.116
2.8 20DMA 2.9116 3.2 20DMA 3.245
2.75 100DMA 2.9645 3.1 100DMA 3.624
2.7 3
3-Nov 18-Nov 3-Dec 18-Dec 31-Oct 15-Nov 30-Nov 15-Dec
WEATHER
City H/L Windy conditions are expected today in the Northeast and will taper off
Chicago 34/28 this evening. The interior Northeast will see some snow showers that also
slow down into the night. The Midwest also sees a few morning snow
New York 45/26
showers, along with some breezy conditions in the Upper Ohio Valley and
Houston 67/41 central Great Lakes. Some heavy rain, mountain snow and gusty winds are
Los Angeles 74/50 expected today and into tonight in the Pacific Northwest, Northern
California, Northern Rockies and the northern Great Basin. Poor air quality
Washington D.C. 45/27 is a concern in parts of the Central Valley of California, a code red air
St. Louis 45/34 quality in Fresno and code orange air quality in Bakersfield, Sacramento
Naples, Florida 68/56 and others.
This report has been prepared by Progressive Fuels Limited (PFL) personnel for your information only and the views expressed are intended to provide market commentary and are
not recommendations. This report is not an offer to sell or a solicitation of any offer to buy any security. The information contained herein has been compiled by PFL from sources
believed to be reliable, but no representation or warranty, express or implied, is made by Progressive Fuels Limited, its affiliates or any other person as to its accuracy, completeness
or correctness. Copyright 2007 Progressive Fuels Limited. All Rights Reserved.