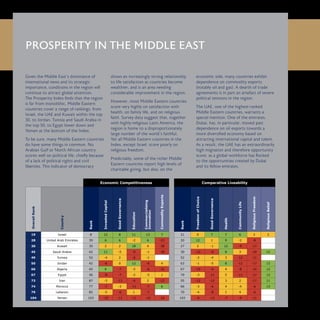
SlideShare a Scribd company logo
1 of 68
THE 2008
LEGATUM
PROSPERITY
INDEX
TM
An Inquiry into Global Wealth and Wellbeing
2	 	 2008 Legatum Prosperity Index
© 2008 Legatum Limited. All rights reserved. This document may not be reproduced or transmitted, in whole or in part, by any means
or in any media, without the prior written permission of Legatum Limited. The Prosperity Index and its underlying methodologies
comprise the exclusive intellectual property of Legatum Limited. “Legatum”, the Legatum logo and “Prosperity Index” are registered
or common law trademarks of Legatum Limited. Whilst every care has been taken in the preparation of the report, no responsibility
can be taken for any error or omission contained herein.
2008 Legatum Prosperity Index	 	 1
Dear Reader,
Welcome to the 2008 Legatum Prosperity
Index. This second edition builds on last
year’s inaugural publication, with
expanded coverage and refined analysis.
The Prosperity Index is an inquiry into the
nature of prosperity and how it is created.
This year, scholars and researchers
affiliated with the Legatum Institute have
significantly expanded the scope of the
Index, investigating prosperity drivers
and outcomes in more than 100 countries
worldwide, increased from only 50 last
year. Africa, particularly, is better
represented with 19 countries featured,
although collecting data for every single
country remains a challenge.
We define prosperity holistically to
include both material wealth and quality
of life. Rather than replicating other
measurements that rank countries by
their actual levels of material wealth or
life satisfaction, the Index produces a
ranking based on the conditions that
foster prosperity – that is, the factors
that promote economic competitiveness
and improved liveability in a given
country. We refer to these factors as
drivers of prosperity and to those that
impede prosperity, as restrainers. The
Index endeavours to rank countries
according to the strength of these drivers
and restrainers, not according to simple
measures of income and life satisfaction.
In this way we hope to contribute to a
richer analysis of what promotes
prosperity globally.
The full details of the Index and its
construction are included in the 2008
Prosperity Index Report, together with
a comprehensive fold-out table of country
rankings inserted at the end of this book.
The Report, which also includes original
research papers on key topics in prosperity
from leading scholars and country profiles
for each of the 104 countries in the Index,
is available in printed form and on the
Legatum Institute website at
www.prosperity.com.
This Summary and Commentary
introduces the findings from the 2008
Index, and provides our interpretation
of the results. It describes the personal
and policy choices that can increase the
prosperity of individuals and nations
around the globe.
The conclusions we draw in this
commentary are based on data research
as well as theory, experience, and the
lessons of history. While we draw on
statistical analysis to support these
findings and views, quantitative analysis is
limited in its ability to separate the drivers
of prosperity from their outcomes, and to
disentangle the interactions between
related drivers. Simply put, there are
limits to what science can tell us about
the causes of the prosperity of nations
(for a discussion of some of these issues,
see the full Prosperity Index Report,
available on request).
Yet while there are limits to our
knowledge, there is still much that we
have learned and can learn. While
governments by themselves cannot create
or mandate prosperity, they can help
create an environment that is conducive
to entrepreneurship and productive
endeavour. Ultimately, it is citizens and
their leaders who must choose to take
ownership of the solutions that will drive
their nation’s long-term prosperity, and
their personal happiness.
We very much hope that you find the
2008 Legatum Prosperity Index of
interest, and this commentary engaging
and thought-provoking. For Legatum, the
quest to understand prosperity is a
long-term investigation that we will seek
to improve with every edition. We would
welcome any comments or feedback that
may help improve our understanding.
Yours sincerely,
PREFACE
Dr. William Inboden
Senior Vice-President
Legatum Institute
Alan McCormick
Managing Director
Legatum
www.li.com
2	 	 2008 Legatum Prosperity Index
PREFACE	 1
EXECUTIVE SUMMARY	 6
AN INTRODUCTION TO THE LEGATUM PROSPERITY INDEX	 16
THE 2008 COUNTRY STANDINGS	 24
PRINCIPLES OF PROSPERITY	 30
THE INVESTIGATION CONTINUES	 56
GLOSSARY OF KEY TERMS	 60
ACADEMIC ADVISORY PANEL	 63
LEGATUM PROSPERITY INDEX TABLE	 65
TABLE OF CONTENTS
2008 Legatum Prosperity Index	 	 3
4	 	 2008 Legatum Prosperity Index
Mission Statement
The purpose of the Prosperity Index is to encourage policymakers, scholars, the media, and the interested
public to take a holistic view of prosperity and understand how it is created. Holistic prosperity extends
beyond just material wealth, and includes factors such as social capital, health, equality of opportunity,
the environment, effective governance, human rights and liberties, and overall quality of life.
2008 Legatum Prosperity Index	 	 5
“...Gross National Product counts air pollution and
cigarette advertising, and ambulances to clear our
highways of carnage…It counts the destruction of
the redwood and the loss of our natural wonder
in chaotic sprawl…Yet the Gross National Product
does not allow for the health of our children, the
quality of their education or the joy of their play.
It does not include the beauty of our poetry or
the strength of our marriages, the intelligence
of our public debate or the integrity of our public
officials…it measures everything, in short, except
that which makes life worthwhile.”
Senator Robert Kennedy
6	 	 2008 Legatum Prosperity Index
In a world in which many people are becoming richer, are we also
getting happier, healthier, and more fulfilled? What does it mean to
become more prosperous, and how does it happen? The Legatum
EXECUTIVE
SUMMARY
2008 Legatum Prosperity Index	 	 7
Prosperity Index endeavours to suggest answers to these questions
and to encourage public discussion about these issues.
8	 	 2008 Legatum Prosperity Index
Executive Summary
The Prosperity Index is unique in three ways.
First, it takes a holistic view of prosperity,
encompassing both material wealth and life
satisfaction. Second, it assesses the drivers and
causes of prosperity, rather than measuring
outcomes. Third, it includes factors that relate
to government policy and to individual citizens.
Constructing the Index
The 2008 Legatum Prosperity Index is the result•	
of an investigation into the various factors that
promote prosperity in nations. Recent research
advances have made it possible to compare not
only the material wealth but also the life
satisfaction of people in countries worldwide.
Accordingly, we have defined national prosperity
as the holistic combination of both of these
factors.
The overall Index scores and rankings are based•	
on a weighted combination of indicators that
reflect Economic Competitiveness and
Comparative Liveability. That is to say, the Index
does not rank countries according to which have
the most material wealth or the highest levels of
happiness at a given time. Rather, it is an index
of drivers, which means that countries are
ranked by how well they are doing at fostering
economic growth and improved quality of life.
In other words, how well are nations promoting
the practices, habits, policies, and institutions
that create enduring prosperity?
The indicators that comprise the Index were•	
identified and weighted based on statistical
analysis, using 40 years of historical data on
economic growth in more than 50 countries,
and life satisfaction survey data for more than
100 countries.
The Index combines 22 key indicators and 44•	
sub-indicators in order to rank more than 100
countries, based on the degree to which the
actions of their people and governments drive
or restrain the creation of holistic national
prosperity, relative to the prosperity of other
countries.
The Index is presented in a set of publications.•	
This book summarises the Index results
and provides our interpretation of the meaning
of the findings. Separately, the Prosperity Index
Report describes the methodology and
indicators in detail, profiles each of the countries
covered in the Index, and presents research
and policy papers on key topics in prosperity.
For readers interested in more background or
in conducting their own investigations, the
Technical Appendix in the Report describes the
research methodology in detail. All these
publications, together with an extensive set of
interactive data analysis tools, are available at
www.prosperity.com.
2008 Legatum Prosperity Index	 	 9
EXECUTIVE SUMMARY
Key Findings
The key drivers of economic competitiveness
vary according to a country’s level of
development. For poorer countries (those
with average incomes of less than $10,000
per capita), where increasing material wealth
is a particular priority, the most important
components of economic competitiveness
include:
Government Effectiveness•	
Levels of Education•	
Growth in Invested Capital•	
Low Costs of Starting a Business•	
Commercialisation of Innovation•	
Low Dependence on Foreign Aid•	
Low Dependence on Commodity Exports•	
Economic Openness•	
For richer countries (those with incomes
greater than $20,000 per capita) that wish
to experience continued economic growth,
the most important components of
competitiveness include:
Invested Capital•	
Education•	
Entrepreneurship•	
Commercialisation of Innovation•	
The key factors for promoting life satisfaction
also vary according to a country’s level of
development. In richer countries, where
moving beyond material wealth to broader
wellbeing is an important goal, the most
important components of liveability include:
Continued High Levels of Income•	
Good Health•	
Political Rights and Civil Liberties•	
Freedom of Choice•	
Charitable Giving•	
Family Life•	
Equality of Opportunity•	
Pleasant Natural Environment•	
Community Life•	
Religious Freedom•	
Many poor countries have surprisingly high
levels of wellbeing, because traditional social
strengths can compensate, at least somewhat,
for low average standards of living. In poor
countries, the most important components of
comparative liveability include:
Family Life•	
A Warm Climate•	
Religious Faith•
Holistic Prosperity Performance
Material Wealth
Performance
Life Satisfaction
Performance
Country
Performance
Rank
Legatum
Prosperity
IndexRank
Rank
Incomeper
Person
Rank
Survey
Average
(1-10)
Denmark 1 9 6 $31,422 1 7.9
Switzerland 2 7 5 $32,775 3 7.5
Norway 3 14 2 $37,667 8 7.4
United States 3 4 1 $38,165 9 7.4
Netherlands 5 11 7 $31,306 4 7.4
Finland 6 2 10 $30,420 2 7.7
Ireland 7 20 3 $36,238 13 7.2
Sweden 8 12 11 $30,392 6 7.4
Australia 9 1 9 $30,678 10 7.3
Canada 9 14 12 $30,278 7 7.4
Austria 11 2 8 $30,736 16 7.1
Belgium 12 14 14 $30,004 12 7.3
New Zealand 13 9 23 $23,109 5 7.4
United Kingdom 14 14 13 $30,237 18 6.9
France 15 14 15 $28,877 20 6.8
Spain 16 22 21 $24,681 15 7.1
Singapore 17 4 16 $28,305 23 6.6
Israel 18 19 25 $22,662 17 7.0
Italy 18 25 20 $26,496 22 6.7
Germany 20 4 18 $27,438 25 6.5
United Arab Emirates 21 28 24 $22,698 21 6.7
Japan 22 13 17 $27,992 30 6.4
Saudi Arabia 23 45 34 $14,769 14 7.2
Taiwan 24 21 19 $26,826 34 6.2
Czech Republic 25 23 29 $19,700 28 6.5
Greece 25 34 26 $21,675 31 6.3
Hong Kong 25 8 4 $32,901 53 5.5
Costa Rica 28 38 47 $9,646 11 7.3
Kuwait 29 30 22 $23,416 37 6.0
Argentina 30 31 37 $13,652 32 6.2
Mexico 30 43 45 $9,967 24 6.5
The Prosperity Index is an index of drivers.
That is, it assesses which countries’ leaders
and citizens are doing the most to actively
foster or promote holistic national
prosperity.
But what about outcomes? Which
countries actually achieve the greatest
prosperity performance – that is, the
highest incomes and highest levels of life
satisfaction? And to what extent do high
Prosperity Index scores correlate with
these actual prosperity outcomes?
As one might expect, because the factors
in the Index are based on analysis of
historical data, the link between drivers
and outcomes is strong. In statistical
terms, the correlation is higher than 0.85
both between countries’ ranks on the
Competitiveness Index and their actual
per capita incomes, and between their
ranks on the Liveability Index and actual
average national life satisfaction survey
results in the Gallup World Poll.
There are a few countries in which
performance differs notably from what
the Prosperity Index predicts. Singapore,
Germany, Hong Kong, Norway and Ireland
are the countries in the top ranks of the
Prosperity Index where significant
differences appear. Most of these
differences are on the material wealth
side.
Based on their Prosperity Index scores,
we would expect Germany, Singapore and
Ireland to be even wealthier than they are.
In Germany’s case this may reflect the
long slowdown that followed reunification,
while in Singapore and Ireland it may
reflect a late start in growth.
Norway, by contrast, is predicted by the
Index to be less wealthy than it actually is.
In the Index, Norway scores poorly on
entrepreneurship and some innovation
indicators. Yet these areas of apparent
weakness do not appear to have reduced
the country’s economic performance,
which is among the world’s best. This
owes in part to Norway’s proven ability
to mitigate natural resource dependence
by responsibly investing its oil revenues in
ways that foster growth and impressive
levels of wellbeing.
But perhaps the most surprising case is
Hong Kong. Despite extremely high levels
of development, and generally good
quality of life indicators, Hong Kong
registers very low life satisfaction results
that are difficult to explain.
The top 30 countries, ranked by holistic
prosperity performance (taking the
average of the ranking on income and life
satisfaction) are shown below. The full
details of countries’ performance are
available at www.prosperity.com.
PROSPERITY PERFORMANCE: HOW DO
DRIVERS COMPARE WITH OUTCOMES?
2008 Legatum Prosperity Index	 	 11
EXECUTIVE SUMMARY
Many Asian countries score very well on the wealth
indicators, but have weaknesses in wellbeing, including
limited equality of opportunity for women, a degraded
natural environment, and long working hours.
The Rankings
The top spot in the Index is claimed by•	
Australia, followed by Austria and Finland in
a tie for second place. These are followed
closely by Germany, Singapore, and the
United States, also in a tie. While there are
limits to what statistical analysis can tell us
about the relative importance of indicators
that are often highly interrelated, each of
these countries registers high scores on
nearly every indicator and outstanding
scores on a few indicators.
Australia makes a particular virtue of•	
entrepreneurship as a source of material
wealth, as well as pursuing broader societal
wellbeing through high levels of volunteering
and charitable giving. Austria turns in top
scores in education, a key to long-term
income growth, and also in health, a key to
quality of life. Finland boasts superb
governance, helping to drive both wealth
and wellbeing in that country.
This group of countries tops the Index•	
because of imbalanced results from other
regions. Many Asian countries score very
well on the economic competitiveness
indicators, but have comparative weaknesses
in liveability, including limited equality of
opportunity for women, a degraded natural
environment, and long working hours.
In contrast, most Nordic countries score
very well on liveability indicators, but poorly
on some wealth drivers, most notably
entrepreneurship.
While no country has poor scores in every•	
category, Yemen comes closest. While its
people maintain a strong religious faith, they
also suffer from extreme levels of poverty
and poor governance. For most of the
countries in the bottom ranks of the Index,
extreme poverty appears to be the main
cause. This usually has further wellbeing
impacts by contributing to ill health and
unemployment. A number of countries,
such as Zimbabwe and Sudan, are both
impoverished and politically repressive.
12	 	 2008 Legatum Prosperity Index
PRINCIPLES OF PROSPERITY
The results of the 2008 Prosperity Index research highlight a number of general
principles relevant to the promotion of national prosperity. These include:
Freedom of choice is crucial.1.	 Whether people
have freedom of choice and control over how
they direct their lives and spend their time
and resources is a strong determinant of life
satisfaction and productivity.
Government should be effective, honest and2.	
limited. Governments that exercise power
responsibly and are accountable to their citizens
dominate the top quartile of the rankings for
both competitiveness and liveability.
For poorer countries, raising incomes is a top3.	
priority. For countries with an income per
person of less than US $10,000 on average,
income levels are the single strongest predictor
of how happy that country’s people will be.
For richer countries, wellbeing means more than4.	
just money. For most people in rich countries,
non-material drivers tend to have a bigger
impact on their life satisfaction than increases
in income.
2008 Legatum Prosperity Index	 	 13
EXECUTIVE SUMMARY
Entrepreneurship is a promising path to material5.	
wealth. Entrepreneurship indicators show a
significant statistical relationship with long-term
economic growth in both rich and poor countries.
Growth in invested capital is crucial to long-term6.	
economic growth. Investment by the private
sector (e.g. in factories, offices and production
machinery) is one of the most important drivers
of material wealth, for both rich and poor
countries.
Economic openness can help poorer countries7.	
catch up faster. Open economies in which foreign
direct investment and international trade play
larger roles have higher long-term growth rates.
Economic openness enables countries to absorb
foreign capital, technologies, skills and business
techniques. However, poor countries that depend
heavily on commodity exports, such as oil and
gas, often have lower long-term growth rates.
Economic openness
enables countries to
absorb foreign capital,
technologies, skills and
business techniques.
Climate and the environment impact our8.	
happiness. Several indicators of climate and the
environment, including temperature extremes,
land area devoted to nature, and perceived air
quality, show a significant relationship with
average national life satisfaction.
Develop your gift and then give it away.9.	
Countries where charitable giving and
volunteering are common report higher
average levels of wellbeing.
Geography is not destiny.10.	 Advances in medical
science and productive technology are now
available worldwide. The top 30 countries in the
Prosperity Index include not only countries from
Western Europe and North America but also
Asia, Eastern Europe, and the Middle East.
Governments and citizens each have a role in11.	
building the prosperity of nations. The 2008
Prosperity Index includes factors driven by
individual choice (such as volunteering and
charitable giving), factors driven by the choices
of policymakers (such as economic openness
and good governance), and factors influenced
by both, such as health.
A FASCINATION WITH HAPPINESS
While the pursuit of happiness has long
been of interest to individuals, in recent
years it has become a priority for many
political leaders worldwide. The UK
government appointed Lord Richard
Layard, an academic at the London School
of Economics, as “happiness tsar”, with
responsibility for advising on policies to
improve wellbeing in Britain. The
President of India, Pratibha Patil,
announced the creation of a Prosperity
Index specifically for her country,
measuring quality of life. And French
President Nicolas Sarkozy announced
that a panel of eminent scholars, led by
Nobel Laureates Joseph Stiglitz and
Amartya Sen, would develop new
economic indicators that would assess
wellbeing in France.
Why this sudden interest in happiness
from some very serious-minded people?
Happiness itself has been an aspiration
from the advent of humanity and it has
been studied for some time. What is
new is the “science of happiness” – new
methodologies taking advantage of brain
scans and large-scale survey research to
assess human wellbeing with quantitative
methods. As a result, the study of
happiness is now not only of interest to
philosophers and psychologists but also
to economists and political scientists.
The field now attracts attention from
well-known scholars including Robert
Putnam of Harvard and Nobel Laureate
Daniel Kahneman of Princeton.
And thus, in the past few years, wellbeing
research has entered the mainstream.
The New York Times reported on new
data linking income and happiness, and
The Independent on the unhappiness of
Great Britain. The Wall Street Journal
carried stories on Bhutan’s happiness
policies, the Canberra Times on wellbeing
in Australia, and the Los Angeles Times
on declining quality of life in the US.
Newspapers in countries from Singapore
and India to the UK and Canada covered
the release of the 2007 Legatum
Prosperity Index. In short, it appears our
fascination with happiness will not abate
any time soon.
References to “Happiness” over the years
The graph below, also produced by Google Trends, shows the volume of book and news references to specific years in conjunction with
the term “happiness”. Aside from the current boom, spikes occur in 1776, when the US Declaration of Independence asserted the “pursuit
of happiness” as an inalienable right, and in 1238, the date of the founding of the Sukhothai (“Dawn of Happiness”) kingdom in Thailand.
Volume of searches for “Happiness” on Google
The graph below, produced by Google Trends, shows the near-doubling in search
volume for the term “happiness” over the past four years. The temporary spike in late
2006 anticipates the January 2007 release of the movie, “The Pursuit of Happyness”,
starring Will Smith.
0
0.5
1
1.5
2
2.5
Jan42004
Apr252004
Aug152004
Dec52004
Mar272005
Jul172005
Nov62005
Feb262006
Jun182006
Oct82006
Jan282007
May202007
Sep92007
Dec302007
Apr202008
Years
Volume
16	 	 2008 Legatum Prosperity Index
In 2008, there remains a great divergence among nations in both the
material wealth and life satisfaction of their citizens. The people of the
Netherlands earn US $30,000 per year on average, almost 30 times
more than citizens of Nigeria who survive on only US $1,100.
AN
INTRODUCTION
TOTHE
LEGATUM
PROSPERITY
INDEX
2008 Legatum Prosperity Index	 	 17
The citizens of Costa Rica report themselves very satisfied with
their lives, while those of Zimbabwe, on average, report themselves
very dissatisfied.
In 2008, new research resulted in the
addition of several new indicators to the
Index. A few of these are highlighted
below. Each of these indicators, as with all
those in the Index, shows a statistical link
with either long-term economic growth
or average levels of life satisfaction. For
the full list, visit www.prosperity.com.
The Number of Regional Trade
Agreements Signed shows a strong link
with economic growth, particularly in
poor countries. While some observers
dispute the impact of these agreements
on global trade flows, for individual
countries, this indicator may reflect a
government’s level of interest and
effectiveness in pursuing outward-
oriented economic development.
The Business Ownership Rate shows a
strong link to income growth, particularly
in rich countries, and is an indicator of
entrepreneurship (see Principle of
Prosperity 4, page 37).
Researchers in R&D per Capita assesses
a country’s capacity to innovate in a
business context, as well as reflecting the
general quality of higher education and
human capital in the workforce.
“Can people who work hard get ahead in
this country?” is a question on the Gallup
World Poll. While answers to this
question doubtless reflect individual
beliefs, on a national-average basis this
indicator seems to reflect the degree to
which opportunities for advancement are
widely available in society according to
individual merit and initiative, rather than
being confined to a privileged elite.
Net Migration measures the degree to
which people leave a country, fleeing poor
conditions or in search of opportunity
elsewhere. Data suggest that individuals
tend to emigrate from countries where
incomes, levels of life satisfaction, or life
expectancies are low, and to countries
where incomes are high.
Ecosystem Services per Capita is an
innovative measure of the value of nature
in a country, such as lakes, rivers,
wetlands, forests and grasslands. Based on
satellite photographs, scientists are able
to measure the proportion of a country’s
land area remaining in a natural state
(see Principle of Prosperity 8, page 47).
Charitable Giving and Volunteering are
both assessed by the Gallup World Poll,
and show a strong statistical relationship
with life satisfaction (see Principle of
Prosperity 9, page 49).
NEW FACTORS IN THE 2008 PROSPERITY
INDEX
2008 Legatum Prosperity Index	 	 19
AN INTRODUCTION TO THE LEGATUM PROSPERITY INDEX
traditionally measured. At the same time, they
pursue broader wellbeing, in areas such as
health, leisure time, family life, the environment
and social capital (for a comparison of drivers
and performance, see the callout, Prosperity
Performance on page 10).
The Index is produced using a quantitative•	
approach. The Index includes only factors for
which a statistical link with material wealth or
life satisfaction can be shown.
The Index is produced in the spirit of “progress•	
not perfection”. Our understanding of the
drivers of prosperity increases each year, as new
data and techniques become available. This
Index reflects this progress, and in years to
come it will continue to change to reflect
advances in knowledge.
The 2008 Index also improves on last year’s
Index in a number of ways. Hence, readers of this
Summary and Commentary will find there is much
that is new.
Citizens of the top
countries pursue broader
wellbeing, in areas such as
health, leisure time, family
life, the environment
and social capital.
In 2007, the Legatum Institute published the
first results of an investigation into the drivers
and restrainers of prosperity in nations, in a
report and website accompanying the 2007
Prosperity Index. This year, the Institute has
sponsored further research, leading to new
lines of inquiry and new findings.
The guiding principles of the 2008 Prosperity
Index remain unchanged from the previous
edition:
The Index takes a holistic view of prosperity.•	
This means a view that extends beyond just
material wealth, and includes other factors
such as social capital, health, the environment,
political liberty, and overall quality of life.
Operationally, holistic prosperity is defined•	
as the combination of two widely-available
statistical measures: material wealth, measured
by long-term growth in average income per
person, and life satisfaction, measured by
average levels of life satisfaction as reported on
national surveys (see the callout, A Fascination
with Happiness on page 14).
The Index is an index of drivers, not results.•	
The top countries in the Index are not
necessarily those that achieve the highest
outcomes in material wealth and life
satisfaction. Rather, the top countries are
those that have, relative to their peers, the
most factors that promote wealth and
wellbeing. This is why countries are ranked
based on a weighted average of indicators of
Economic Competitiveness (drivers of
differences between countries’ relative levels
of material wealth) and Comparative Liveability
(drivers of differences between countries’
relative levels of life satisfaction). Citizens of
the top countries in the Index pursue wealth,
the yardstick by which prosperity has been
What are the reasons for disparities between countries? How can these 	
disparities be remedied? And how can countries that have achieved high levels 	
of material wealth today broaden their success to include a good quality of life?
The Legatum Institute was active in
promoting new research into prosperity
in 2008. The Institute sponsored research
by Harvard University’s Robert Putnam on
religion and wellbeing, research by Ruut
Veenhoven of Erasmus University in the
Netherlands on freedom and wellbeing,
and an interdisciplinary academic
symposium on topics in prosperity in
which more than 20 leading scholars
participated.
The Institute also commissioned three
research and policy papers on key issues
in prosperity, the full text of which is
available in the 2008 Prosperity Index
Report, as well as online at
www.prosperity.com.
“Entrepreneurship and Economic
Growth”, by David Audretsch
Audretsch, the Director of the Max Planck
Institute of Economics in Jena, Germany,
and the Ameritech Chair of Economic
Development at Indiana University, offers
new thinking on the link between
entrepreneurship and economic growth.
He explains why policymakers lost interest
in entrepreneurship during the postwar
period and argues that entrepreneurship
is now central to economic progress.
“Entrepreneurship provides an important
mechanism that actually transforms
investments in knowledge, ideas and
creativity, into innovative activity”,
he writes.
“Happiness and Charity”, by Arthur Brooks
Arthur Brooks is the Louis A. Bantle
Professor of Business and Government
Policy at Syracuse University and the
author of a new book, Gross National
Happiness: Why Happiness Matters for
America – and How We Can Get More of
It. He offers an engaging survey of new
research – including his own – that links
charitable giving and life satisfaction. He
contends that “the evidence is clear that
gifts of money – as well as gifts of time –
to charitable organisations, houses of
worship, and other worthy causes, bring
authentic happiness to givers”.
“The Role of Freedom and Control in
Explaining Happiness”, by Paolo Verme
Paolo Verme is a professional development
economist and is a contract Professor of
Economics at the University of Turin and
at Bocconi University in Milan. He analyses
the World Values Survey data in detail,
finding a surprisingly robust link between
freedom of choice and wellbeing in more
than 80 countries worldwide. He suggests
a theoretical explanation for this link and
speculates on possible policy implications.
“Public policies which focus on other
institutional aspects such as marriage,
religion or political orientation may not be
so powerful in delivering happiness as they
may have negative effects on freedom and
control and, through this variable, reduce
the positive effect that these factors have
on happiness”, he suggests.
SUPPORTING NEW RESEARCH: EXPANDING
OUR UNDERSTANDING OF PROSPERITY
2008 Legatum Prosperity Index	 	 21
AN INTRODUCTION TO THE LEGATUM PROSPERITY INDEX
Based on new statistical research, the Index•	
uses a much wider range of indicators.
This year the Index employs 16 drivers that
show a strong statistical relationship with
differences in countries’ relative levels of
material wealth (indicators of Competitiveness),
and 28 drivers that show a strong statistical
relationship with differences in countries’
relative levels of life satisfaction (indicators of
Liveability). For a description of some of the
new indicators in the Index, see the callout,
New Factors on page 18.
The Index includes a new weighting•	
methodology, which assesses how the drivers
of prosperity change as countries become
wealthier (see the callout, What Explains
Differences in National Prosperity? on page 22).
We encourage readers with an interest in this
area to review the research for themselves, in
the full Index Report available to download at
www.prosperity.com, and to take advantage of
the extensive online tools for analysis available
on the website.
In what follows, we provide our own
interpretation of the Index research and results.
In the study of prosperity, many findings remain
contested and imprecise. But in the lives of
people and the policies of nations, decisions must
be made on imperfect information. This book
presents our views on the 2008 Prosperity Index
results and the individual and policy choices that
can best promote global prosperity.
In addition to this commentary, the Legatum•	
Institute has published a full report on the
research that produced the Index, covering
methodology, related academic literature,
results and data sources, and full country
profiles for the 104 countries in the Index.
The full report also includes three research
papers by leading scholars on key topics in
prosperity: on entrepreneurship by David
Audretsch, on charitable giving by Arthur
Brooks, and on freedom of choice by Paolo
Verme (see the callout, Supporting New
Research on page 20).
Drawing on the Gallup World Poll and other•	
new data, the country coverage of the Index
has been expanded from 50 countries in 2007
to 104 in 2008.
We encourage readers with an interest in this area to review
the research for themselves in the full Prosperity Index Report
available for download at www.prosperity.com.
We assigned weights to the various
components of the Index based on the
degree to which each component explains
why some countries are more prosperous
than others. To produce this analysis, we
used 40 years of data on economic
growth, and data on average life
satisfaction for more than 100 countries.
We also assessed the ways in which the
strength of the relationship between each
Index component and national prosperity
varies as countries become wealthier. For
instance, in poorer countries, basic factors
such as governance and foreign aid
dependence appear to have a large impact
on income growth, whereas in richer
countries, high-tech innovation and
entrepreneurship unsurprisingly play
a much larger role.
There are limitations to what statistical
analysis can tell us about the drivers of
prosperity. In particular, this type of
statistical analysis can identify
relationships, but cannot determine
whether these relationships are causal.
The Prosperity Index presents the results
of an investigation into the drivers of
prosperity, not a precise measurement of
these drivers (for more details, see the full
Prosperity Index Report).
It is important to note that foundational
social capital factors such as family,
friends, faith, and health, all of which are
strong determinants of human happiness,
are generated and experienced by
individuals, not entire countries. In other
words, it is individual people who are
WHAT EXPLAINS DIFFERENCES	
IN NATIONAL PROSPERITY?
Commercialising Innovation
Entrepreneurship
Dependence
Economic Openness
1
2
3
4
5
6
7
8
9
10
11
12
13
14
15
16
17
18
19
20
21
22
23
24
25
26
27
28
29
30
31
32
33
34
35
36
37
38
0
Income
(USD equivalence in thousands)
0%
20%
40%
60%
80%
100%
Better Education
Competitive Markets
Good Governance
Invested Capital
ImportanceforMaterialWealth
Economic Competitiveness Weights
The graph below shows the relative weights of the factors in the Economic
Competitiveness Index and how these weights change as countries become wealthier.
The width of each bar indicates the factor’s weight, as a percentage of a total
Index score. Generally, the weights do not change significantly. That is to say, the
fundamental drivers of differences in long-term economic growth rates amongst rich
countries are similar to those of poor countries. Two notable exceptions are governance
and dependence on commodity exports, which are problems for poor countries but not
rich countries. By contrast, the importance of innovation rises markedly as countries
become wealthier.
happy, not nations. However, since the
Prosperity Index assesses prosperity at the
national level, it uses national averages of
these social capital indicators. While these
national averages can reveal interesting
comparisons between countries, they do
not address the relative salience of social
capital factors within countries. Substantial
research has demonstrated that for
populations within wealthier nations,
factors such as family life, friendship,
religious engagement, and health are much
stronger determinants of individual
happiness than income. For an analysis of
how each of these factors may impact your
individual life satisfaction, visit the Personal
Prosperiscope at www.myprosperity.com.
100%
80%
60%
40%
20%
0%
4.0
5.3
6.6
7.9
9.2
10.5
11.8
13.1
14.4
15.7
17.0
18.3
19.6
20.9
22.2
23.5
24.8
26.1
27.4
28.7
30.0
31.3
32.6
33.9
35.2
36.5
37.8
39.1
40.4
41.7
43.0
44.3
45.6
46.9
48.2
49.5
50.8
53.4
54.7
52.1
Income
(USD equivalence in thousands)
ImportanceforLifeSatisfaction
Equality Of Opportunity
Climate
Leisure
HealthFamily Life
Community Life
Religious Life
Environment
Income
Income (int'l USD)
0%
20%
40%
60%
80%
100%
Governance
Freedom Of Choice
Comparative Liveability Weights
The graph below shows the weights of the factors in the Comparative Liveability
Index and how these weights, based on national averages, change as countries become
wealthier. Unlike the Economic Competitiveness Index, these weights do shift a great deal.
Most notably, the weight on income (shown in the small graph, but removed in the large
graph) falls dramatically as countries become wealthier, from more than 60% of
the total Index weight to less than 20%. At the same time, relative weights on health
and especially governance rise significantly. In poor countries, the impact of poverty tends
to overwhelm all other drivers of life satisfaction; in rich countries, non-material factors are
more important than money (see Principles of Prosperity 4 and 5).
Legatum Brochure DPP.indd Sec1:23Legatum Brochure DPP.indd Sec1:23 10/7/08 3:15:31 PM10/7/08 3:15:31 PM
24	 	 2008 Legatum Prosperity Index
2008
COUNTRY
STANDINGS
Rather than replicating other measurements that rank countries by
their actual levels of material wealth or life satisfaction, the Index
produces a ranking based on the conditions that foster prosperity.
2008 Legatum Prosperity Index	 	 25
26	 	 2008 Legatum Prosperity Index
The Leaders in Promoting
Prosperity
The top spot in the 2008 Index is claimed by
Australia, followed by Austria and Finland in a
tie for second place. These countries are followed
closely by Germany, Singapore, and the United
States, also in a tie. While there are limits to
what a purely quantitative analysis can tell us,
as of 2008, these countries appear to have the
strongest attributes that promote the holistic
prosperity of their citizens.
What do the successes of Australia, Austria and
Finland suggest? Each nation has a well-rounded
set of attributes, scoring well in a very broad
range of drivers of prosperity, and outstandingly
in a few. Australia makes a particular virtue of
entrepreneurship as an engine of economic
competitiveness, as well as pursuing broader
societal wellbeing as an effective democracy with
high levels of citizen volunteering and charitable
giving. Austria turns in top scores in education,
a key to long-term income growth, and also in
health, a key to a country’s liveability. Finland
boasts excellent governance, helping to drive both
wealth and wellbeing in that country. In addition,
the Finns report the greatest satisfaction with
their freedom to choose the course of their own
lives of any country in the Index.
Interestingly, a diverse group of countries – three
in Europe, two in Asia, and one in North America
– take up the top six spots in the Index, in part
because of imbalanced performances by the
leading countries in other regions. Several Nordic
countries do very well in liveability, but less well
in competitiveness. Several Asian countries, on
the other hand, have achieved tremendous leaps
in income, but do less well in promoting the
wellbeing of their citizens.
Unbalanced Performers
In general, the Nordic countries (Denmark,
Sweden and Norway) achieve top scores in the
drivers of life satisfaction (and indeed, Denmark
currently rates as the “world’s happiest country”
– see the callout, Prosperity Performance on
page 10). These Nordic countries are rich, highly
democratic, scrupulously incorrupt, extremely
healthy, enjoy vibrant community life, and their
citizens have great personal and political freedom
to make choices in determining the course of
their own lives. No other region can match the
Nordic performance in all of these indicators of
liveability.
However, at the same time, the Nordic countries
lack economic vibrancy. They therefore score
relatively poorly on our Index of Economic
Competitiveness. The Nordics are capital-rich –
particularly Norway, enjoying a boom in oil wealth
– and have excellent standards of education. But
the Nordic countries score relatively poorly on
indicators of innovation, competition in domestic
markets, and particularly, on entrepreneurship.
Relatively few citizens in these countries choose
to go into business for themselves. This lack of
entrepreneurial flair suggests the Nordic countries
may not be taking full advantage of their citizens’
individual potential, and may also warn of
potential constraints on future growth (see the
callout, Supporting New Research on page 20).
Some Asian countries fall into the opposite
category. The Asian leaders (Singapore, Hong
Kong, Taiwan, and Japan) take top positions in
our Index of Economic Competitiveness. These
countries and territories have achieved the fastest
income growth of perhaps any on earth, surging
from poverty to material prosperity in a single
generation. They boast excellent mass education,
highly effective and market-oriented regulation,
a focus on income growth rather than a
THE 2008 COUNTRY STANDINGS
2008 Legatum Prosperity Index	 	 27
THE 2008 COUNTRY STANDINGS
dependence on foreign aid, and an ability to
engage effectively with the global economy.
They particularly excel at taking advantage of
the market demand and advanced technologies
on offer from the world’s consumers and
businesses (although the Asian economies have
been most successful at commercialising foreign
technologies, and show some weaknesses in
generating their own technological innovation).
At the same time, while few countries can equal
Asia’s long-term economic growth rates, most
Asian countries show weaknesses in liveability.
Most notable is equality of opportunity. The
Gallup World Poll finds that relatively few people
in Hong Kong, Singapore, or South Korea report
that they agree with the statement that “in this
country, people who work hard can get ahead”.
This is all the more remarkable considering the
high economic growth rates in these countries.
Perhaps, however, it is not so remarkable when
one considers the level of exclusion of women
from leading positions in the economy and
politics in Asia. Other weaknesses in liveability
common to many countries in Asia include a
degraded natural environment and extremely
long working hours. Having achieved rapid
advances in material wealth, citizens of the
leading Asian economies may wish to focus on
the drivers of wellbeing.
DOWN UNDER IS ON TOP
Australia earns the top position in the
2008 Legatum Prosperity Index. The
‘Lucky Country’ has reinvented itself as
a wealthy service-oriented economy, and
earns its top spot by combining economic
competitiveness with good scores on
liveability indicators, including health,
charitable giving, and effective
governance.
High levels of capital investment and
innovation are key to Australia’s success
in terms of material wealth. No doubt
this can be partially attributed to policies
pursued from the 1970s to the 1990s that
deregulated labour and financial markets,
controlled public spending and privatised
state industries. Australia’s extremely high
score on regulatory quality, a component
of the World Bank Governance Indicators
that measures market-oriented
policymaking, reflects this history.
Perhaps as a partial consequence of
Australia’s wealth, levels of charitable
giving in the country are extremely
high, according to the Gallup World
Poll. This boosts Australia’s liveability
score considerably. Although Australia’s
indigenous population lives with the
adverse effects of socio-economic
disparities, the country enjoys good
community life scores overall, bolstered
by strong norms of civic participation.
Australians have one of the highest sport
participation rates in the world, and
leisure time of over seven hours a day
on average, according to Gallup.
But leisure time, environmental
satisfaction, land area devoted to nature,
and air quality – Australia scores well on
all of these – are just the icing on the
cake. Australia earns its high Index score
by getting the fundamentals right.
Australians enjoy robust good health,
with an average health-adjusted life
expectancy of 72.6 years, and the
Australian government earns high
scores on corruption control and overall
effectiveness, supporting the country’s
quality of life in many areas.
Country profiles are available for all
104 countries in the Prosperity Index
at www.prosperity.com.
Indicator Score in the Prosperity Index
Key score drivers for comparative liveability. The graph below shows the liveability
factors with the greatest influence on Australia’s score, after the Prosperity Index
weighting scheme has been applied.
Control of corruption
Charitable giving
Government effectiveness
Healthy life expectancy
Income
Research in R&D
Patents
Quality of regulation
Education
Capital per worker
Indicator Score in the Prosperity Index
Key score drivers for economic competitiveness. The graph below shows the
competitiveness factors with the greatest influence on Australia’s score, after the
Prosperity Index weighting scheme has been applied.
30	 	 2008 Legatum Prosperity Index
PRINCIPLES
OFPROSPERITY
When it comes to prosperity, each country has unique opportunities
and challenges. That is even more clear now that surveys such as the
Gallup World Poll and World Values Survey enable us to compare the
experiences of individuals in more than 100 countries worldwide.
2008 Legatum Prosperity Index	 	 31
Nonetheless, the statistical research presented in the 2008 Prosperity
Index Report identifies some clear patterns in the data on global wealth
and wellbeing. In what follows, we highlight eleven Principles of
Prosperity based on these patterns and suggest some potential
implications for individual and policy choices.
32	 	 2008 Legatum Prosperity Index
OUR VIEW: Wellbeing in European and North
American countries has been studied for decades.
In the past few years, however, new surveys such
as the Gallup World Poll and World Values Survey
have produced high-quality datasets for Africa,
the Middle East and Southeast Asia.
While some findings vary, there is one factor
that appears to have a large impact on wellbeing
in nearly every country studied: whether or not
individuals perceive that they have freedom of
choice and the ability to control the way their
lives turn out. In nearly every country, people
who report high levels of freedom of choice and
control over how their life turns out are happier
than those who do not. This is as true in Nigeria
as it is in the Netherlands. Furthermore, the
countries where people report the highest levels
of freedom of choice, notably the United States
and New Zealand, followed by Canada, Australia,
and Austria, tend to enjoy higher levels of life
satisfaction than other countries.
Why is this? Freedom of choice implies the
existence of opportunity, and the absence of
restraint by arbitrary authority. For people of all
nations, cultures, income levels, and backgrounds,
being free to choose entails having the chance
to create better lives for themselves and their
families. Freedom of choice in turn is anchored
in human dignity and human liberty. Dignity
describes the inherent value and sanctity that
defines every person; liberty means the capacity
to think, speak, and work freely and the creativity
to produce, build, and grow freely. Nations that
affirm human dignity and liberty equip their
citizens with the freedom to choose the best
course for their lives and realise their individual
potential.
Freedom of choice does not mean license to
harm. The strong connection between freedom
of choice and wellbeing holds only for people
making choices to better their own lives, not to
1. FREEDOM OF CHOICE IS CRUCIAL
Freedom of choice
implies the existence of
opportunity, being free to
choose entails having the
chance to create better
lives for themselves and
their families.
FINDING: There is a robust correlation between perceived
freedom of choice and self-reported life satisfaction in nearly
every country studied, across regions and income levels.
2008 Legatum Prosperity Index	 	 33
PRINCIPLES OF PROSPERITY
The strong connection between freedom of choice and wellbeing holds only for
people making choices to better their own lives, not to harm the lives of others.
harm the lives of others. Nor does freedom of
choice mean that people always choose wisely.
Rather, the research shows that people are
happiest when they are free to realise the benefits
of their good choices – and to learn from the
consequences of their bad choices. It has been
said that good judgment comes from experience,
and experience comes from bad judgment.
If government policy, however well-intended,
denies people the freedom to learn from their
choices, they arguably are also denied the
opportunity to gain the experience and wisdom
needed for their own personal development.
There are many potential impediments to
freedom of choice. Poverty, corruption, illness,
illiteracy, oppression, excessive regulation,
cultural restrictions, and many other factors can
all constrain people’s ability to chart their own
course. Looking through the country rankings,
citizens report the least freedom to choose in
places ranging from Algeria to Macedonia to
Nepal to Zimbabwe. The reasons vary. Algeria
has been afflicted by decades of civil war and
terrorist violence; Macedonia suffers from
persistent corruption and economic stagnation;
Nepal has endemic poverty and political
instability; Zimbabwe’s many torments include
tyranny and hyperinflation. As different as these
nations are, in each of them the people have little
chance to choose a better life for themselves.
There is almost as much diversity among
countries where people are happy with their
freedom to choose. Some are wealthy (Norway
and Finland), while others are poor yet growing
(Vietnam and Ghana). Some are secular (Denmark
and Sweden), others are predominantly Christian
(Costa Rica and the Philippines), Buddhist
(Thailand), or Islamic (Malaysia and the United
Arab Emirates). In all of these places, people’s
happiness with their freedom to choose bodes
well for their futures.
COMPARING PROSPERITY IN CHINA, TAIWAN 	
AND HONG KONG
Any attempt to compare the rankings
of China, Taiwan and Hong Kong is
complicated by disparities in geography,
population, and history. Nevertheless,
some interesting findings emerge.
Despite its recent rapid economic
growth, mainland China ranks far down
the economic competitiveness scale,
compared to Taiwan and Hong Kong,
because the mainland’s levels of
productive capital investment, education,
and income remain very low when
measured on a per capita basis.
On the liveability side, the divergence is
also substantial. Taiwan and Hong Kong
have political systems that are significantly
more free and functional than that of
China, with Taiwan leading the group on
political rights and Hong Kong leading on
control of corruption. On environmental
indicators, citizens of the People’s
Republic of China – perhaps with lower
expectations – report good air quality
while Hong Kong has one of the worst
air pollution scores in the world
(ironically enough, mostly because of
pollution emanating from China’s
Guangdong Province). On other social
indicators, including charitable giving
and religious freedom, Hong Kong and
Taiwan far exceed the performance of
the People’s Republic.
All three countries and territories,
however, have one thing in common:
excellent levels of innovation, or, more
accurately, commercialisation of
innovation. Many a foreign technology,
as anyone who has done business in the
region can attest, has been adopted
and then improved by local companies.
Country
OverallRank
EconomicCompetitivenessRank
ComparativeLiveabilityRank
Income
CapitalPerWorker
SecondaryEducation
HighTechExports
Patents
ControlofCorruption
PoliticalRightsandCivilLiberties
CleanAir
Volunteering
CharitableGiving
ReligiousFreedom
Hong Kong 8 2 19 19 17 3 33 9 15 4 -42 -4 13 7
Taiwan 20 5 36 4 16 6 18 4 7 -20 -4 2 10
China 53 50 58 -5 -6 -5 16 21 -7 -19 9 -17 -13 -21
2008 Legatum Prosperity Index	 	 35
2. GOVERNMENT SHOULD BE EFFECTIVE,
HONEST AND LIMITED
Although good
governance
does not create
prosperity, it
does create an
environment in
which economic
competitiveness
and
comparative
liveability
flourish.
OUR VIEW: While government does not create
prosperity, it does create an environment which
will encourage productive endeavour to either
flourish or fail. Citizens are most empowered to
pursue wealth creation and happiness when their
governments maintain basic order, apply impartial
justice, respect human rights, and function with
transparency and integrity. In contrast, citizens
living under oppression, ineptitude, and
corruption face severe obstacles to achieving
economic growth and life satisfaction.
Democratic governance can take many forms and
the top ranked countries display a wide diversity
of systems. But they have in common a few basic
and indispensable characteristics. These include
the rule of law, an independent judiciary, respect
for human rights and civil liberties, multiple
political parties, media freedom, transparency,
institutional checks and balances, and rulers who
are accountable to their citizens through regular
competitive elections.
Besides the structure of a government, two
other areas are vital for good governance: what
a government does – and what it does not do.
First, a government should be effective, meaning
it provides basic services for its citizens honestly
and efficiently. This includes areas such as national
security, law enforcement, judicial services,
regulations, revenue collection, and border
control. Second, a government should be limited,
meaning that its power is restrained by its citizens
and by law, and that it respects the proper roles
of the private sector. Ways that governments
exceed their limits include everything from
excessive taxation, onerous regulation, and
violation of property rights, to abuse of human
rights, stifling of civil society, and encroachment
on commercial enterprise. In short, governments
cannot create prosperity, but do their job best
when they respond to the demands of their
citizens and foster the conditions for them to
create prosperity.
Every one of the top 29 countries in the overall
Prosperity Index scores half a standard deviation
or more above the global mean on good
governance. The weightings are equally telling
(see the callout, What Explains Differences in
National Prosperity? on page 22). At a broad
range of income levels, governance is one of
the strongest factors – and in some cases the
strongest factor – behind economic growth
and happiness.
Singapore and Hong Kong are the exceptions
that prove the rule. These unique city-states are
the only two governments in the top quartile
that are not fully democratic and accountable
to their citizens. Yet they rank very well in other
governance areas such as efficiency, effectiveness,
rule of law, lack of corruption, and respect for
economic liberty.
FINDING: Governments that exercise power responsibly and are accountable to
their citizens dominate the top quartile of the rankings for both material wealth
and life satisfaction.
PRINCIPLES OF PROSPERITY
36	 	 2008 Legatum Prosperity Index
FINDING: In countries with an average income per person of roughly 	
US $10,000 or less, income levels are the single strongest predictor 	
of how satisfied, on average, people will be with their lives.
OUR VIEW: While “money can’t buy happiness”,
it is equally true that a lack of money can cause
great misery. In rich countries, without exception,
people on average report themselves satisfied
with their lives. By contrast, in many poor
countries, such as Zimbabwe and Pakistan, the
stresses of hunger, poor housing, and physical
insecurity appear to be so overwhelming that
large numbers of people report themselves
dissatisfied with the lives they lead. This suggests
that for countries at the lower end of the income
scale, raising incomes via long-term economic
growth should be among the top priorities.
To be sure, poor countries have strengths in
many other areas. The highest scores on many
of the liveability indicators in the 2008 Prosperity
Index are to be found in the developing world.
Countries including Peru, Bolivia and Kenya have
the most favourable climates (measured via a
temperature average that has been weighted
according to where their populations reside).
Wealthy New Zealand leads on the environmental
indicators in the Index, but developing Botswana
is close behind. Panama and Colombia are ranked
highest on family life, with divorce and
widowhood relatively rare and most people
reporting they have someone to rely on in times
of need, and the Dominican Republic and
Venezuela lead in indicators of religious life.
Nonetheless, it stands to reason that for the
destitute, even the most pleasing natural
environment will not produce happiness.
This simple observation is borne out by the data.
At low levels of income, the pernicious impact
of poverty tends to outweigh the positive
impacts of the other factors described above.
For the poorest countries, raising incomes
through economic growth will achieve the
greatest wellbeing dividends. And today’s poor
countries could well become tomorrow’s
prosperity leaders, if they can meet the challenge
of preserving their traditional strengths as they
climb the prosperity ladder.
3. FOR POOR COUNTRIES, RAISING 	
INCOMES IS THE FIRST PRIORITY
2008 Legatum Prosperity Index	 	 37
OUR VIEW: The “Easterlin Paradox” is one of the
earliest and most established findings of academic
research on human wellbeing. Identified in 1974
by Richard Easterlin, the “paradox” is that even
though more income may appear to produce
higher levels of life satisfaction, survey data
indicate that rich countries that have become
even richer have not become any happier.
New data, particularly from the Gallup World
Poll, have cast some doubt on this “paradox”.
These new data suggest that the relationship
between income and life satisfaction continues
to hold all the way up the income scale. These
new findings have led to an avalanche of recent
newspaper headlines to the effect that “money
is what matters, after all”.
These headlines are overstating the case. The new
data show a significant relationship between life
satisfaction and income, but nonetheless indicate
diminishing returns to additional income. That is
to say, the first $10,000 in annual income makes
a big difference, providing essentials like food and
shelter. The next $10,000 in income matters a bit
less. The $10,000 after that matters less still.
Because the relationship between income and life
satisfaction is logarithmic, each step increase on
the life satisfaction scale requires a doubling of
income: a person earning $10,000 who earns an
additional $10,000 experiences the same boost in
life satisfaction as a person earning $100,000 who
earns an additional $100,000. Hence at high levels
of income, vast sums must be added to make any
noticeable difference.
The main lessons drawn from Easterlin’s research
remain valid: for most people in rich countries,
non-material drivers will have a bigger impact
on their wellbeing than changes in income (this is
just as true when looking at differences between
average life satisfaction levels among nations –
see the callout, What Explains Differences in
National Prosperity? on page 22). Citizens of rich
countries may wish to consider the liveability
drivers carefully as they evaluate their personal
choices. It has long been said that wealth poses
a more difficult test of a person’s character than
poverty, as wealth offers more choices, for good
and for ill, and needs to be managed responsibly.
FINDING: Each step increase on the life satisfaction scale is associated with 	
a doubling of per capita national income.
For most people in rich
countries, non-material
factors such as family,
community, and faith will
have a bigger impact on
their wellbeing than further
increases in income.
4. FOR RICH COUNTRIES,
PROSPERITY MEANS MORE THAN
JUST MONEY
PRINCIPLES OF PROSPERITY
PROSPERITY IN SUB-SAHARAN AFRICA
Out of the 15 Sub-Saharan African
countries featured in this year’s Index,
only three are not ranked in the bottom
quartile of prosperity: South Africa (38th),
Botswana (45th) and Namibia (55th).
These rankings reflect the fundamental
and often well-publicised problems of the
region. One of these is poverty and capital
flight: aside from the three countries
mentioned above, a lack of capital
investment hampers accumulation of
material wealth and low incomes restrain
wellbeing. Poor governance, low levels of
education, high dependence on foreign
aid, chronic unemployment and low
average life expectancies are further
well-known obstacles to national
prosperity in Africa.
While governments in Sub-Saharan Africa
need to alleviate sources of misery for
their citizens, the region maintains
comparatively high levels of social support
via community and religious life. There are
also signs of optimism: notably high
proportions of the population believe that
working hard will enable them to get
ahead. Exceptions are Mali and Zimbabwe,
where a lack of equal opportunities goes
along with perceptions of restricted
individual choice. Dissatisfaction with
personal freedom also persists in Sudan,
Nigeria and Cameroon, and – perhaps a
legacy of the apartheid regime – in South
Africa as well.
But there are many bright spots. Well-
governed Botswana has, over a period of
30 years, achieved one of the fastest rates
of income growth in the world (although
HIV/AIDS infection rates are extremely
high). Namibia is unique in the region in
having no severe weaknesses (and one
notable strength, equality of opportunity).
And South Africa has enjoyed success in
enabling individual entrepreneurship by
lowering the costs of formalising a
business.
Economic Competitiveness
OverallRank
Country
Rank
Growthininvested
capital
Goodgovernance
Bettereducation
Economicopenness
Entrepreneurship
Foreignaid
38 South Africa 41 -6 5 1 -6 10 4
45 Botswana 54 1 4 -10 -6 7 2
55 Namibia 61 -4 -1 -6 -1 0 -7
86 Ghana 79 -10 -2 -10 -7 -6 -20
94 Nigeria 89 -11 -13 -7 -8 -9 -5
92 Senegal 90 -10 -5 -15 -7 -15 -20
96 Mozambique 91 -11 -6 -19 -5 0 -30
96 Kenya 92 -11 -9 -16 -7 -7 -12
100 Tanzania 93 -11 -6 -17 -6 -7 -26
93 Cameroon 94 -10 -12 -9 -11 -17 -5
99 Zimbabwe 98 -10 -21 -10 -7 0 -15
102 Mali 100 -11 -7 -18 -8 -17 -24
102 Zambia 101 -11 -10 -12 -6 -3 -19
94 Sudan 102 -9 -15 -15 -8 -9 -16
101 Central African Republic 104 -11 -17 -16 -14 -21 -20
Comparative Liveability
OverallRank
Country
Rank
Freedomofchoice
Equalityof
opportunity
Goodgovernance
Pleasant
environment
Highincomes
Goodhealth
Lowunemployment
Communitylife
Religiousbelief
45 Botswana 38 6 1 5 17 -1 -18 -7 -10
38 South Africa 43 -8 15 5 -4 -2 -13 -16 -4 9
55 Namibia 50 3 11 0 8 -5 -3 6 -7
86 Ghana 85 10 6 1 4 -9 -6 0 8
94 Sudan 86 -13 2 -20 2 -10 2 -8 -3
93 Cameroon 89 -8 -4 -13 6 -10 -21 -20 -3
92 Senegal 92 -2 -6 -2 -10 -10 -6 -40 -2
101 Central African Republic 95 -5 11 -13 10 -10 -9 3 10
99 Zimbabwe 96 -24 -10 -19 0 -10 -18 5 -6 12
96 Kenya 97 -5 3 -4 8 -10 -5 -31 -4
96 Mozambique 98 -6 5 -2 1 -10 -2 -11 -5
94 Nigeria 99 -8 1 -10 -7 -11 -4 5 9 12
102 Zambia 101 -4 8 -6 3 -11 -11 -42 -4
102 Mali 102 -15 -20 2 0 -11 -16 -20 -10
100 Tanzania 104 -1 10 -5 3 -11 -20 6 -7 12
In the past decade, strong religious faith
has come to be associated by some people
with terrorism and violence, as extremist
groups have claimed religious justifications
for their actions. In the Prosperity Index,
however, religious engagement is a
positive indicator. Why?
A repeated finding of research on the
science of happiness is that there is a
positive link between religious
engagement and wellbeing. For instance,
people who report that God is very
important in their lives are on average
more satisfied with their lives, after
accounting for their income, age and
other individual characteristics. Research
also suggests that religious people’s
happiness is less vulnerable to fluctuations
in economic and political uncertainty,
personal unemployment and income
changes.
The Prosperity Index identifies similar
effects at the country level. A number of
highly religious countries are happier, on
average, than one might expect based on
their standard of living alone. This effect
is perhaps most pronounced in Mexico,
El Salvador, the Dominican Republic,
Indonesia, Venezuela and Nigeria. As this
diverse list suggests, this effect can be
found in many regions and for many faiths.
That said, one must also account for the
negative impacts of religious intolerance
or extremism. The Prosperity Index does
so with another indicator, religious
freedom, which also correlates with
average national life satisfaction.
Countries with high levels of religious
faith score well on the Religious Life
indicator in the Index, but they achieve
top marks only if they have religious
freedom as well.
FAITH AND HAPPINESS
2008 Legatum Prosperity Index	 	 41
FINDING: Entrepreneurship indicators show a significant statistical relationship
with long-term economic growth in both rich and poor countries.
5. ENTREPRENEURSHIP IS A PROMISING 	
PATH TO MATERIAL WEALTH
OUR VIEW: In almost any given economy, small
businesses are the largest employers. In emerging
markets, small businesses often offer the best
hope for economic growth and social stability
through the creation of worthwhile, sustainable
employment.
The statistical analysis detailed in the 2008
Prosperity Index Report suggests that
entrepreneurship plays multiple roles in growth.
In poor countries, it is the cost of starting a
business that shows the strongest relationship
with income growth. In these countries, a few
uncompetitive businesses often dominate
economic production. With capital hard to come
by and the cost of starting a new business
prohibitive, it is extremely difficult to dislodge
poorly-performing businesses that have strong
political connections. The countries that can
overcome this challenge are often those with low
barriers to starting businesses. This allows capital
to come into the formal sector, where it can be
invested productively and pose a serious
competitive challenge to more established but
under-performing enterprises.
In rich countries, by contrast, the
entrepreneurship indicator that shows a
significant relationship with long-term economic
growth is the rate of business ownership. In these
countries, the vast majority of the population
has entered the formal economy, and attracting
capital is less of a problem – provided that
regulations are sound and tax rates are low.
However, there are reserves of creativity and
innovation that are untapped (see the callout,
Supporting New Research on page 20). For
instance, a university professor may stumble upon
a research breakthrough with great commercial
implications. However, her university is not the
place to commercialise it, and if the idea is
sufficiently complex, she will have a hard time
convincing a large company to invest in it. In
countries that encourage entrepreneurship,
however, she can use her idea to start a business
that may one day grow to be the next Google.
PRINCIPLES OF PROSPERITY
WHO’S GOING PLACES?
The Economic Competitiveness section of
the Index measures achievement: which
countries have done the most to increase
the wealth of their citizens? But there is
also the question of progress: which
countries are doing the most to achieve
the highest growth rates today, to top the
competitiveness rankings tomorrow? To
answer this question, we have recalibrated
the Economic Competitiveness Index to
assess performance over the past five
years, and present the results in the table
below.
Last year the top five were Ireland,
Croatia, Portugal, Greece and China.
This year the same phenomenon
dominates the top ranks: catch-up growth
by the newer European Union members,
with Slovakia and Bulgaria leading at 1st
and 2nd, and Romania close behind at
7th (not shown on the chart). Joining the
European Union seems to make the
income convergence predicted by
economic theory a reality. Like Ireland
and Portugal before them, today’s new EU
members appear on their way to joining
the ranks of the world’s richest countries.
By contrast, the phenomenon dominating
the bottom five places is insecurity
(see the callout, Security and Prosperity
on page 48). Several countries, most
notably Zimbabwe, have registered actual
net destruction of their stocks of physical
and human capital. Sierra Leone has
also experienced the shock of political
instability and war in recent years.
More positively, another phenomenon
highlighted by these rankings is that of
convergence in global incomes. Though
predicted by economic theory,
historically, this has not occurred: while
economic growth has continued in the
rich world, in many of the poorest
regions, blighted by insecurity or poor
governance, the pace of growth has been
much slower. The result has been actual
divergence of global incomes, and a
growing material wealth gap between
the richest and poorest nations.
While severe problems persist in many
countries, the global wealth gap is starting
to narrow. China ranks 6th on our “who’s
going places” ranking, and India ranks
10th. Recent economic growth rates in
these countries tell the same story.
Both economies have recently grown
faster than almost any country in the rich
world. Because these two giant nations
are home to more than two billion people,
these improvements in competitiveness
are bringing about a dramatic lessening of
the global wealth gap, and are very good
news for global prosperity.
Invests productively Commercialises new ideas
Avoids
dependence
Rank
Country
…viagrowthin
investedcapital
…viagood
governance
…viacompetitive
markets
…viabetter
education
…viaeconomic
openness
…by
commercialising
innovation
…via
entrepreneurship
…oncommodity
exports
…onforeignaid
1 Slovakia 41 8 0 1 20 4 15 -16 8
2 Bulgaria 39 0 -3 -8 17 0 9 5 8
3 Singapore -10 19 6 -4 47 25 4 -3 7
4 Taiwan -4 8 32 -1 10 19 2 1 8
5 Chile -3 11 9 1 5 0 9 -1 7
100 Ecuador -1 -15 -19 2 -6 -14 -3 -21 -16
101 Central African Republic -6 -18 7 -7 -14 -10 -21 -16 -3
102 Lebanon -12 -7 -12 -8 -5 -7 -14 6 -26
103 Cambodia -11 -13 4 -14 -7 -8 -21 -20
104 Zimbabwe -15 -21 3 -7 -7 -9 0 3 -18
2008 Legatum Prosperity Index	 	 43
FINDING: The factor with the strongest statistical relationship to economic
growth is the growth in the value of fixed capital investment (such as factories 	
and machinery) per worker.
OUR VIEW: Every country has financial capital,
but all too often it is dormant and unproductive.
Sometimes it is hidden under the mattresses of
the poor, or in their informal homes, because the
absence of secure property rights makes it
impossible for the poor to put these assets to use
(for instance, a squatter without legal title to his
or her home cannot mortgage this home to start
a small business). Sometimes a country’s financial
capital becomes flight capital, which seeks a more
stable and welcoming environment in foreign
banks or real estate.
It is difficult to lure this capital out of its hiding
places and back into a country’s economy because
productive assets such as factories are high-profile
and immobile – easy targets for thieves or
unscrupulous government officials. Turning hidden
capital into invested capital thus requires a great
leap of trust by investors, and this usually only
happens in stable business environments offering
sound property rights, the impartial application of
just laws, and good economic policy.
6. GROWTH IN INVESTED CAPITAL IS CRUCIAL
TO LONG-TERM ECONOMIC GROWTH
PRINCIPLES OF PROSPERITY
The 2008 Prosperity Index analyses
aggregate wellbeing in nations. But surely
the research on the science of happiness
has something to say about the choices
we make as individuals – about where to
live, whether or when to marry, or how
to spend our time?
In fact, surveys such as the Gallup World
Poll, World Values Survey, US General
Social Survey, the European Quality of
Life Survey, and the German Socio-
economic Panel Survey, have addressed
these questions in detail. Some of the
relationships identified by scholars
analysing these survey results are
fascinating. For instance:
People living close to a coastline tend•	
to be happier.
Long commuting times may have a•	
large negative impact on one’s life
satisfaction.
Long commuting times of one’s partner•	
also have a negative impact.
Parental divorce during childhood•	
appears to have a negative impact on
wellbeing, lasting into adulthood.
Women tend to be happier than men.•	
This research on survey data from
hundreds of thousands of people in more
than 100 countries worldwide has created
a new body of knowledge, often called the
“science of happiness”.
What can this new science tell you? Use
our Personal Prosperiscope to find out.
Answer the same survey questions that
were used in major research studies on
human wellbeing, and the Prosperiscope
will tell you what factors may be having
the biggest impact on your satisfaction
with life.
The Personal Prosperiscope is available
online at www.myprosperity.com.
THE PERSONAL PROSPERISCOPE:
MEASURING YOUR HAPPINESS
2008 Legatum Prosperity Index	 	 45
OUR VIEW: Many of the factors in the
Prosperity Index have a simple relationship
with economic growth. Increases in capital
and education contribute directly to the value
of physical and human capital and thus directly
increase economic output. Poor governance
and excessive bureaucracy impose costs on
business and thus restrain growth.
Foreign investment and trade are different.
These factors are measured as a percentage of
economic output – that is, based on their
relative weight in an economy, not their direct
contribution to output. Analysis of these data
reveals a strong relationship between the weight
of foreign trade and investment and long-term
growth.
In part, this is because openness helps poorer
countries catch up. Exposure to foreign trade
and investment enables poor countries to adopt,
in a matter of a few years, certain technologies,
skills, and business methods that required
generations to develop in Western Europe and
North America. Foreign direct investment in
particular is doubly beneficial: not only does it
provide much-needed invested capital (see
Principle 6 on page 43), it also facilitates the
transfer of advanced skills and technology.
Increases in capital and
education contribute
directly to the value of
physical and human capital
and thus directly increase
economic output.
FINDING: Economies in which foreign investment and trade play a greater 	
role grow more rapidly than closed economies.
7. ECONOMIC OPENNESS CAN HELP 	
POORER COUNTRIES CATCH UP FASTER
PRINCIPLES OF PROSPERITY
MAKING TIME FOR LEISURE
Studies of wellbeing survey data have
repeatedly found evidence of the
importance of “taking it easy”, as the
saying goes. For instance, people who
say they frequently spend time socialising
tend to be happier. One survey, the
World Values Survey, covering more than
90,000 people in 84 countries, found that
people who considered leisure to be more
important than work were significantly
more satisfied with their lives than people
who thought the opposite.
The Prosperity Index considers this issue
as well, at the national level. Using data
from the Gallup World Poll, the Index
indicates that countries where people
report they have more hours for leisure
each day tend to have higher levels of
wellbeing. The Index also tracks average
working hours, as reported by national
statistical authorities. This shows a more
complex relationship with wellbeing: in
rich countries, where people can choose
between jobs with longer or shorter
working hours, shorter workdays are
correlated with higher life satisfaction.
In poorer countries, however, this
relationship is absent or even reversed,
presumably because many people are
underemployed, and would wish to work
more hours if they could.
Looking at the countries in the Index,
some clear patterns are evident. Working
hours are extremely long in even the
wealthiest Asian countries, suggesting
that one avenue for individuals to improve
their wellbeing might be more vacation
time, given the lower liveability scores in
Asian countries. And citizens in each of
the bottom 20 countries in the
Comparative Liveability Index report very
few leisure hours, which further
emphasises the importance of leisure to
wellbeing. It seems evident that
competitive economies offering their
citizens a range of opportunities provide
a fruitful environment in which workers
can balance work and free time.
2008 Legatum Prosperity Index	 	 47
OUR VIEW: As will be immediately evident
to anyone who has moved in search of warmer
winters or a stretch of coastline, the environment
matters to human happiness. As far as
temperature is concerned, research suggests that
moderate temperatures are best: a winter that is
not too cool, and a summer that is not too hot.
As mentioned above, countries like Peru, Bolivia
and Kenya have the most favourable climates in
this regard. The harshest climates in the
Prosperity Index are found in extremely cold
Mongolia and extremely hot Kuwait.
At first glance, it may appear that these climate
statistics are of great interest to individuals, but
of little interest to policymakers. However, the
results reported in the Prosperity Index suggest
that cold climates have a strong negative impact
in poor countries but not in rich countries.
This makes intuitive sense: in rich countries,
people are more able to afford the well-built
homes and heating that can take the sting out
of a cold winter. This finding suggests that poor,
cold countries will receive a “double benefit”
from economic progress: not only will rising
incomes directly benefit Mongolians, but the
negative wellbeing impact of spending harsh
winters on the steppe will be reduced. Scholars
have suggested that hot climates can hinder
economic development, for instance by increasing
the prevalence of tropical disease. The Index
identifies a negative impact of extreme heat on
wellbeing that persists across the income scale.
The 2008 Prosperity Index Report also finds a
strong impact on life satisfaction of environmental
quality indicators including land area devoted to
nature and air quality. At the extremes,
environmental degradation almost certainly has a
severe impact on human wellbeing. The countries
in the Index with the worst perceived air quality
are Hong Kong, Ukraine, and Russia. Those
countries with the smallest land area devoted to
nature (on a per-person basis) are Belgium,
Singapore, and Taiwan. Those with the greatest
dissatisfaction with environmental preservation
efforts are Ukraine, Russia, and Macedonia. In
these countries, personal choices that prioritise
the environment may go a long way towards
improving wellbeing.
8. CLIMATE AND THE ENVIRONMENT	
IMPACT OUR HAPPINESS
FINDING: Several indicators of climate and the environment, including
temperature extremes, land area devoted to nature, and air quality, show a
significant relationship with average national life satisfaction.
PRINCIPLES OF PROSPERITY
The 2008 Prosperity Index does not
include a specific security component,
but implicitly, security plays a major role.
This is evident from the overall Index
rankings. The top twenty countries and
territories in the Index are at domestic
peace and are politically stable. Some are
involved in conflicts overseas (such as the
United States and United Kingdom), and
some have difficult regional relations
(such as Taiwan or Israel). But all are
generally able to provide physical security
for their citizens. Moreover, consistent
with the Prosperity Index’s emphasis on
accountable governance, numerous
studies have identified the “democratic
peace theory” that democratic
governments rarely, if ever, go to war
with each other.
In contrast, many of the bottom twenty
countries in the Index face significant
security challenges. Zimbabwe and Kenya
have recently been gripped by internal
violence, Nigeria by ongoing conflict in the
Delta, Pakistan by terrorism and instability,
and Sudan by ongoing violence in the
Darfur region and elsewhere. Paul Collier
of Oxford University identifies the
“conflict trap” as one of the most
pernicious and persistent barriers to
economic growth. Insecurity can destroy
stocks of physical and especially human
capital, both directly and because the
most talented and well-educated workers
will tend to flee the country, as well as
reduce incentives to invest in these
fundamental drivers of economic progress.
In conflict and even early post-conflict
environments, businesses cannot flourish,
investors are not welcome, basic services
are not provided, and trade shuts down.
Men and women are hindered from work,
students cannot attend schools, and
families and communities cannot thrive
where the streets are not safe. Insecurity
also appears, unsurprisingly, to undermine
people’s feelings that they are able to
make free choices and control their lives:
on this indicator, Zimbabwe and Pakistan
report two of the lowest scores in the
Index.
Because of its severe negative impact on
almost every dimension of wealth and
wellbeing, insecurity often is the most
urgent challenge to address before
progress can be made on other drivers
of prosperity. Conversely, security is an
indispensable factor in sustaining the
virtuous cycle of economic growth,
effective governance, social capital, and
quality of life. Moreover, prosperous
nations that provide security for their
own citizens often are able to strengthen
the security environment in their region
and the world, including through
deterrence of potential threats, support
for peacekeeping missions, and military
partnerships with developing nations.
Given the important links between
security and prosperity, we hope to
explore these issues further in future
editions of the Prosperity Index and
encourage others to do the same.
SECURITY AND PROSPERITY
2008 Legatum Prosperity Index	 	 49
OUR VIEW: The timeless wisdom that “it is
better to give than to receive” is backed up by
the latest research. A series of studies have found
that volunteering and charitable giving raise the
wellbeing of not just the recipients of charity, but
also of the givers (see the callout, Supporting
New Research on page 20). While in wealthy
countries additional income produces little
measurable gain in life satisfaction, those who
choose to give away part of their income tend to
report higher levels of personal wellbeing.
The 2008 Prosperity Index Report finds similar
patterns, but at the societal level. Countries in
which people report extremely high levels of
volunteering (led by the Central African Republic,
New Zealand, the United States, and Ireland),
and countries in which a high percentage of
people are engaged in charitable giving (led by
the Netherlands, the United Kingdom and
Switzerland), tend, on average, to report higher
levels of life satisfaction than might otherwise
be expected.
These impacts may come about through the
creation of “social capital” (in the 2008 Prosperity
Index, indicators of social capital are grouped
under the Community Life heading). Volunteering
in particular may promote the growth of
community organisations that bring citizens into
contact with each other and enhance levels of
social trust. Of course, the higher average levels
of wellbeing in these countries may come about
because the people who give or volunteer are
themselves happier.
Either way, the relationship between giving and
wellbeing provides another example of the
importance of freedom of choice: choices freely
made by individuals to donate their time and
income, as opposed to coercive policies of wealth
redistribution, have empowered individuals to
strengthen their communities and enhance
liveability in their home nations.
FINDING: There are significant statistical relationships between life satisfaction,
charitable giving, and volunteering.
Volunteering especially
may promote the
growth of community
organisations that bring
citizens into contact with
each other and enhance
levels of social trust.
9. DEVELOP YOUR GIFT AND THEN GIVE 	
IT AWAY
PRINCIPLES OF PROSPERITY
PROSPERITY IN THE MIDDLE EAST
Given the Middle East’s dominance of
international news and its strategic
importance, conditions in the region will
continue to attract global attention.
The Prosperity Index finds that the region
is far from monolithic. Middle Eastern
countries cover a range of rankings, from
Israel, the UAE and Kuwait within the top
30, to Jordan, Tunisia and Saudi Arabia in
the top 50, to Egypt lower down and
Yemen at the bottom of the Index.
To be sure, many Middle Eastern countries
do have some things in common. No
Arabian Gulf or North African country
scores well on political life, chiefly because
of a lack of political rights and civil
liberties. This indicator of democracy
shows an increasingly strong relationship
to life satisfaction as countries become
wealthier, and is an area needing
considerable improvement in the region.
However, most Middle Eastern countries
score very highly on satisfaction with
health, on family life, and on religious
faith. Survey data suggest that, together
with highly-religious Latin America, the
region is home to a disproportionately
large number of the world’s faithful.
Yet all Middle Eastern countries in the
Index, except Israel, score poorly on
religious freedom.
Predictably, some of the richer Middle
Eastern countries report high levels of
charitable giving, but also, on the
economic side, many countries exhibit
dependence on commodity exports
(notably oil and gas). A dearth of trade
agreements is in part an artefact of severe
political tensions in the region.
The UAE, one of the highest-ranked
Middle Eastern countries, warrants a
special mention. One of the emirates,
Dubai, has, in particular, moved past
dependence on oil exports towards a
more diversified economy based on
attracting international capital and talent.
As a result, the UAE has an extraordinarily
high migration and therefore opportunity
score, as a global workforce has flocked
to the opportunities created by Dubai
and its fellow emirates.
Economic Competitiveness Comparative Liveability
OverallRank
Country
Rank
InvestedCapital
GoodGovernance
Education
Commercialising
Innovation
CommodityExports
Rank
FreedomofChoice
GoodGovernance
Health
CommunityLife
ReligiousFreedom
ReligiousBelief
19 Israel 8 12 8 11 13 7 21 0 7 7 6 3 2
28 United Arab Emirates 39 6 6 -2 6 -23 20 12 1 9 -2 -8
30 Kuwait 35 2 2 18 4 -38 27 2 -1 12 -9 -17
45 Saudi Arabia 62 11 -5 -9 -1 -38 30 -10 -9 8 3 -24 12
49 Tunisia 52 -4 2 -6 -1 52 -2 -4 3 -12 -11
50 Jordan 42 -6 0 12 -6 4 63 -1 -5 8 -12 -17 13
66 Algeria 65 6 -7 -5 -6 -32 67 -19 -9 4 -8 -14 12
67 Egypt 56 -8 -7 -2 -5 1 79 -3 -11 5 -11 -17 12
73 Iran 87 -3 -13 -6 2 -12 55 -12 -12 3 2 -17 11
74 Morocco 77 -7 -3 -11 -7 6 66 -3 -6 4 -4 -6 13
79 Lebanon 82 -5 -6 1 -7 70 -4 -8 1 4 -6
104 Yemen 103 -10 -12 -11 -10 -16 103 -6 -13 -7 -9 -11
BHUTAN’S GROSS NATIONAL HAPPINESS
The mountainous Kingdom of Bhutan,
which famously forbade its citizens access
to television until 1999, was the first
country on earth to declare the pursuit
of Gross National Happiness (GNH) as a
policy goal. Other countries, including
France, have recently announced plans
to develop and prioritise broader
wellbeing indicators (see the callout,
A Fascination with Happiness on page 14).
But Bhutan’s GNH policy is not part of
some trendy attempt to capitalise on new
wellbeing research. The GNH policy was
announced in 1998, although some
scholars claim it was established by the
Fourth King of Bhutan when he assumed
the throne in 1972.
Perhaps unsurprisingly, the Bhutanese
government has seized on the new science
of happiness, and initiated research on
GNH indicators. But detailed and reliable
data on Bhutan is not available, which
prevents its inclusion in the 2008
Prosperity Index. If it did, how might
Bhutan fare, and how does the Legatum
Prosperity Index compare with the
Bhutanese concept of GNH, with its roots
in Himalayan Buddhism?
Firstly, the CIA World Factbook estimates
Bhutanese income per capita at $5,300,
which would likely place the country near
the bottom of the Prosperity Index.
At low levels of income per person,
the negative impacts of poverty tend to
overwhelm other influences on wellbeing.
At least, that is the story told by the
global statistical averages on which the
Prosperity Index is based – perhaps in the
unusual case of Bhutan, wise policy could
create good health and housing at low
levels of income? It is possible, although
infant mortality rates of 52 deaths per
1,000 live births (on par with Cambodia
and Zimbabwe, if the numbers are
accurate) do cast some doubt on this.
Bhutan’s operationalisation of GNH is
based on four pillars: equitable and
sustainable socio-economic development,
preservation and promotion of culture,
conservation of the environment, and
good governance. Most of these ideas do
find strong corollaries in the Prosperity
Index. Governance and the environment
are included in the Index, and show strong
links with wellbeing. Health, also in the
Index, is part of Bhutan’s socio-economic
development pillar. Finally, preservation
of culture, in the Bhutanese context,
includes elements of voluntarism and
family life, both of which feature strongly
in the Index weightings.
Is GNH missing anything? That is hard to
say. But freedom of choice is an obvious
candidate, and the Bhutanese state,
despite recent democratisation, seems to
take a strong interest in regulating
personal activity. And in terms of building
income and alleviating poverty, Bhutan
seems to be moving slowly – according to
the CIA World Factbook, three-fifths of
Bhutanese government expenditures are
funded by Indian development aid.
2008 Legatum Prosperity Index	 	 53
FINDING: The top 30 countries in the Prosperity Index include not only countries
from Western Europe and North America but also Asia, Eastern Europe, and the
Middle East.
OUR VIEW: It has sometimes been claimed
that geography shapes the destiny of nations,
and that the modern prosperity of many
countries is linked to their locations and natural
endowments in the distant past. While such
arguments may explain much of human history,
in the 21st century, these inheritances can be
overcome through smart choices.
For example, South Korea and North Korea
share a similar geography (not to mention
cultures and languages) and yet vastly different
destinies. Over a 35-year period, Botswana, a
landlocked country in Sub-Saharan Africa, was
the fastest-growing economy on earth, on a per
capita basis, while neighbouring Zimbabwe has
recently suffered one of the world’s worst
economic disasters. Modern technology and
medicine can break the curse of the tropics:
Singapore, which was once plagued by tropical
disease and corruption, now tops our Economic
Competitiveness Index, and has a stable and
effective government.
With top countries in the Prosperity Index
including the aforementioned Singapore
(a tropical country), the United Arab Emirates
(an Arab country), the Czech Republic (a former
communist country), and Malaysia (a majority-
Muslim country), it is fair to say that while
geography and history can pose ongoing
challenges, they are not destiny. This offers
hope to countries in regions blighted by
poverty and instability, as well as a lesson to
those governments that seek to attribute their
countries’ present misfortunes solely to a poor
inheritance.
10.	GEOGRAPHY IS NOT DESTINY
PRINCIPLES OF PROSPERITY
HAPPINESS – MORE THAN JUST MONEY?
Many of the factors that produce high
levels of life satisfaction in countries are
the by-products of economic success:
richer countries have more money to
spend on medical care, faster-growing
economies will tend to suffer lower rates
of unemployment, and of course, long-
term growth produces higher incomes
and reduces poverty.
There are, however, several factors that
are not highly correlated with income
but nonetheless strongly impact life
satisfaction – most notably Religious Life,
Climate, Equality of Opportunity, and
Family Life. Hence a few countries that
do very well on our Economic
Competitiveness Index do relatively
badly on our Comparative Liveability
Index, and vice versa.
There are interesting patterns in the
relationship between competitiveness
and liveability, as assessed by the
Prosperity Index. The top-performing
countries (in the upper right quadrant)
show some level of balanced pursuit of
both wealth and wellbeing. Russia,
Mongolia, and several Eastern European
countries, by contrast, tend to be
comparatively weak on liveability (relative
to their levels of competitiveness), with
poor scores in social capital, climate, and
the environment.
Conversely, many Latin American
countries tend to be comparatively
strong on liveability, with high scores on
religious faith and, usually, health. The
outlier, Trinidad & Tobago,
does not earn its position only by virtue
of being an island paradise (although its
climate scores are not bad). Rather, it has
an extreme negative score on one
competitiveness indicator, as 40 percent
of its economic output is generated by
reliance on oil and gas exports.
In the lower left quadrant, some
countries have a low rank owing especially
to poor liveability scores (e.g., Moldova),
others especially to poor competitiveness
scores (e.g., Ecuador), while Zimbabwe
has an obvious low rank owing to poor
scores on both.
Both competitive
and liveable
More competitive
than liveable
More liveable
than competitive
Neither competitive
nor liveable
Competitiveness
Liveability
Trinidad & Tobago
Moldova
Ecuador
Zimbabwe
Mongolia
Colombia, Venezuela,
Dominican Republic
Costa Rica,
Saudi Arabia
Norway, Sweden,
Denmark, Ireland
Australia
Japan, Germany,
Singapore, Hong Kong
Estonia, Hungary,
Slovakia
Russia, Ukraine
Plot of Competitiveness and Liveability
2008 Legatum Prosperity Index	 	 55
FINDING: The 2008 Prosperity Index includes both factors driven by individual
choice and factors driven by the choices of policymakers.
OUR VIEW: In seeking to explain the holistic
prosperity of nations, it quickly became apparent
that an Index confined to policy indicators, such
as political and civil liberties, the unemployment
rate, or economic openness, would omit many
crucial drivers. It also became apparent that for
a number of goals, the choices of citizens might
be just as, and perhaps more, effective than
government policy in producing favourable
outcomes. Is the health problem of obesity best
tackled through healthcare policy or citizens
choosing to eat better? Is air pollution best
tackled by new regulations or public pressure
on polluting companies? Is better education best
pursued and paid for by parents or government-
funded schools?
The statistical analysis in the 2008 Prosperity
Index avoids judgement on these issues. It simply
reports the statistical links between health,
pollution, education, and prosperity. Where
possible, the Index includes policy indicators as
well as indicators of results. The best solutions
for tackling each of these issues – especially as
regards life satisfaction, a relatively new area of
concern - will be tested in years to come.
What the 2008 Prosperity Index results do
clearly indicate is that both individuals and
governments have a role to play. No poorly
governed country has achieved high levels of
holistic prosperity (see Principle 2 on page 35)
since such countries have failed to create the
conditions necessary not only for economic
progress but also for personal flourishing. And in
the countries topping the Index, individual
choices on issues such as marriage, charitable
giving, and leisure time, have clearly played a
major role.
11. GOVERNMENTS AND CITIZENS EACH 	
HAVE A ROLE IN BUILDING THE PROSPERITY
OF NATIONS
The 2008 Prosperity Index
results clearly indicate
that both individuals and
governments have a role
to play.
PRINCIPLES OF PROSPERITY
56	 	 2008 Legatum Prosperity Index
Our understanding of the determinants of both material wealth
and life satisfaction has increased by leaps and bounds but much
remains unknown.
THE
INVESTIGATION
CONTINUES
2008 Legatum Prosperity Index	 	 57
2008 Legatum Prosperity Index

More Related Content

Similar to 2008 Legatum Prosperity Index

Bringing Prosperity to Life. The Legatum Prosperity Index™ 2016 Methodology R...
Bringing Prosperity to Life. The Legatum Prosperity Index™ 2016 Methodology R...Bringing Prosperity to Life. The Legatum Prosperity Index™ 2016 Methodology R...
Bringing Prosperity to Life. The Legatum Prosperity Index™ 2016 Methodology R...eraser Juan José Calderón
 
Presentation done by Indira singh
Presentation done by Indira singh Presentation done by Indira singh
Presentation done by Indira singh Dr. Amit Kapoor
 
HLEG thematic workshop on Measurement of Well Being and Development in Africa...
HLEG thematic workshop on Measurement of Well Being and Development in Africa...HLEG thematic workshop on Measurement of Well Being and Development in Africa...
HLEG thematic workshop on Measurement of Well Being and Development in Africa...StatsCommunications
 
Financial Development Report 2008
Financial Development Report 2008Financial Development Report 2008
Financial Development Report 2008kangaro10a
 
National Accounts of Well-being
National Accounts of Well-beingNational Accounts of Well-being
National Accounts of Well-beinglebenmitzukunft
 
Lecturenote 1532939641 ch1 note de
Lecturenote 1532939641 ch1 note deLecturenote 1532939641 ch1 note de
Lecturenote 1532939641 ch1 note deyousafhassan4
 
Measuring well being and progress brochure
Measuring well being and progress brochureMeasuring well being and progress brochure
Measuring well being and progress brochureDr Lendy Spires
 
Social Progress Index 2014 Executive Summary
Social Progress Index 2014 Executive SummarySocial Progress Index 2014 Executive Summary
Social Progress Index 2014 Executive Summarysocprog
 
Social Progress Index 2016 Methodological Report
Social Progress Index 2016 Methodological ReportSocial Progress Index 2016 Methodological Report
Social Progress Index 2016 Methodological ReportJonathan Talbot
 
The inclusive growth and development report
The inclusive growth and development reportThe inclusive growth and development report
The inclusive growth and development reportMarketing Durban Chamber
 
Human Wellbeing definition and measurement show [Autosaved].pptx
Human Wellbeing definition and measurement show [Autosaved].pptxHuman Wellbeing definition and measurement show [Autosaved].pptx
Human Wellbeing definition and measurement show [Autosaved].pptxAugustBenyamin
 
The Governance of Inclusive Growth - OECD
The Governance of Inclusive Growth - OECDThe Governance of Inclusive Growth - OECD
The Governance of Inclusive Growth - OECDOECD Governance
 
Economic growth and inequality.
Economic growth and inequality.Economic growth and inequality.
Economic growth and inequality.Kübra Bayram
 
sminar presentation (2013)
sminar presentation (2013)sminar presentation (2013)
sminar presentation (2013)university
 
Impact Investing: Case Study of Accion's Venture Lab
Impact Investing: Case Study of Accion's Venture LabImpact Investing: Case Study of Accion's Venture Lab
Impact Investing: Case Study of Accion's Venture LabBrienne Thomson
 

Similar to 2008 Legatum Prosperity Index (20)

Bringing Prosperity to Life. The Legatum Prosperity Index™ 2016 Methodology R...
Bringing Prosperity to Life. The Legatum Prosperity Index™ 2016 Methodology R...Bringing Prosperity to Life. The Legatum Prosperity Index™ 2016 Methodology R...
Bringing Prosperity to Life. The Legatum Prosperity Index™ 2016 Methodology R...
 
Presentation done by Indira singh
Presentation done by Indira singh Presentation done by Indira singh
Presentation done by Indira singh
 
HLEG thematic workshop on Measurement of Well Being and Development in Africa...
HLEG thematic workshop on Measurement of Well Being and Development in Africa...HLEG thematic workshop on Measurement of Well Being and Development in Africa...
HLEG thematic workshop on Measurement of Well Being and Development in Africa...
 
Is policy making measuring up? Rethinking how we measure the success of a nation
Is policy making measuring up? Rethinking how we measure the success of a nationIs policy making measuring up? Rethinking how we measure the success of a nation
Is policy making measuring up? Rethinking how we measure the success of a nation
 
Financial Development Report 2008
Financial Development Report 2008Financial Development Report 2008
Financial Development Report 2008
 
Financial Development Report 2008
Financial Development Report 2008Financial Development Report 2008
Financial Development Report 2008
 
National Accounts of Well-being
National Accounts of Well-beingNational Accounts of Well-being
National Accounts of Well-being
 
Lecturenote 1532939641 ch1 note de
Lecturenote 1532939641 ch1 note deLecturenote 1532939641 ch1 note de
Lecturenote 1532939641 ch1 note de
 
Measuring well being and progress brochure
Measuring well being and progress brochureMeasuring well being and progress brochure
Measuring well being and progress brochure
 
Social Progress Index 2014 Executive Summary
Social Progress Index 2014 Executive SummarySocial Progress Index 2014 Executive Summary
Social Progress Index 2014 Executive Summary
 
Inclusive Economy Indicators Exec Summary
Inclusive Economy Indicators Exec SummaryInclusive Economy Indicators Exec Summary
Inclusive Economy Indicators Exec Summary
 
Governance and development
Governance and developmentGovernance and development
Governance and development
 
Social Progress Index 2016 Methodological Report
Social Progress Index 2016 Methodological ReportSocial Progress Index 2016 Methodological Report
Social Progress Index 2016 Methodological Report
 
The inclusive growth and development report
The inclusive growth and development reportThe inclusive growth and development report
The inclusive growth and development report
 
Human Wellbeing definition and measurement show [Autosaved].pptx
Human Wellbeing definition and measurement show [Autosaved].pptxHuman Wellbeing definition and measurement show [Autosaved].pptx
Human Wellbeing definition and measurement show [Autosaved].pptx
 
Costa Rica-highlights
Costa Rica-highlightsCosta Rica-highlights
Costa Rica-highlights
 
The Governance of Inclusive Growth - OECD
The Governance of Inclusive Growth - OECDThe Governance of Inclusive Growth - OECD
The Governance of Inclusive Growth - OECD
 
Economic growth and inequality.
Economic growth and inequality.Economic growth and inequality.
Economic growth and inequality.
 
sminar presentation (2013)
sminar presentation (2013)sminar presentation (2013)
sminar presentation (2013)
 
Impact Investing: Case Study of Accion's Venture Lab
Impact Investing: Case Study of Accion's Venture LabImpact Investing: Case Study of Accion's Venture Lab
Impact Investing: Case Study of Accion's Venture Lab
 

More from hamishbanks

Infographic - Indian Microfinance
Infographic - Indian MicrofinanceInfographic - Indian Microfinance
Infographic - Indian Microfinancehamishbanks
 
Indian Microfinance - Looking Beyond The AP Act and its Devastating Impact on...
Indian Microfinance - Looking Beyond The AP Act and its Devastating Impact on...Indian Microfinance - Looking Beyond The AP Act and its Devastating Impact on...
Indian Microfinance - Looking Beyond The AP Act and its Devastating Impact on...hamishbanks
 
French - 2011 Africa Awards for Entrepreneurship
French - 2011 Africa Awards for EntrepreneurshipFrench - 2011 Africa Awards for Entrepreneurship
French - 2011 Africa Awards for Entrepreneurshiphamishbanks
 
Arabic - Africa Awards for Entrepreneurship
Arabic - Africa Awards for EntrepreneurshipArabic - Africa Awards for Entrepreneurship
Arabic - Africa Awards for Entrepreneurshiphamishbanks
 
English - 2011 Africa Awards for Entrepreneurship
English - 2011 Africa Awards for EntrepreneurshipEnglish - 2011 Africa Awards for Entrepreneurship
English - 2011 Africa Awards for Entrepreneurshiphamishbanks
 
Report - The Prosperity Index In Africa
Report -  The Prosperity Index In AfricaReport -  The Prosperity Index In Africa
Report - The Prosperity Index In Africahamishbanks
 
Microfinance Crisis at the Bottom of the Pyramid
Microfinance Crisis at the Bottom of the PyramidMicrofinance Crisis at the Bottom of the Pyramid
Microfinance Crisis at the Bottom of the Pyramidhamishbanks
 
2009 Legatum Prosperity Index Summary Report
2009 Legatum  Prosperity Index Summary Report2009 Legatum  Prosperity Index Summary Report
2009 Legatum Prosperity Index Summary Reporthamishbanks
 

More from hamishbanks (8)

Infographic - Indian Microfinance
Infographic - Indian MicrofinanceInfographic - Indian Microfinance
Infographic - Indian Microfinance
 
Indian Microfinance - Looking Beyond The AP Act and its Devastating Impact on...
Indian Microfinance - Looking Beyond The AP Act and its Devastating Impact on...Indian Microfinance - Looking Beyond The AP Act and its Devastating Impact on...
Indian Microfinance - Looking Beyond The AP Act and its Devastating Impact on...
 
French - 2011 Africa Awards for Entrepreneurship
French - 2011 Africa Awards for EntrepreneurshipFrench - 2011 Africa Awards for Entrepreneurship
French - 2011 Africa Awards for Entrepreneurship
 
Arabic - Africa Awards for Entrepreneurship
Arabic - Africa Awards for EntrepreneurshipArabic - Africa Awards for Entrepreneurship
Arabic - Africa Awards for Entrepreneurship
 
English - 2011 Africa Awards for Entrepreneurship
English - 2011 Africa Awards for EntrepreneurshipEnglish - 2011 Africa Awards for Entrepreneurship
English - 2011 Africa Awards for Entrepreneurship
 
Report - The Prosperity Index In Africa
Report -  The Prosperity Index In AfricaReport -  The Prosperity Index In Africa
Report - The Prosperity Index In Africa
 
Microfinance Crisis at the Bottom of the Pyramid
Microfinance Crisis at the Bottom of the PyramidMicrofinance Crisis at the Bottom of the Pyramid
Microfinance Crisis at the Bottom of the Pyramid
 
2009 Legatum Prosperity Index Summary Report
2009 Legatum  Prosperity Index Summary Report2009 Legatum  Prosperity Index Summary Report
2009 Legatum Prosperity Index Summary Report
 

2008 Legatum Prosperity Index

  • 1. THE 2008 LEGATUM PROSPERITY INDEX TM An Inquiry into Global Wealth and Wellbeing
  • 2. 2 2008 Legatum Prosperity Index © 2008 Legatum Limited. All rights reserved. This document may not be reproduced or transmitted, in whole or in part, by any means or in any media, without the prior written permission of Legatum Limited. The Prosperity Index and its underlying methodologies comprise the exclusive intellectual property of Legatum Limited. “Legatum”, the Legatum logo and “Prosperity Index” are registered or common law trademarks of Legatum Limited. Whilst every care has been taken in the preparation of the report, no responsibility can be taken for any error or omission contained herein.
  • 3. 2008 Legatum Prosperity Index 1 Dear Reader, Welcome to the 2008 Legatum Prosperity Index. This second edition builds on last year’s inaugural publication, with expanded coverage and refined analysis. The Prosperity Index is an inquiry into the nature of prosperity and how it is created. This year, scholars and researchers affiliated with the Legatum Institute have significantly expanded the scope of the Index, investigating prosperity drivers and outcomes in more than 100 countries worldwide, increased from only 50 last year. Africa, particularly, is better represented with 19 countries featured, although collecting data for every single country remains a challenge. We define prosperity holistically to include both material wealth and quality of life. Rather than replicating other measurements that rank countries by their actual levels of material wealth or life satisfaction, the Index produces a ranking based on the conditions that foster prosperity – that is, the factors that promote economic competitiveness and improved liveability in a given country. We refer to these factors as drivers of prosperity and to those that impede prosperity, as restrainers. The Index endeavours to rank countries according to the strength of these drivers and restrainers, not according to simple measures of income and life satisfaction. In this way we hope to contribute to a richer analysis of what promotes prosperity globally. The full details of the Index and its construction are included in the 2008 Prosperity Index Report, together with a comprehensive fold-out table of country rankings inserted at the end of this book. The Report, which also includes original research papers on key topics in prosperity from leading scholars and country profiles for each of the 104 countries in the Index, is available in printed form and on the Legatum Institute website at www.prosperity.com. This Summary and Commentary introduces the findings from the 2008 Index, and provides our interpretation of the results. It describes the personal and policy choices that can increase the prosperity of individuals and nations around the globe. The conclusions we draw in this commentary are based on data research as well as theory, experience, and the lessons of history. While we draw on statistical analysis to support these findings and views, quantitative analysis is limited in its ability to separate the drivers of prosperity from their outcomes, and to disentangle the interactions between related drivers. Simply put, there are limits to what science can tell us about the causes of the prosperity of nations (for a discussion of some of these issues, see the full Prosperity Index Report, available on request). Yet while there are limits to our knowledge, there is still much that we have learned and can learn. While governments by themselves cannot create or mandate prosperity, they can help create an environment that is conducive to entrepreneurship and productive endeavour. Ultimately, it is citizens and their leaders who must choose to take ownership of the solutions that will drive their nation’s long-term prosperity, and their personal happiness. We very much hope that you find the 2008 Legatum Prosperity Index of interest, and this commentary engaging and thought-provoking. For Legatum, the quest to understand prosperity is a long-term investigation that we will seek to improve with every edition. We would welcome any comments or feedback that may help improve our understanding. Yours sincerely, PREFACE Dr. William Inboden Senior Vice-President Legatum Institute Alan McCormick Managing Director Legatum www.li.com
  • 4. 2 2008 Legatum Prosperity Index PREFACE 1 EXECUTIVE SUMMARY 6 AN INTRODUCTION TO THE LEGATUM PROSPERITY INDEX 16 THE 2008 COUNTRY STANDINGS 24 PRINCIPLES OF PROSPERITY 30 THE INVESTIGATION CONTINUES 56 GLOSSARY OF KEY TERMS 60 ACADEMIC ADVISORY PANEL 63 LEGATUM PROSPERITY INDEX TABLE 65 TABLE OF CONTENTS
  • 6. 4 2008 Legatum Prosperity Index Mission Statement The purpose of the Prosperity Index is to encourage policymakers, scholars, the media, and the interested public to take a holistic view of prosperity and understand how it is created. Holistic prosperity extends beyond just material wealth, and includes factors such as social capital, health, equality of opportunity, the environment, effective governance, human rights and liberties, and overall quality of life.
  • 7. 2008 Legatum Prosperity Index 5 “...Gross National Product counts air pollution and cigarette advertising, and ambulances to clear our highways of carnage…It counts the destruction of the redwood and the loss of our natural wonder in chaotic sprawl…Yet the Gross National Product does not allow for the health of our children, the quality of their education or the joy of their play. It does not include the beauty of our poetry or the strength of our marriages, the intelligence of our public debate or the integrity of our public officials…it measures everything, in short, except that which makes life worthwhile.” Senator Robert Kennedy
  • 8. 6 2008 Legatum Prosperity Index In a world in which many people are becoming richer, are we also getting happier, healthier, and more fulfilled? What does it mean to become more prosperous, and how does it happen? The Legatum EXECUTIVE SUMMARY
  • 9. 2008 Legatum Prosperity Index 7 Prosperity Index endeavours to suggest answers to these questions and to encourage public discussion about these issues.
  • 10. 8 2008 Legatum Prosperity Index Executive Summary The Prosperity Index is unique in three ways. First, it takes a holistic view of prosperity, encompassing both material wealth and life satisfaction. Second, it assesses the drivers and causes of prosperity, rather than measuring outcomes. Third, it includes factors that relate to government policy and to individual citizens. Constructing the Index The 2008 Legatum Prosperity Index is the result• of an investigation into the various factors that promote prosperity in nations. Recent research advances have made it possible to compare not only the material wealth but also the life satisfaction of people in countries worldwide. Accordingly, we have defined national prosperity as the holistic combination of both of these factors. The overall Index scores and rankings are based• on a weighted combination of indicators that reflect Economic Competitiveness and Comparative Liveability. That is to say, the Index does not rank countries according to which have the most material wealth or the highest levels of happiness at a given time. Rather, it is an index of drivers, which means that countries are ranked by how well they are doing at fostering economic growth and improved quality of life. In other words, how well are nations promoting the practices, habits, policies, and institutions that create enduring prosperity? The indicators that comprise the Index were• identified and weighted based on statistical analysis, using 40 years of historical data on economic growth in more than 50 countries, and life satisfaction survey data for more than 100 countries. The Index combines 22 key indicators and 44• sub-indicators in order to rank more than 100 countries, based on the degree to which the actions of their people and governments drive or restrain the creation of holistic national prosperity, relative to the prosperity of other countries. The Index is presented in a set of publications.• This book summarises the Index results and provides our interpretation of the meaning of the findings. Separately, the Prosperity Index Report describes the methodology and indicators in detail, profiles each of the countries covered in the Index, and presents research and policy papers on key topics in prosperity. For readers interested in more background or in conducting their own investigations, the Technical Appendix in the Report describes the research methodology in detail. All these publications, together with an extensive set of interactive data analysis tools, are available at www.prosperity.com.
  • 11. 2008 Legatum Prosperity Index 9 EXECUTIVE SUMMARY Key Findings The key drivers of economic competitiveness vary according to a country’s level of development. For poorer countries (those with average incomes of less than $10,000 per capita), where increasing material wealth is a particular priority, the most important components of economic competitiveness include: Government Effectiveness• Levels of Education• Growth in Invested Capital• Low Costs of Starting a Business• Commercialisation of Innovation• Low Dependence on Foreign Aid• Low Dependence on Commodity Exports• Economic Openness• For richer countries (those with incomes greater than $20,000 per capita) that wish to experience continued economic growth, the most important components of competitiveness include: Invested Capital• Education• Entrepreneurship• Commercialisation of Innovation• The key factors for promoting life satisfaction also vary according to a country’s level of development. In richer countries, where moving beyond material wealth to broader wellbeing is an important goal, the most important components of liveability include: Continued High Levels of Income• Good Health• Political Rights and Civil Liberties• Freedom of Choice• Charitable Giving• Family Life• Equality of Opportunity• Pleasant Natural Environment• Community Life• Religious Freedom• Many poor countries have surprisingly high levels of wellbeing, because traditional social strengths can compensate, at least somewhat, for low average standards of living. In poor countries, the most important components of comparative liveability include: Family Life• A Warm Climate• Religious Faith•
  • 12. Holistic Prosperity Performance Material Wealth Performance Life Satisfaction Performance Country Performance Rank Legatum Prosperity IndexRank Rank Incomeper Person Rank Survey Average (1-10) Denmark 1 9 6 $31,422 1 7.9 Switzerland 2 7 5 $32,775 3 7.5 Norway 3 14 2 $37,667 8 7.4 United States 3 4 1 $38,165 9 7.4 Netherlands 5 11 7 $31,306 4 7.4 Finland 6 2 10 $30,420 2 7.7 Ireland 7 20 3 $36,238 13 7.2 Sweden 8 12 11 $30,392 6 7.4 Australia 9 1 9 $30,678 10 7.3 Canada 9 14 12 $30,278 7 7.4 Austria 11 2 8 $30,736 16 7.1 Belgium 12 14 14 $30,004 12 7.3 New Zealand 13 9 23 $23,109 5 7.4 United Kingdom 14 14 13 $30,237 18 6.9 France 15 14 15 $28,877 20 6.8 Spain 16 22 21 $24,681 15 7.1 Singapore 17 4 16 $28,305 23 6.6 Israel 18 19 25 $22,662 17 7.0 Italy 18 25 20 $26,496 22 6.7 Germany 20 4 18 $27,438 25 6.5 United Arab Emirates 21 28 24 $22,698 21 6.7 Japan 22 13 17 $27,992 30 6.4 Saudi Arabia 23 45 34 $14,769 14 7.2 Taiwan 24 21 19 $26,826 34 6.2 Czech Republic 25 23 29 $19,700 28 6.5 Greece 25 34 26 $21,675 31 6.3 Hong Kong 25 8 4 $32,901 53 5.5 Costa Rica 28 38 47 $9,646 11 7.3 Kuwait 29 30 22 $23,416 37 6.0 Argentina 30 31 37 $13,652 32 6.2 Mexico 30 43 45 $9,967 24 6.5 The Prosperity Index is an index of drivers. That is, it assesses which countries’ leaders and citizens are doing the most to actively foster or promote holistic national prosperity. But what about outcomes? Which countries actually achieve the greatest prosperity performance – that is, the highest incomes and highest levels of life satisfaction? And to what extent do high Prosperity Index scores correlate with these actual prosperity outcomes? As one might expect, because the factors in the Index are based on analysis of historical data, the link between drivers and outcomes is strong. In statistical terms, the correlation is higher than 0.85 both between countries’ ranks on the Competitiveness Index and their actual per capita incomes, and between their ranks on the Liveability Index and actual average national life satisfaction survey results in the Gallup World Poll. There are a few countries in which performance differs notably from what the Prosperity Index predicts. Singapore, Germany, Hong Kong, Norway and Ireland are the countries in the top ranks of the Prosperity Index where significant differences appear. Most of these differences are on the material wealth side. Based on their Prosperity Index scores, we would expect Germany, Singapore and Ireland to be even wealthier than they are. In Germany’s case this may reflect the long slowdown that followed reunification, while in Singapore and Ireland it may reflect a late start in growth. Norway, by contrast, is predicted by the Index to be less wealthy than it actually is. In the Index, Norway scores poorly on entrepreneurship and some innovation indicators. Yet these areas of apparent weakness do not appear to have reduced the country’s economic performance, which is among the world’s best. This owes in part to Norway’s proven ability to mitigate natural resource dependence by responsibly investing its oil revenues in ways that foster growth and impressive levels of wellbeing. But perhaps the most surprising case is Hong Kong. Despite extremely high levels of development, and generally good quality of life indicators, Hong Kong registers very low life satisfaction results that are difficult to explain. The top 30 countries, ranked by holistic prosperity performance (taking the average of the ranking on income and life satisfaction) are shown below. The full details of countries’ performance are available at www.prosperity.com. PROSPERITY PERFORMANCE: HOW DO DRIVERS COMPARE WITH OUTCOMES?
  • 13. 2008 Legatum Prosperity Index 11 EXECUTIVE SUMMARY Many Asian countries score very well on the wealth indicators, but have weaknesses in wellbeing, including limited equality of opportunity for women, a degraded natural environment, and long working hours. The Rankings The top spot in the Index is claimed by• Australia, followed by Austria and Finland in a tie for second place. These are followed closely by Germany, Singapore, and the United States, also in a tie. While there are limits to what statistical analysis can tell us about the relative importance of indicators that are often highly interrelated, each of these countries registers high scores on nearly every indicator and outstanding scores on a few indicators. Australia makes a particular virtue of• entrepreneurship as a source of material wealth, as well as pursuing broader societal wellbeing through high levels of volunteering and charitable giving. Austria turns in top scores in education, a key to long-term income growth, and also in health, a key to quality of life. Finland boasts superb governance, helping to drive both wealth and wellbeing in that country. This group of countries tops the Index• because of imbalanced results from other regions. Many Asian countries score very well on the economic competitiveness indicators, but have comparative weaknesses in liveability, including limited equality of opportunity for women, a degraded natural environment, and long working hours. In contrast, most Nordic countries score very well on liveability indicators, but poorly on some wealth drivers, most notably entrepreneurship. While no country has poor scores in every• category, Yemen comes closest. While its people maintain a strong religious faith, they also suffer from extreme levels of poverty and poor governance. For most of the countries in the bottom ranks of the Index, extreme poverty appears to be the main cause. This usually has further wellbeing impacts by contributing to ill health and unemployment. A number of countries, such as Zimbabwe and Sudan, are both impoverished and politically repressive.
  • 14. 12 2008 Legatum Prosperity Index PRINCIPLES OF PROSPERITY The results of the 2008 Prosperity Index research highlight a number of general principles relevant to the promotion of national prosperity. These include: Freedom of choice is crucial.1. Whether people have freedom of choice and control over how they direct their lives and spend their time and resources is a strong determinant of life satisfaction and productivity. Government should be effective, honest and2. limited. Governments that exercise power responsibly and are accountable to their citizens dominate the top quartile of the rankings for both competitiveness and liveability. For poorer countries, raising incomes is a top3. priority. For countries with an income per person of less than US $10,000 on average, income levels are the single strongest predictor of how happy that country’s people will be. For richer countries, wellbeing means more than4. just money. For most people in rich countries, non-material drivers tend to have a bigger impact on their life satisfaction than increases in income.
  • 15. 2008 Legatum Prosperity Index 13 EXECUTIVE SUMMARY Entrepreneurship is a promising path to material5. wealth. Entrepreneurship indicators show a significant statistical relationship with long-term economic growth in both rich and poor countries. Growth in invested capital is crucial to long-term6. economic growth. Investment by the private sector (e.g. in factories, offices and production machinery) is one of the most important drivers of material wealth, for both rich and poor countries. Economic openness can help poorer countries7. catch up faster. Open economies in which foreign direct investment and international trade play larger roles have higher long-term growth rates. Economic openness enables countries to absorb foreign capital, technologies, skills and business techniques. However, poor countries that depend heavily on commodity exports, such as oil and gas, often have lower long-term growth rates. Economic openness enables countries to absorb foreign capital, technologies, skills and business techniques. Climate and the environment impact our8. happiness. Several indicators of climate and the environment, including temperature extremes, land area devoted to nature, and perceived air quality, show a significant relationship with average national life satisfaction. Develop your gift and then give it away.9. Countries where charitable giving and volunteering are common report higher average levels of wellbeing. Geography is not destiny.10. Advances in medical science and productive technology are now available worldwide. The top 30 countries in the Prosperity Index include not only countries from Western Europe and North America but also Asia, Eastern Europe, and the Middle East. Governments and citizens each have a role in11. building the prosperity of nations. The 2008 Prosperity Index includes factors driven by individual choice (such as volunteering and charitable giving), factors driven by the choices of policymakers (such as economic openness and good governance), and factors influenced by both, such as health.
  • 16. A FASCINATION WITH HAPPINESS While the pursuit of happiness has long been of interest to individuals, in recent years it has become a priority for many political leaders worldwide. The UK government appointed Lord Richard Layard, an academic at the London School of Economics, as “happiness tsar”, with responsibility for advising on policies to improve wellbeing in Britain. The President of India, Pratibha Patil, announced the creation of a Prosperity Index specifically for her country, measuring quality of life. And French President Nicolas Sarkozy announced that a panel of eminent scholars, led by Nobel Laureates Joseph Stiglitz and Amartya Sen, would develop new economic indicators that would assess wellbeing in France. Why this sudden interest in happiness from some very serious-minded people? Happiness itself has been an aspiration from the advent of humanity and it has been studied for some time. What is new is the “science of happiness” – new methodologies taking advantage of brain scans and large-scale survey research to assess human wellbeing with quantitative methods. As a result, the study of happiness is now not only of interest to philosophers and psychologists but also to economists and political scientists. The field now attracts attention from well-known scholars including Robert Putnam of Harvard and Nobel Laureate Daniel Kahneman of Princeton. And thus, in the past few years, wellbeing research has entered the mainstream. The New York Times reported on new data linking income and happiness, and The Independent on the unhappiness of Great Britain. The Wall Street Journal carried stories on Bhutan’s happiness policies, the Canberra Times on wellbeing in Australia, and the Los Angeles Times on declining quality of life in the US. Newspapers in countries from Singapore and India to the UK and Canada covered the release of the 2007 Legatum Prosperity Index. In short, it appears our fascination with happiness will not abate any time soon.
  • 17. References to “Happiness” over the years The graph below, also produced by Google Trends, shows the volume of book and news references to specific years in conjunction with the term “happiness”. Aside from the current boom, spikes occur in 1776, when the US Declaration of Independence asserted the “pursuit of happiness” as an inalienable right, and in 1238, the date of the founding of the Sukhothai (“Dawn of Happiness”) kingdom in Thailand. Volume of searches for “Happiness” on Google The graph below, produced by Google Trends, shows the near-doubling in search volume for the term “happiness” over the past four years. The temporary spike in late 2006 anticipates the January 2007 release of the movie, “The Pursuit of Happyness”, starring Will Smith. 0 0.5 1 1.5 2 2.5 Jan42004 Apr252004 Aug152004 Dec52004 Mar272005 Jul172005 Nov62005 Feb262006 Jun182006 Oct82006 Jan282007 May202007 Sep92007 Dec302007 Apr202008 Years Volume
  • 18. 16 2008 Legatum Prosperity Index In 2008, there remains a great divergence among nations in both the material wealth and life satisfaction of their citizens. The people of the Netherlands earn US $30,000 per year on average, almost 30 times more than citizens of Nigeria who survive on only US $1,100. AN INTRODUCTION TOTHE LEGATUM PROSPERITY INDEX
  • 19. 2008 Legatum Prosperity Index 17 The citizens of Costa Rica report themselves very satisfied with their lives, while those of Zimbabwe, on average, report themselves very dissatisfied.
  • 20. In 2008, new research resulted in the addition of several new indicators to the Index. A few of these are highlighted below. Each of these indicators, as with all those in the Index, shows a statistical link with either long-term economic growth or average levels of life satisfaction. For the full list, visit www.prosperity.com. The Number of Regional Trade Agreements Signed shows a strong link with economic growth, particularly in poor countries. While some observers dispute the impact of these agreements on global trade flows, for individual countries, this indicator may reflect a government’s level of interest and effectiveness in pursuing outward- oriented economic development. The Business Ownership Rate shows a strong link to income growth, particularly in rich countries, and is an indicator of entrepreneurship (see Principle of Prosperity 4, page 37). Researchers in R&D per Capita assesses a country’s capacity to innovate in a business context, as well as reflecting the general quality of higher education and human capital in the workforce. “Can people who work hard get ahead in this country?” is a question on the Gallup World Poll. While answers to this question doubtless reflect individual beliefs, on a national-average basis this indicator seems to reflect the degree to which opportunities for advancement are widely available in society according to individual merit and initiative, rather than being confined to a privileged elite. Net Migration measures the degree to which people leave a country, fleeing poor conditions or in search of opportunity elsewhere. Data suggest that individuals tend to emigrate from countries where incomes, levels of life satisfaction, or life expectancies are low, and to countries where incomes are high. Ecosystem Services per Capita is an innovative measure of the value of nature in a country, such as lakes, rivers, wetlands, forests and grasslands. Based on satellite photographs, scientists are able to measure the proportion of a country’s land area remaining in a natural state (see Principle of Prosperity 8, page 47). Charitable Giving and Volunteering are both assessed by the Gallup World Poll, and show a strong statistical relationship with life satisfaction (see Principle of Prosperity 9, page 49). NEW FACTORS IN THE 2008 PROSPERITY INDEX
  • 21. 2008 Legatum Prosperity Index 19 AN INTRODUCTION TO THE LEGATUM PROSPERITY INDEX traditionally measured. At the same time, they pursue broader wellbeing, in areas such as health, leisure time, family life, the environment and social capital (for a comparison of drivers and performance, see the callout, Prosperity Performance on page 10). The Index is produced using a quantitative• approach. The Index includes only factors for which a statistical link with material wealth or life satisfaction can be shown. The Index is produced in the spirit of “progress• not perfection”. Our understanding of the drivers of prosperity increases each year, as new data and techniques become available. This Index reflects this progress, and in years to come it will continue to change to reflect advances in knowledge. The 2008 Index also improves on last year’s Index in a number of ways. Hence, readers of this Summary and Commentary will find there is much that is new. Citizens of the top countries pursue broader wellbeing, in areas such as health, leisure time, family life, the environment and social capital. In 2007, the Legatum Institute published the first results of an investigation into the drivers and restrainers of prosperity in nations, in a report and website accompanying the 2007 Prosperity Index. This year, the Institute has sponsored further research, leading to new lines of inquiry and new findings. The guiding principles of the 2008 Prosperity Index remain unchanged from the previous edition: The Index takes a holistic view of prosperity.• This means a view that extends beyond just material wealth, and includes other factors such as social capital, health, the environment, political liberty, and overall quality of life. Operationally, holistic prosperity is defined• as the combination of two widely-available statistical measures: material wealth, measured by long-term growth in average income per person, and life satisfaction, measured by average levels of life satisfaction as reported on national surveys (see the callout, A Fascination with Happiness on page 14). The Index is an index of drivers, not results.• The top countries in the Index are not necessarily those that achieve the highest outcomes in material wealth and life satisfaction. Rather, the top countries are those that have, relative to their peers, the most factors that promote wealth and wellbeing. This is why countries are ranked based on a weighted average of indicators of Economic Competitiveness (drivers of differences between countries’ relative levels of material wealth) and Comparative Liveability (drivers of differences between countries’ relative levels of life satisfaction). Citizens of the top countries in the Index pursue wealth, the yardstick by which prosperity has been What are the reasons for disparities between countries? How can these disparities be remedied? And how can countries that have achieved high levels of material wealth today broaden their success to include a good quality of life?
  • 22. The Legatum Institute was active in promoting new research into prosperity in 2008. The Institute sponsored research by Harvard University’s Robert Putnam on religion and wellbeing, research by Ruut Veenhoven of Erasmus University in the Netherlands on freedom and wellbeing, and an interdisciplinary academic symposium on topics in prosperity in which more than 20 leading scholars participated. The Institute also commissioned three research and policy papers on key issues in prosperity, the full text of which is available in the 2008 Prosperity Index Report, as well as online at www.prosperity.com. “Entrepreneurship and Economic Growth”, by David Audretsch Audretsch, the Director of the Max Planck Institute of Economics in Jena, Germany, and the Ameritech Chair of Economic Development at Indiana University, offers new thinking on the link between entrepreneurship and economic growth. He explains why policymakers lost interest in entrepreneurship during the postwar period and argues that entrepreneurship is now central to economic progress. “Entrepreneurship provides an important mechanism that actually transforms investments in knowledge, ideas and creativity, into innovative activity”, he writes. “Happiness and Charity”, by Arthur Brooks Arthur Brooks is the Louis A. Bantle Professor of Business and Government Policy at Syracuse University and the author of a new book, Gross National Happiness: Why Happiness Matters for America – and How We Can Get More of It. He offers an engaging survey of new research – including his own – that links charitable giving and life satisfaction. He contends that “the evidence is clear that gifts of money – as well as gifts of time – to charitable organisations, houses of worship, and other worthy causes, bring authentic happiness to givers”. “The Role of Freedom and Control in Explaining Happiness”, by Paolo Verme Paolo Verme is a professional development economist and is a contract Professor of Economics at the University of Turin and at Bocconi University in Milan. He analyses the World Values Survey data in detail, finding a surprisingly robust link between freedom of choice and wellbeing in more than 80 countries worldwide. He suggests a theoretical explanation for this link and speculates on possible policy implications. “Public policies which focus on other institutional aspects such as marriage, religion or political orientation may not be so powerful in delivering happiness as they may have negative effects on freedom and control and, through this variable, reduce the positive effect that these factors have on happiness”, he suggests. SUPPORTING NEW RESEARCH: EXPANDING OUR UNDERSTANDING OF PROSPERITY
  • 23. 2008 Legatum Prosperity Index 21 AN INTRODUCTION TO THE LEGATUM PROSPERITY INDEX Based on new statistical research, the Index• uses a much wider range of indicators. This year the Index employs 16 drivers that show a strong statistical relationship with differences in countries’ relative levels of material wealth (indicators of Competitiveness), and 28 drivers that show a strong statistical relationship with differences in countries’ relative levels of life satisfaction (indicators of Liveability). For a description of some of the new indicators in the Index, see the callout, New Factors on page 18. The Index includes a new weighting• methodology, which assesses how the drivers of prosperity change as countries become wealthier (see the callout, What Explains Differences in National Prosperity? on page 22). We encourage readers with an interest in this area to review the research for themselves, in the full Index Report available to download at www.prosperity.com, and to take advantage of the extensive online tools for analysis available on the website. In what follows, we provide our own interpretation of the Index research and results. In the study of prosperity, many findings remain contested and imprecise. But in the lives of people and the policies of nations, decisions must be made on imperfect information. This book presents our views on the 2008 Prosperity Index results and the individual and policy choices that can best promote global prosperity. In addition to this commentary, the Legatum• Institute has published a full report on the research that produced the Index, covering methodology, related academic literature, results and data sources, and full country profiles for the 104 countries in the Index. The full report also includes three research papers by leading scholars on key topics in prosperity: on entrepreneurship by David Audretsch, on charitable giving by Arthur Brooks, and on freedom of choice by Paolo Verme (see the callout, Supporting New Research on page 20). Drawing on the Gallup World Poll and other• new data, the country coverage of the Index has been expanded from 50 countries in 2007 to 104 in 2008. We encourage readers with an interest in this area to review the research for themselves in the full Prosperity Index Report available for download at www.prosperity.com.
  • 24. We assigned weights to the various components of the Index based on the degree to which each component explains why some countries are more prosperous than others. To produce this analysis, we used 40 years of data on economic growth, and data on average life satisfaction for more than 100 countries. We also assessed the ways in which the strength of the relationship between each Index component and national prosperity varies as countries become wealthier. For instance, in poorer countries, basic factors such as governance and foreign aid dependence appear to have a large impact on income growth, whereas in richer countries, high-tech innovation and entrepreneurship unsurprisingly play a much larger role. There are limitations to what statistical analysis can tell us about the drivers of prosperity. In particular, this type of statistical analysis can identify relationships, but cannot determine whether these relationships are causal. The Prosperity Index presents the results of an investigation into the drivers of prosperity, not a precise measurement of these drivers (for more details, see the full Prosperity Index Report). It is important to note that foundational social capital factors such as family, friends, faith, and health, all of which are strong determinants of human happiness, are generated and experienced by individuals, not entire countries. In other words, it is individual people who are WHAT EXPLAINS DIFFERENCES IN NATIONAL PROSPERITY? Commercialising Innovation Entrepreneurship Dependence Economic Openness 1 2 3 4 5 6 7 8 9 10 11 12 13 14 15 16 17 18 19 20 21 22 23 24 25 26 27 28 29 30 31 32 33 34 35 36 37 38 0 Income (USD equivalence in thousands) 0% 20% 40% 60% 80% 100% Better Education Competitive Markets Good Governance Invested Capital ImportanceforMaterialWealth Economic Competitiveness Weights The graph below shows the relative weights of the factors in the Economic Competitiveness Index and how these weights change as countries become wealthier. The width of each bar indicates the factor’s weight, as a percentage of a total Index score. Generally, the weights do not change significantly. That is to say, the fundamental drivers of differences in long-term economic growth rates amongst rich countries are similar to those of poor countries. Two notable exceptions are governance and dependence on commodity exports, which are problems for poor countries but not rich countries. By contrast, the importance of innovation rises markedly as countries become wealthier.
  • 25. happy, not nations. However, since the Prosperity Index assesses prosperity at the national level, it uses national averages of these social capital indicators. While these national averages can reveal interesting comparisons between countries, they do not address the relative salience of social capital factors within countries. Substantial research has demonstrated that for populations within wealthier nations, factors such as family life, friendship, religious engagement, and health are much stronger determinants of individual happiness than income. For an analysis of how each of these factors may impact your individual life satisfaction, visit the Personal Prosperiscope at www.myprosperity.com. 100% 80% 60% 40% 20% 0% 4.0 5.3 6.6 7.9 9.2 10.5 11.8 13.1 14.4 15.7 17.0 18.3 19.6 20.9 22.2 23.5 24.8 26.1 27.4 28.7 30.0 31.3 32.6 33.9 35.2 36.5 37.8 39.1 40.4 41.7 43.0 44.3 45.6 46.9 48.2 49.5 50.8 53.4 54.7 52.1 Income (USD equivalence in thousands) ImportanceforLifeSatisfaction Equality Of Opportunity Climate Leisure HealthFamily Life Community Life Religious Life Environment Income Income (int'l USD) 0% 20% 40% 60% 80% 100% Governance Freedom Of Choice Comparative Liveability Weights The graph below shows the weights of the factors in the Comparative Liveability Index and how these weights, based on national averages, change as countries become wealthier. Unlike the Economic Competitiveness Index, these weights do shift a great deal. Most notably, the weight on income (shown in the small graph, but removed in the large graph) falls dramatically as countries become wealthier, from more than 60% of the total Index weight to less than 20%. At the same time, relative weights on health and especially governance rise significantly. In poor countries, the impact of poverty tends to overwhelm all other drivers of life satisfaction; in rich countries, non-material factors are more important than money (see Principles of Prosperity 4 and 5). Legatum Brochure DPP.indd Sec1:23Legatum Brochure DPP.indd Sec1:23 10/7/08 3:15:31 PM10/7/08 3:15:31 PM
  • 26. 24 2008 Legatum Prosperity Index 2008 COUNTRY STANDINGS Rather than replicating other measurements that rank countries by their actual levels of material wealth or life satisfaction, the Index produces a ranking based on the conditions that foster prosperity.
  • 28. 26 2008 Legatum Prosperity Index The Leaders in Promoting Prosperity The top spot in the 2008 Index is claimed by Australia, followed by Austria and Finland in a tie for second place. These countries are followed closely by Germany, Singapore, and the United States, also in a tie. While there are limits to what a purely quantitative analysis can tell us, as of 2008, these countries appear to have the strongest attributes that promote the holistic prosperity of their citizens. What do the successes of Australia, Austria and Finland suggest? Each nation has a well-rounded set of attributes, scoring well in a very broad range of drivers of prosperity, and outstandingly in a few. Australia makes a particular virtue of entrepreneurship as an engine of economic competitiveness, as well as pursuing broader societal wellbeing as an effective democracy with high levels of citizen volunteering and charitable giving. Austria turns in top scores in education, a key to long-term income growth, and also in health, a key to a country’s liveability. Finland boasts excellent governance, helping to drive both wealth and wellbeing in that country. In addition, the Finns report the greatest satisfaction with their freedom to choose the course of their own lives of any country in the Index. Interestingly, a diverse group of countries – three in Europe, two in Asia, and one in North America – take up the top six spots in the Index, in part because of imbalanced performances by the leading countries in other regions. Several Nordic countries do very well in liveability, but less well in competitiveness. Several Asian countries, on the other hand, have achieved tremendous leaps in income, but do less well in promoting the wellbeing of their citizens. Unbalanced Performers In general, the Nordic countries (Denmark, Sweden and Norway) achieve top scores in the drivers of life satisfaction (and indeed, Denmark currently rates as the “world’s happiest country” – see the callout, Prosperity Performance on page 10). These Nordic countries are rich, highly democratic, scrupulously incorrupt, extremely healthy, enjoy vibrant community life, and their citizens have great personal and political freedom to make choices in determining the course of their own lives. No other region can match the Nordic performance in all of these indicators of liveability. However, at the same time, the Nordic countries lack economic vibrancy. They therefore score relatively poorly on our Index of Economic Competitiveness. The Nordics are capital-rich – particularly Norway, enjoying a boom in oil wealth – and have excellent standards of education. But the Nordic countries score relatively poorly on indicators of innovation, competition in domestic markets, and particularly, on entrepreneurship. Relatively few citizens in these countries choose to go into business for themselves. This lack of entrepreneurial flair suggests the Nordic countries may not be taking full advantage of their citizens’ individual potential, and may also warn of potential constraints on future growth (see the callout, Supporting New Research on page 20). Some Asian countries fall into the opposite category. The Asian leaders (Singapore, Hong Kong, Taiwan, and Japan) take top positions in our Index of Economic Competitiveness. These countries and territories have achieved the fastest income growth of perhaps any on earth, surging from poverty to material prosperity in a single generation. They boast excellent mass education, highly effective and market-oriented regulation, a focus on income growth rather than a THE 2008 COUNTRY STANDINGS
  • 29. 2008 Legatum Prosperity Index 27 THE 2008 COUNTRY STANDINGS dependence on foreign aid, and an ability to engage effectively with the global economy. They particularly excel at taking advantage of the market demand and advanced technologies on offer from the world’s consumers and businesses (although the Asian economies have been most successful at commercialising foreign technologies, and show some weaknesses in generating their own technological innovation). At the same time, while few countries can equal Asia’s long-term economic growth rates, most Asian countries show weaknesses in liveability. Most notable is equality of opportunity. The Gallup World Poll finds that relatively few people in Hong Kong, Singapore, or South Korea report that they agree with the statement that “in this country, people who work hard can get ahead”. This is all the more remarkable considering the high economic growth rates in these countries. Perhaps, however, it is not so remarkable when one considers the level of exclusion of women from leading positions in the economy and politics in Asia. Other weaknesses in liveability common to many countries in Asia include a degraded natural environment and extremely long working hours. Having achieved rapid advances in material wealth, citizens of the leading Asian economies may wish to focus on the drivers of wellbeing.
  • 30. DOWN UNDER IS ON TOP Australia earns the top position in the 2008 Legatum Prosperity Index. The ‘Lucky Country’ has reinvented itself as a wealthy service-oriented economy, and earns its top spot by combining economic competitiveness with good scores on liveability indicators, including health, charitable giving, and effective governance. High levels of capital investment and innovation are key to Australia’s success in terms of material wealth. No doubt this can be partially attributed to policies pursued from the 1970s to the 1990s that deregulated labour and financial markets, controlled public spending and privatised state industries. Australia’s extremely high score on regulatory quality, a component of the World Bank Governance Indicators that measures market-oriented policymaking, reflects this history. Perhaps as a partial consequence of Australia’s wealth, levels of charitable giving in the country are extremely high, according to the Gallup World Poll. This boosts Australia’s liveability score considerably. Although Australia’s indigenous population lives with the adverse effects of socio-economic disparities, the country enjoys good community life scores overall, bolstered by strong norms of civic participation. Australians have one of the highest sport participation rates in the world, and leisure time of over seven hours a day on average, according to Gallup. But leisure time, environmental satisfaction, land area devoted to nature, and air quality – Australia scores well on all of these – are just the icing on the cake. Australia earns its high Index score by getting the fundamentals right. Australians enjoy robust good health, with an average health-adjusted life expectancy of 72.6 years, and the Australian government earns high scores on corruption control and overall effectiveness, supporting the country’s quality of life in many areas. Country profiles are available for all 104 countries in the Prosperity Index at www.prosperity.com. Indicator Score in the Prosperity Index Key score drivers for comparative liveability. The graph below shows the liveability factors with the greatest influence on Australia’s score, after the Prosperity Index weighting scheme has been applied. Control of corruption Charitable giving Government effectiveness Healthy life expectancy Income Research in R&D Patents Quality of regulation Education Capital per worker Indicator Score in the Prosperity Index Key score drivers for economic competitiveness. The graph below shows the competitiveness factors with the greatest influence on Australia’s score, after the Prosperity Index weighting scheme has been applied.
  • 31.
  • 32. 30 2008 Legatum Prosperity Index PRINCIPLES OFPROSPERITY When it comes to prosperity, each country has unique opportunities and challenges. That is even more clear now that surveys such as the Gallup World Poll and World Values Survey enable us to compare the experiences of individuals in more than 100 countries worldwide.
  • 33. 2008 Legatum Prosperity Index 31 Nonetheless, the statistical research presented in the 2008 Prosperity Index Report identifies some clear patterns in the data on global wealth and wellbeing. In what follows, we highlight eleven Principles of Prosperity based on these patterns and suggest some potential implications for individual and policy choices.
  • 34. 32 2008 Legatum Prosperity Index OUR VIEW: Wellbeing in European and North American countries has been studied for decades. In the past few years, however, new surveys such as the Gallup World Poll and World Values Survey have produced high-quality datasets for Africa, the Middle East and Southeast Asia. While some findings vary, there is one factor that appears to have a large impact on wellbeing in nearly every country studied: whether or not individuals perceive that they have freedom of choice and the ability to control the way their lives turn out. In nearly every country, people who report high levels of freedom of choice and control over how their life turns out are happier than those who do not. This is as true in Nigeria as it is in the Netherlands. Furthermore, the countries where people report the highest levels of freedom of choice, notably the United States and New Zealand, followed by Canada, Australia, and Austria, tend to enjoy higher levels of life satisfaction than other countries. Why is this? Freedom of choice implies the existence of opportunity, and the absence of restraint by arbitrary authority. For people of all nations, cultures, income levels, and backgrounds, being free to choose entails having the chance to create better lives for themselves and their families. Freedom of choice in turn is anchored in human dignity and human liberty. Dignity describes the inherent value and sanctity that defines every person; liberty means the capacity to think, speak, and work freely and the creativity to produce, build, and grow freely. Nations that affirm human dignity and liberty equip their citizens with the freedom to choose the best course for their lives and realise their individual potential. Freedom of choice does not mean license to harm. The strong connection between freedom of choice and wellbeing holds only for people making choices to better their own lives, not to 1. FREEDOM OF CHOICE IS CRUCIAL Freedom of choice implies the existence of opportunity, being free to choose entails having the chance to create better lives for themselves and their families. FINDING: There is a robust correlation between perceived freedom of choice and self-reported life satisfaction in nearly every country studied, across regions and income levels.
  • 35. 2008 Legatum Prosperity Index 33 PRINCIPLES OF PROSPERITY The strong connection between freedom of choice and wellbeing holds only for people making choices to better their own lives, not to harm the lives of others. harm the lives of others. Nor does freedom of choice mean that people always choose wisely. Rather, the research shows that people are happiest when they are free to realise the benefits of their good choices – and to learn from the consequences of their bad choices. It has been said that good judgment comes from experience, and experience comes from bad judgment. If government policy, however well-intended, denies people the freedom to learn from their choices, they arguably are also denied the opportunity to gain the experience and wisdom needed for their own personal development. There are many potential impediments to freedom of choice. Poverty, corruption, illness, illiteracy, oppression, excessive regulation, cultural restrictions, and many other factors can all constrain people’s ability to chart their own course. Looking through the country rankings, citizens report the least freedom to choose in places ranging from Algeria to Macedonia to Nepal to Zimbabwe. The reasons vary. Algeria has been afflicted by decades of civil war and terrorist violence; Macedonia suffers from persistent corruption and economic stagnation; Nepal has endemic poverty and political instability; Zimbabwe’s many torments include tyranny and hyperinflation. As different as these nations are, in each of them the people have little chance to choose a better life for themselves. There is almost as much diversity among countries where people are happy with their freedom to choose. Some are wealthy (Norway and Finland), while others are poor yet growing (Vietnam and Ghana). Some are secular (Denmark and Sweden), others are predominantly Christian (Costa Rica and the Philippines), Buddhist (Thailand), or Islamic (Malaysia and the United Arab Emirates). In all of these places, people’s happiness with their freedom to choose bodes well for their futures.
  • 36. COMPARING PROSPERITY IN CHINA, TAIWAN AND HONG KONG Any attempt to compare the rankings of China, Taiwan and Hong Kong is complicated by disparities in geography, population, and history. Nevertheless, some interesting findings emerge. Despite its recent rapid economic growth, mainland China ranks far down the economic competitiveness scale, compared to Taiwan and Hong Kong, because the mainland’s levels of productive capital investment, education, and income remain very low when measured on a per capita basis. On the liveability side, the divergence is also substantial. Taiwan and Hong Kong have political systems that are significantly more free and functional than that of China, with Taiwan leading the group on political rights and Hong Kong leading on control of corruption. On environmental indicators, citizens of the People’s Republic of China – perhaps with lower expectations – report good air quality while Hong Kong has one of the worst air pollution scores in the world (ironically enough, mostly because of pollution emanating from China’s Guangdong Province). On other social indicators, including charitable giving and religious freedom, Hong Kong and Taiwan far exceed the performance of the People’s Republic. All three countries and territories, however, have one thing in common: excellent levels of innovation, or, more accurately, commercialisation of innovation. Many a foreign technology, as anyone who has done business in the region can attest, has been adopted and then improved by local companies. Country OverallRank EconomicCompetitivenessRank ComparativeLiveabilityRank Income CapitalPerWorker SecondaryEducation HighTechExports Patents ControlofCorruption PoliticalRightsandCivilLiberties CleanAir Volunteering CharitableGiving ReligiousFreedom Hong Kong 8 2 19 19 17 3 33 9 15 4 -42 -4 13 7 Taiwan 20 5 36 4 16 6 18 4 7 -20 -4 2 10 China 53 50 58 -5 -6 -5 16 21 -7 -19 9 -17 -13 -21
  • 37. 2008 Legatum Prosperity Index 35 2. GOVERNMENT SHOULD BE EFFECTIVE, HONEST AND LIMITED Although good governance does not create prosperity, it does create an environment in which economic competitiveness and comparative liveability flourish. OUR VIEW: While government does not create prosperity, it does create an environment which will encourage productive endeavour to either flourish or fail. Citizens are most empowered to pursue wealth creation and happiness when their governments maintain basic order, apply impartial justice, respect human rights, and function with transparency and integrity. In contrast, citizens living under oppression, ineptitude, and corruption face severe obstacles to achieving economic growth and life satisfaction. Democratic governance can take many forms and the top ranked countries display a wide diversity of systems. But they have in common a few basic and indispensable characteristics. These include the rule of law, an independent judiciary, respect for human rights and civil liberties, multiple political parties, media freedom, transparency, institutional checks and balances, and rulers who are accountable to their citizens through regular competitive elections. Besides the structure of a government, two other areas are vital for good governance: what a government does – and what it does not do. First, a government should be effective, meaning it provides basic services for its citizens honestly and efficiently. This includes areas such as national security, law enforcement, judicial services, regulations, revenue collection, and border control. Second, a government should be limited, meaning that its power is restrained by its citizens and by law, and that it respects the proper roles of the private sector. Ways that governments exceed their limits include everything from excessive taxation, onerous regulation, and violation of property rights, to abuse of human rights, stifling of civil society, and encroachment on commercial enterprise. In short, governments cannot create prosperity, but do their job best when they respond to the demands of their citizens and foster the conditions for them to create prosperity. Every one of the top 29 countries in the overall Prosperity Index scores half a standard deviation or more above the global mean on good governance. The weightings are equally telling (see the callout, What Explains Differences in National Prosperity? on page 22). At a broad range of income levels, governance is one of the strongest factors – and in some cases the strongest factor – behind economic growth and happiness. Singapore and Hong Kong are the exceptions that prove the rule. These unique city-states are the only two governments in the top quartile that are not fully democratic and accountable to their citizens. Yet they rank very well in other governance areas such as efficiency, effectiveness, rule of law, lack of corruption, and respect for economic liberty. FINDING: Governments that exercise power responsibly and are accountable to their citizens dominate the top quartile of the rankings for both material wealth and life satisfaction. PRINCIPLES OF PROSPERITY
  • 38. 36 2008 Legatum Prosperity Index FINDING: In countries with an average income per person of roughly US $10,000 or less, income levels are the single strongest predictor of how satisfied, on average, people will be with their lives. OUR VIEW: While “money can’t buy happiness”, it is equally true that a lack of money can cause great misery. In rich countries, without exception, people on average report themselves satisfied with their lives. By contrast, in many poor countries, such as Zimbabwe and Pakistan, the stresses of hunger, poor housing, and physical insecurity appear to be so overwhelming that large numbers of people report themselves dissatisfied with the lives they lead. This suggests that for countries at the lower end of the income scale, raising incomes via long-term economic growth should be among the top priorities. To be sure, poor countries have strengths in many other areas. The highest scores on many of the liveability indicators in the 2008 Prosperity Index are to be found in the developing world. Countries including Peru, Bolivia and Kenya have the most favourable climates (measured via a temperature average that has been weighted according to where their populations reside). Wealthy New Zealand leads on the environmental indicators in the Index, but developing Botswana is close behind. Panama and Colombia are ranked highest on family life, with divorce and widowhood relatively rare and most people reporting they have someone to rely on in times of need, and the Dominican Republic and Venezuela lead in indicators of religious life. Nonetheless, it stands to reason that for the destitute, even the most pleasing natural environment will not produce happiness. This simple observation is borne out by the data. At low levels of income, the pernicious impact of poverty tends to outweigh the positive impacts of the other factors described above. For the poorest countries, raising incomes through economic growth will achieve the greatest wellbeing dividends. And today’s poor countries could well become tomorrow’s prosperity leaders, if they can meet the challenge of preserving their traditional strengths as they climb the prosperity ladder. 3. FOR POOR COUNTRIES, RAISING INCOMES IS THE FIRST PRIORITY
  • 39. 2008 Legatum Prosperity Index 37 OUR VIEW: The “Easterlin Paradox” is one of the earliest and most established findings of academic research on human wellbeing. Identified in 1974 by Richard Easterlin, the “paradox” is that even though more income may appear to produce higher levels of life satisfaction, survey data indicate that rich countries that have become even richer have not become any happier. New data, particularly from the Gallup World Poll, have cast some doubt on this “paradox”. These new data suggest that the relationship between income and life satisfaction continues to hold all the way up the income scale. These new findings have led to an avalanche of recent newspaper headlines to the effect that “money is what matters, after all”. These headlines are overstating the case. The new data show a significant relationship between life satisfaction and income, but nonetheless indicate diminishing returns to additional income. That is to say, the first $10,000 in annual income makes a big difference, providing essentials like food and shelter. The next $10,000 in income matters a bit less. The $10,000 after that matters less still. Because the relationship between income and life satisfaction is logarithmic, each step increase on the life satisfaction scale requires a doubling of income: a person earning $10,000 who earns an additional $10,000 experiences the same boost in life satisfaction as a person earning $100,000 who earns an additional $100,000. Hence at high levels of income, vast sums must be added to make any noticeable difference. The main lessons drawn from Easterlin’s research remain valid: for most people in rich countries, non-material drivers will have a bigger impact on their wellbeing than changes in income (this is just as true when looking at differences between average life satisfaction levels among nations – see the callout, What Explains Differences in National Prosperity? on page 22). Citizens of rich countries may wish to consider the liveability drivers carefully as they evaluate their personal choices. It has long been said that wealth poses a more difficult test of a person’s character than poverty, as wealth offers more choices, for good and for ill, and needs to be managed responsibly. FINDING: Each step increase on the life satisfaction scale is associated with a doubling of per capita national income. For most people in rich countries, non-material factors such as family, community, and faith will have a bigger impact on their wellbeing than further increases in income. 4. FOR RICH COUNTRIES, PROSPERITY MEANS MORE THAN JUST MONEY PRINCIPLES OF PROSPERITY
  • 40. PROSPERITY IN SUB-SAHARAN AFRICA Out of the 15 Sub-Saharan African countries featured in this year’s Index, only three are not ranked in the bottom quartile of prosperity: South Africa (38th), Botswana (45th) and Namibia (55th). These rankings reflect the fundamental and often well-publicised problems of the region. One of these is poverty and capital flight: aside from the three countries mentioned above, a lack of capital investment hampers accumulation of material wealth and low incomes restrain wellbeing. Poor governance, low levels of education, high dependence on foreign aid, chronic unemployment and low average life expectancies are further well-known obstacles to national prosperity in Africa. While governments in Sub-Saharan Africa need to alleviate sources of misery for their citizens, the region maintains comparatively high levels of social support via community and religious life. There are also signs of optimism: notably high proportions of the population believe that working hard will enable them to get ahead. Exceptions are Mali and Zimbabwe, where a lack of equal opportunities goes along with perceptions of restricted individual choice. Dissatisfaction with personal freedom also persists in Sudan, Nigeria and Cameroon, and – perhaps a legacy of the apartheid regime – in South Africa as well. But there are many bright spots. Well- governed Botswana has, over a period of 30 years, achieved one of the fastest rates of income growth in the world (although HIV/AIDS infection rates are extremely high). Namibia is unique in the region in having no severe weaknesses (and one notable strength, equality of opportunity). And South Africa has enjoyed success in enabling individual entrepreneurship by lowering the costs of formalising a business.
  • 41. Economic Competitiveness OverallRank Country Rank Growthininvested capital Goodgovernance Bettereducation Economicopenness Entrepreneurship Foreignaid 38 South Africa 41 -6 5 1 -6 10 4 45 Botswana 54 1 4 -10 -6 7 2 55 Namibia 61 -4 -1 -6 -1 0 -7 86 Ghana 79 -10 -2 -10 -7 -6 -20 94 Nigeria 89 -11 -13 -7 -8 -9 -5 92 Senegal 90 -10 -5 -15 -7 -15 -20 96 Mozambique 91 -11 -6 -19 -5 0 -30 96 Kenya 92 -11 -9 -16 -7 -7 -12 100 Tanzania 93 -11 -6 -17 -6 -7 -26 93 Cameroon 94 -10 -12 -9 -11 -17 -5 99 Zimbabwe 98 -10 -21 -10 -7 0 -15 102 Mali 100 -11 -7 -18 -8 -17 -24 102 Zambia 101 -11 -10 -12 -6 -3 -19 94 Sudan 102 -9 -15 -15 -8 -9 -16 101 Central African Republic 104 -11 -17 -16 -14 -21 -20 Comparative Liveability OverallRank Country Rank Freedomofchoice Equalityof opportunity Goodgovernance Pleasant environment Highincomes Goodhealth Lowunemployment Communitylife Religiousbelief 45 Botswana 38 6 1 5 17 -1 -18 -7 -10 38 South Africa 43 -8 15 5 -4 -2 -13 -16 -4 9 55 Namibia 50 3 11 0 8 -5 -3 6 -7 86 Ghana 85 10 6 1 4 -9 -6 0 8 94 Sudan 86 -13 2 -20 2 -10 2 -8 -3 93 Cameroon 89 -8 -4 -13 6 -10 -21 -20 -3 92 Senegal 92 -2 -6 -2 -10 -10 -6 -40 -2 101 Central African Republic 95 -5 11 -13 10 -10 -9 3 10 99 Zimbabwe 96 -24 -10 -19 0 -10 -18 5 -6 12 96 Kenya 97 -5 3 -4 8 -10 -5 -31 -4 96 Mozambique 98 -6 5 -2 1 -10 -2 -11 -5 94 Nigeria 99 -8 1 -10 -7 -11 -4 5 9 12 102 Zambia 101 -4 8 -6 3 -11 -11 -42 -4 102 Mali 102 -15 -20 2 0 -11 -16 -20 -10 100 Tanzania 104 -1 10 -5 3 -11 -20 6 -7 12
  • 42. In the past decade, strong religious faith has come to be associated by some people with terrorism and violence, as extremist groups have claimed religious justifications for their actions. In the Prosperity Index, however, religious engagement is a positive indicator. Why? A repeated finding of research on the science of happiness is that there is a positive link between religious engagement and wellbeing. For instance, people who report that God is very important in their lives are on average more satisfied with their lives, after accounting for their income, age and other individual characteristics. Research also suggests that religious people’s happiness is less vulnerable to fluctuations in economic and political uncertainty, personal unemployment and income changes. The Prosperity Index identifies similar effects at the country level. A number of highly religious countries are happier, on average, than one might expect based on their standard of living alone. This effect is perhaps most pronounced in Mexico, El Salvador, the Dominican Republic, Indonesia, Venezuela and Nigeria. As this diverse list suggests, this effect can be found in many regions and for many faiths. That said, one must also account for the negative impacts of religious intolerance or extremism. The Prosperity Index does so with another indicator, religious freedom, which also correlates with average national life satisfaction. Countries with high levels of religious faith score well on the Religious Life indicator in the Index, but they achieve top marks only if they have religious freedom as well. FAITH AND HAPPINESS
  • 43. 2008 Legatum Prosperity Index 41 FINDING: Entrepreneurship indicators show a significant statistical relationship with long-term economic growth in both rich and poor countries. 5. ENTREPRENEURSHIP IS A PROMISING PATH TO MATERIAL WEALTH OUR VIEW: In almost any given economy, small businesses are the largest employers. In emerging markets, small businesses often offer the best hope for economic growth and social stability through the creation of worthwhile, sustainable employment. The statistical analysis detailed in the 2008 Prosperity Index Report suggests that entrepreneurship plays multiple roles in growth. In poor countries, it is the cost of starting a business that shows the strongest relationship with income growth. In these countries, a few uncompetitive businesses often dominate economic production. With capital hard to come by and the cost of starting a new business prohibitive, it is extremely difficult to dislodge poorly-performing businesses that have strong political connections. The countries that can overcome this challenge are often those with low barriers to starting businesses. This allows capital to come into the formal sector, where it can be invested productively and pose a serious competitive challenge to more established but under-performing enterprises. In rich countries, by contrast, the entrepreneurship indicator that shows a significant relationship with long-term economic growth is the rate of business ownership. In these countries, the vast majority of the population has entered the formal economy, and attracting capital is less of a problem – provided that regulations are sound and tax rates are low. However, there are reserves of creativity and innovation that are untapped (see the callout, Supporting New Research on page 20). For instance, a university professor may stumble upon a research breakthrough with great commercial implications. However, her university is not the place to commercialise it, and if the idea is sufficiently complex, she will have a hard time convincing a large company to invest in it. In countries that encourage entrepreneurship, however, she can use her idea to start a business that may one day grow to be the next Google. PRINCIPLES OF PROSPERITY
  • 44. WHO’S GOING PLACES? The Economic Competitiveness section of the Index measures achievement: which countries have done the most to increase the wealth of their citizens? But there is also the question of progress: which countries are doing the most to achieve the highest growth rates today, to top the competitiveness rankings tomorrow? To answer this question, we have recalibrated the Economic Competitiveness Index to assess performance over the past five years, and present the results in the table below. Last year the top five were Ireland, Croatia, Portugal, Greece and China. This year the same phenomenon dominates the top ranks: catch-up growth by the newer European Union members, with Slovakia and Bulgaria leading at 1st and 2nd, and Romania close behind at 7th (not shown on the chart). Joining the European Union seems to make the income convergence predicted by economic theory a reality. Like Ireland and Portugal before them, today’s new EU members appear on their way to joining the ranks of the world’s richest countries. By contrast, the phenomenon dominating the bottom five places is insecurity (see the callout, Security and Prosperity on page 48). Several countries, most notably Zimbabwe, have registered actual net destruction of their stocks of physical and human capital. Sierra Leone has also experienced the shock of political instability and war in recent years. More positively, another phenomenon highlighted by these rankings is that of convergence in global incomes. Though predicted by economic theory, historically, this has not occurred: while economic growth has continued in the rich world, in many of the poorest regions, blighted by insecurity or poor governance, the pace of growth has been much slower. The result has been actual divergence of global incomes, and a growing material wealth gap between the richest and poorest nations. While severe problems persist in many countries, the global wealth gap is starting to narrow. China ranks 6th on our “who’s going places” ranking, and India ranks 10th. Recent economic growth rates in these countries tell the same story. Both economies have recently grown faster than almost any country in the rich world. Because these two giant nations are home to more than two billion people, these improvements in competitiveness are bringing about a dramatic lessening of the global wealth gap, and are very good news for global prosperity. Invests productively Commercialises new ideas Avoids dependence Rank Country …viagrowthin investedcapital …viagood governance …viacompetitive markets …viabetter education …viaeconomic openness …by commercialising innovation …via entrepreneurship …oncommodity exports …onforeignaid 1 Slovakia 41 8 0 1 20 4 15 -16 8 2 Bulgaria 39 0 -3 -8 17 0 9 5 8 3 Singapore -10 19 6 -4 47 25 4 -3 7 4 Taiwan -4 8 32 -1 10 19 2 1 8 5 Chile -3 11 9 1 5 0 9 -1 7 100 Ecuador -1 -15 -19 2 -6 -14 -3 -21 -16 101 Central African Republic -6 -18 7 -7 -14 -10 -21 -16 -3 102 Lebanon -12 -7 -12 -8 -5 -7 -14 6 -26 103 Cambodia -11 -13 4 -14 -7 -8 -21 -20 104 Zimbabwe -15 -21 3 -7 -7 -9 0 3 -18
  • 45. 2008 Legatum Prosperity Index 43 FINDING: The factor with the strongest statistical relationship to economic growth is the growth in the value of fixed capital investment (such as factories and machinery) per worker. OUR VIEW: Every country has financial capital, but all too often it is dormant and unproductive. Sometimes it is hidden under the mattresses of the poor, or in their informal homes, because the absence of secure property rights makes it impossible for the poor to put these assets to use (for instance, a squatter without legal title to his or her home cannot mortgage this home to start a small business). Sometimes a country’s financial capital becomes flight capital, which seeks a more stable and welcoming environment in foreign banks or real estate. It is difficult to lure this capital out of its hiding places and back into a country’s economy because productive assets such as factories are high-profile and immobile – easy targets for thieves or unscrupulous government officials. Turning hidden capital into invested capital thus requires a great leap of trust by investors, and this usually only happens in stable business environments offering sound property rights, the impartial application of just laws, and good economic policy. 6. GROWTH IN INVESTED CAPITAL IS CRUCIAL TO LONG-TERM ECONOMIC GROWTH PRINCIPLES OF PROSPERITY
  • 46. The 2008 Prosperity Index analyses aggregate wellbeing in nations. But surely the research on the science of happiness has something to say about the choices we make as individuals – about where to live, whether or when to marry, or how to spend our time? In fact, surveys such as the Gallup World Poll, World Values Survey, US General Social Survey, the European Quality of Life Survey, and the German Socio- economic Panel Survey, have addressed these questions in detail. Some of the relationships identified by scholars analysing these survey results are fascinating. For instance: People living close to a coastline tend• to be happier. Long commuting times may have a• large negative impact on one’s life satisfaction. Long commuting times of one’s partner• also have a negative impact. Parental divorce during childhood• appears to have a negative impact on wellbeing, lasting into adulthood. Women tend to be happier than men.• This research on survey data from hundreds of thousands of people in more than 100 countries worldwide has created a new body of knowledge, often called the “science of happiness”. What can this new science tell you? Use our Personal Prosperiscope to find out. Answer the same survey questions that were used in major research studies on human wellbeing, and the Prosperiscope will tell you what factors may be having the biggest impact on your satisfaction with life. The Personal Prosperiscope is available online at www.myprosperity.com. THE PERSONAL PROSPERISCOPE: MEASURING YOUR HAPPINESS
  • 47. 2008 Legatum Prosperity Index 45 OUR VIEW: Many of the factors in the Prosperity Index have a simple relationship with economic growth. Increases in capital and education contribute directly to the value of physical and human capital and thus directly increase economic output. Poor governance and excessive bureaucracy impose costs on business and thus restrain growth. Foreign investment and trade are different. These factors are measured as a percentage of economic output – that is, based on their relative weight in an economy, not their direct contribution to output. Analysis of these data reveals a strong relationship between the weight of foreign trade and investment and long-term growth. In part, this is because openness helps poorer countries catch up. Exposure to foreign trade and investment enables poor countries to adopt, in a matter of a few years, certain technologies, skills, and business methods that required generations to develop in Western Europe and North America. Foreign direct investment in particular is doubly beneficial: not only does it provide much-needed invested capital (see Principle 6 on page 43), it also facilitates the transfer of advanced skills and technology. Increases in capital and education contribute directly to the value of physical and human capital and thus directly increase economic output. FINDING: Economies in which foreign investment and trade play a greater role grow more rapidly than closed economies. 7. ECONOMIC OPENNESS CAN HELP POORER COUNTRIES CATCH UP FASTER PRINCIPLES OF PROSPERITY
  • 48. MAKING TIME FOR LEISURE Studies of wellbeing survey data have repeatedly found evidence of the importance of “taking it easy”, as the saying goes. For instance, people who say they frequently spend time socialising tend to be happier. One survey, the World Values Survey, covering more than 90,000 people in 84 countries, found that people who considered leisure to be more important than work were significantly more satisfied with their lives than people who thought the opposite. The Prosperity Index considers this issue as well, at the national level. Using data from the Gallup World Poll, the Index indicates that countries where people report they have more hours for leisure each day tend to have higher levels of wellbeing. The Index also tracks average working hours, as reported by national statistical authorities. This shows a more complex relationship with wellbeing: in rich countries, where people can choose between jobs with longer or shorter working hours, shorter workdays are correlated with higher life satisfaction. In poorer countries, however, this relationship is absent or even reversed, presumably because many people are underemployed, and would wish to work more hours if they could. Looking at the countries in the Index, some clear patterns are evident. Working hours are extremely long in even the wealthiest Asian countries, suggesting that one avenue for individuals to improve their wellbeing might be more vacation time, given the lower liveability scores in Asian countries. And citizens in each of the bottom 20 countries in the Comparative Liveability Index report very few leisure hours, which further emphasises the importance of leisure to wellbeing. It seems evident that competitive economies offering their citizens a range of opportunities provide a fruitful environment in which workers can balance work and free time.
  • 49. 2008 Legatum Prosperity Index 47 OUR VIEW: As will be immediately evident to anyone who has moved in search of warmer winters or a stretch of coastline, the environment matters to human happiness. As far as temperature is concerned, research suggests that moderate temperatures are best: a winter that is not too cool, and a summer that is not too hot. As mentioned above, countries like Peru, Bolivia and Kenya have the most favourable climates in this regard. The harshest climates in the Prosperity Index are found in extremely cold Mongolia and extremely hot Kuwait. At first glance, it may appear that these climate statistics are of great interest to individuals, but of little interest to policymakers. However, the results reported in the Prosperity Index suggest that cold climates have a strong negative impact in poor countries but not in rich countries. This makes intuitive sense: in rich countries, people are more able to afford the well-built homes and heating that can take the sting out of a cold winter. This finding suggests that poor, cold countries will receive a “double benefit” from economic progress: not only will rising incomes directly benefit Mongolians, but the negative wellbeing impact of spending harsh winters on the steppe will be reduced. Scholars have suggested that hot climates can hinder economic development, for instance by increasing the prevalence of tropical disease. The Index identifies a negative impact of extreme heat on wellbeing that persists across the income scale. The 2008 Prosperity Index Report also finds a strong impact on life satisfaction of environmental quality indicators including land area devoted to nature and air quality. At the extremes, environmental degradation almost certainly has a severe impact on human wellbeing. The countries in the Index with the worst perceived air quality are Hong Kong, Ukraine, and Russia. Those countries with the smallest land area devoted to nature (on a per-person basis) are Belgium, Singapore, and Taiwan. Those with the greatest dissatisfaction with environmental preservation efforts are Ukraine, Russia, and Macedonia. In these countries, personal choices that prioritise the environment may go a long way towards improving wellbeing. 8. CLIMATE AND THE ENVIRONMENT IMPACT OUR HAPPINESS FINDING: Several indicators of climate and the environment, including temperature extremes, land area devoted to nature, and air quality, show a significant relationship with average national life satisfaction. PRINCIPLES OF PROSPERITY
  • 50. The 2008 Prosperity Index does not include a specific security component, but implicitly, security plays a major role. This is evident from the overall Index rankings. The top twenty countries and territories in the Index are at domestic peace and are politically stable. Some are involved in conflicts overseas (such as the United States and United Kingdom), and some have difficult regional relations (such as Taiwan or Israel). But all are generally able to provide physical security for their citizens. Moreover, consistent with the Prosperity Index’s emphasis on accountable governance, numerous studies have identified the “democratic peace theory” that democratic governments rarely, if ever, go to war with each other. In contrast, many of the bottom twenty countries in the Index face significant security challenges. Zimbabwe and Kenya have recently been gripped by internal violence, Nigeria by ongoing conflict in the Delta, Pakistan by terrorism and instability, and Sudan by ongoing violence in the Darfur region and elsewhere. Paul Collier of Oxford University identifies the “conflict trap” as one of the most pernicious and persistent barriers to economic growth. Insecurity can destroy stocks of physical and especially human capital, both directly and because the most talented and well-educated workers will tend to flee the country, as well as reduce incentives to invest in these fundamental drivers of economic progress. In conflict and even early post-conflict environments, businesses cannot flourish, investors are not welcome, basic services are not provided, and trade shuts down. Men and women are hindered from work, students cannot attend schools, and families and communities cannot thrive where the streets are not safe. Insecurity also appears, unsurprisingly, to undermine people’s feelings that they are able to make free choices and control their lives: on this indicator, Zimbabwe and Pakistan report two of the lowest scores in the Index. Because of its severe negative impact on almost every dimension of wealth and wellbeing, insecurity often is the most urgent challenge to address before progress can be made on other drivers of prosperity. Conversely, security is an indispensable factor in sustaining the virtuous cycle of economic growth, effective governance, social capital, and quality of life. Moreover, prosperous nations that provide security for their own citizens often are able to strengthen the security environment in their region and the world, including through deterrence of potential threats, support for peacekeeping missions, and military partnerships with developing nations. Given the important links between security and prosperity, we hope to explore these issues further in future editions of the Prosperity Index and encourage others to do the same. SECURITY AND PROSPERITY
  • 51. 2008 Legatum Prosperity Index 49 OUR VIEW: The timeless wisdom that “it is better to give than to receive” is backed up by the latest research. A series of studies have found that volunteering and charitable giving raise the wellbeing of not just the recipients of charity, but also of the givers (see the callout, Supporting New Research on page 20). While in wealthy countries additional income produces little measurable gain in life satisfaction, those who choose to give away part of their income tend to report higher levels of personal wellbeing. The 2008 Prosperity Index Report finds similar patterns, but at the societal level. Countries in which people report extremely high levels of volunteering (led by the Central African Republic, New Zealand, the United States, and Ireland), and countries in which a high percentage of people are engaged in charitable giving (led by the Netherlands, the United Kingdom and Switzerland), tend, on average, to report higher levels of life satisfaction than might otherwise be expected. These impacts may come about through the creation of “social capital” (in the 2008 Prosperity Index, indicators of social capital are grouped under the Community Life heading). Volunteering in particular may promote the growth of community organisations that bring citizens into contact with each other and enhance levels of social trust. Of course, the higher average levels of wellbeing in these countries may come about because the people who give or volunteer are themselves happier. Either way, the relationship between giving and wellbeing provides another example of the importance of freedom of choice: choices freely made by individuals to donate their time and income, as opposed to coercive policies of wealth redistribution, have empowered individuals to strengthen their communities and enhance liveability in their home nations. FINDING: There are significant statistical relationships between life satisfaction, charitable giving, and volunteering. Volunteering especially may promote the growth of community organisations that bring citizens into contact with each other and enhance levels of social trust. 9. DEVELOP YOUR GIFT AND THEN GIVE IT AWAY PRINCIPLES OF PROSPERITY
  • 52. PROSPERITY IN THE MIDDLE EAST Given the Middle East’s dominance of international news and its strategic importance, conditions in the region will continue to attract global attention. The Prosperity Index finds that the region is far from monolithic. Middle Eastern countries cover a range of rankings, from Israel, the UAE and Kuwait within the top 30, to Jordan, Tunisia and Saudi Arabia in the top 50, to Egypt lower down and Yemen at the bottom of the Index. To be sure, many Middle Eastern countries do have some things in common. No Arabian Gulf or North African country scores well on political life, chiefly because of a lack of political rights and civil liberties. This indicator of democracy shows an increasingly strong relationship to life satisfaction as countries become wealthier, and is an area needing considerable improvement in the region. However, most Middle Eastern countries score very highly on satisfaction with health, on family life, and on religious faith. Survey data suggest that, together with highly-religious Latin America, the region is home to a disproportionately large number of the world’s faithful. Yet all Middle Eastern countries in the Index, except Israel, score poorly on religious freedom. Predictably, some of the richer Middle Eastern countries report high levels of charitable giving, but also, on the economic side, many countries exhibit dependence on commodity exports (notably oil and gas). A dearth of trade agreements is in part an artefact of severe political tensions in the region. The UAE, one of the highest-ranked Middle Eastern countries, warrants a special mention. One of the emirates, Dubai, has, in particular, moved past dependence on oil exports towards a more diversified economy based on attracting international capital and talent. As a result, the UAE has an extraordinarily high migration and therefore opportunity score, as a global workforce has flocked to the opportunities created by Dubai and its fellow emirates. Economic Competitiveness Comparative Liveability OverallRank Country Rank InvestedCapital GoodGovernance Education Commercialising Innovation CommodityExports Rank FreedomofChoice GoodGovernance Health CommunityLife ReligiousFreedom ReligiousBelief 19 Israel 8 12 8 11 13 7 21 0 7 7 6 3 2 28 United Arab Emirates 39 6 6 -2 6 -23 20 12 1 9 -2 -8 30 Kuwait 35 2 2 18 4 -38 27 2 -1 12 -9 -17 45 Saudi Arabia 62 11 -5 -9 -1 -38 30 -10 -9 8 3 -24 12 49 Tunisia 52 -4 2 -6 -1 52 -2 -4 3 -12 -11 50 Jordan 42 -6 0 12 -6 4 63 -1 -5 8 -12 -17 13 66 Algeria 65 6 -7 -5 -6 -32 67 -19 -9 4 -8 -14 12 67 Egypt 56 -8 -7 -2 -5 1 79 -3 -11 5 -11 -17 12 73 Iran 87 -3 -13 -6 2 -12 55 -12 -12 3 2 -17 11 74 Morocco 77 -7 -3 -11 -7 6 66 -3 -6 4 -4 -6 13 79 Lebanon 82 -5 -6 1 -7 70 -4 -8 1 4 -6 104 Yemen 103 -10 -12 -11 -10 -16 103 -6 -13 -7 -9 -11
  • 53.
  • 54. BHUTAN’S GROSS NATIONAL HAPPINESS The mountainous Kingdom of Bhutan, which famously forbade its citizens access to television until 1999, was the first country on earth to declare the pursuit of Gross National Happiness (GNH) as a policy goal. Other countries, including France, have recently announced plans to develop and prioritise broader wellbeing indicators (see the callout, A Fascination with Happiness on page 14). But Bhutan’s GNH policy is not part of some trendy attempt to capitalise on new wellbeing research. The GNH policy was announced in 1998, although some scholars claim it was established by the Fourth King of Bhutan when he assumed the throne in 1972. Perhaps unsurprisingly, the Bhutanese government has seized on the new science of happiness, and initiated research on GNH indicators. But detailed and reliable data on Bhutan is not available, which prevents its inclusion in the 2008 Prosperity Index. If it did, how might Bhutan fare, and how does the Legatum Prosperity Index compare with the Bhutanese concept of GNH, with its roots in Himalayan Buddhism? Firstly, the CIA World Factbook estimates Bhutanese income per capita at $5,300, which would likely place the country near the bottom of the Prosperity Index. At low levels of income per person, the negative impacts of poverty tend to overwhelm other influences on wellbeing. At least, that is the story told by the global statistical averages on which the Prosperity Index is based – perhaps in the unusual case of Bhutan, wise policy could create good health and housing at low levels of income? It is possible, although infant mortality rates of 52 deaths per 1,000 live births (on par with Cambodia and Zimbabwe, if the numbers are accurate) do cast some doubt on this. Bhutan’s operationalisation of GNH is based on four pillars: equitable and sustainable socio-economic development, preservation and promotion of culture, conservation of the environment, and good governance. Most of these ideas do find strong corollaries in the Prosperity Index. Governance and the environment are included in the Index, and show strong links with wellbeing. Health, also in the Index, is part of Bhutan’s socio-economic development pillar. Finally, preservation of culture, in the Bhutanese context, includes elements of voluntarism and family life, both of which feature strongly in the Index weightings. Is GNH missing anything? That is hard to say. But freedom of choice is an obvious candidate, and the Bhutanese state, despite recent democratisation, seems to take a strong interest in regulating personal activity. And in terms of building income and alleviating poverty, Bhutan seems to be moving slowly – according to the CIA World Factbook, three-fifths of Bhutanese government expenditures are funded by Indian development aid.
  • 55. 2008 Legatum Prosperity Index 53 FINDING: The top 30 countries in the Prosperity Index include not only countries from Western Europe and North America but also Asia, Eastern Europe, and the Middle East. OUR VIEW: It has sometimes been claimed that geography shapes the destiny of nations, and that the modern prosperity of many countries is linked to their locations and natural endowments in the distant past. While such arguments may explain much of human history, in the 21st century, these inheritances can be overcome through smart choices. For example, South Korea and North Korea share a similar geography (not to mention cultures and languages) and yet vastly different destinies. Over a 35-year period, Botswana, a landlocked country in Sub-Saharan Africa, was the fastest-growing economy on earth, on a per capita basis, while neighbouring Zimbabwe has recently suffered one of the world’s worst economic disasters. Modern technology and medicine can break the curse of the tropics: Singapore, which was once plagued by tropical disease and corruption, now tops our Economic Competitiveness Index, and has a stable and effective government. With top countries in the Prosperity Index including the aforementioned Singapore (a tropical country), the United Arab Emirates (an Arab country), the Czech Republic (a former communist country), and Malaysia (a majority- Muslim country), it is fair to say that while geography and history can pose ongoing challenges, they are not destiny. This offers hope to countries in regions blighted by poverty and instability, as well as a lesson to those governments that seek to attribute their countries’ present misfortunes solely to a poor inheritance. 10. GEOGRAPHY IS NOT DESTINY PRINCIPLES OF PROSPERITY
  • 56. HAPPINESS – MORE THAN JUST MONEY? Many of the factors that produce high levels of life satisfaction in countries are the by-products of economic success: richer countries have more money to spend on medical care, faster-growing economies will tend to suffer lower rates of unemployment, and of course, long- term growth produces higher incomes and reduces poverty. There are, however, several factors that are not highly correlated with income but nonetheless strongly impact life satisfaction – most notably Religious Life, Climate, Equality of Opportunity, and Family Life. Hence a few countries that do very well on our Economic Competitiveness Index do relatively badly on our Comparative Liveability Index, and vice versa. There are interesting patterns in the relationship between competitiveness and liveability, as assessed by the Prosperity Index. The top-performing countries (in the upper right quadrant) show some level of balanced pursuit of both wealth and wellbeing. Russia, Mongolia, and several Eastern European countries, by contrast, tend to be comparatively weak on liveability (relative to their levels of competitiveness), with poor scores in social capital, climate, and the environment. Conversely, many Latin American countries tend to be comparatively strong on liveability, with high scores on religious faith and, usually, health. The outlier, Trinidad & Tobago, does not earn its position only by virtue of being an island paradise (although its climate scores are not bad). Rather, it has an extreme negative score on one competitiveness indicator, as 40 percent of its economic output is generated by reliance on oil and gas exports. In the lower left quadrant, some countries have a low rank owing especially to poor liveability scores (e.g., Moldova), others especially to poor competitiveness scores (e.g., Ecuador), while Zimbabwe has an obvious low rank owing to poor scores on both. Both competitive and liveable More competitive than liveable More liveable than competitive Neither competitive nor liveable Competitiveness Liveability Trinidad & Tobago Moldova Ecuador Zimbabwe Mongolia Colombia, Venezuela, Dominican Republic Costa Rica, Saudi Arabia Norway, Sweden, Denmark, Ireland Australia Japan, Germany, Singapore, Hong Kong Estonia, Hungary, Slovakia Russia, Ukraine Plot of Competitiveness and Liveability
  • 57. 2008 Legatum Prosperity Index 55 FINDING: The 2008 Prosperity Index includes both factors driven by individual choice and factors driven by the choices of policymakers. OUR VIEW: In seeking to explain the holistic prosperity of nations, it quickly became apparent that an Index confined to policy indicators, such as political and civil liberties, the unemployment rate, or economic openness, would omit many crucial drivers. It also became apparent that for a number of goals, the choices of citizens might be just as, and perhaps more, effective than government policy in producing favourable outcomes. Is the health problem of obesity best tackled through healthcare policy or citizens choosing to eat better? Is air pollution best tackled by new regulations or public pressure on polluting companies? Is better education best pursued and paid for by parents or government- funded schools? The statistical analysis in the 2008 Prosperity Index avoids judgement on these issues. It simply reports the statistical links between health, pollution, education, and prosperity. Where possible, the Index includes policy indicators as well as indicators of results. The best solutions for tackling each of these issues – especially as regards life satisfaction, a relatively new area of concern - will be tested in years to come. What the 2008 Prosperity Index results do clearly indicate is that both individuals and governments have a role to play. No poorly governed country has achieved high levels of holistic prosperity (see Principle 2 on page 35) since such countries have failed to create the conditions necessary not only for economic progress but also for personal flourishing. And in the countries topping the Index, individual choices on issues such as marriage, charitable giving, and leisure time, have clearly played a major role. 11. GOVERNMENTS AND CITIZENS EACH HAVE A ROLE IN BUILDING THE PROSPERITY OF NATIONS The 2008 Prosperity Index results clearly indicate that both individuals and governments have a role to play. PRINCIPLES OF PROSPERITY
  • 58. 56 2008 Legatum Prosperity Index Our understanding of the determinants of both material wealth and life satisfaction has increased by leaps and bounds but much remains unknown. THE INVESTIGATION CONTINUES