3
• Growth predictionis an estimation of the amount of growth to be expected.
• In orthodontics the term refers to the estimation of amount and direction of growth of
the bones of the craniofacial skeletal and overlying soft tissues.
• Estimation of dentofacial growth must consider the increments, vectors, area, duration
and timing of growth accessions.
• Growth prediction helps the clinician to intercept and correct the malocclusion.
4.
4
Need of Growthpredictors in the craniofacial complex.
Future size of a part:
Relationships of parts:
Timing of events:
Vectors of growth:
Effects of orthodontic therapy on growth:
5.
5
Method of predictinggrowth are given by various authors.
Bjork, in 1969, described three methods for predicting the craniofacial
development
1.Longitudinal method
2. Metric method
3. Structural method
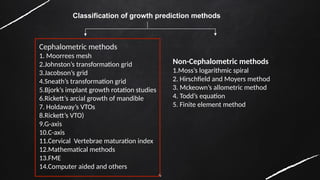
Cephalometric methods
Non-Cephalometric methods
7
PREDICTION OF GROWTHUSING CEPHALOMETRICS:
• Cephalometry was first used as a means to assess the growth and developmental
pattern of children.
• Cephalometric studies provide information on succession of moments and in recording
the longitudinal changes within the same person.
• Two or more cephalometric radiographs taken over a period of 12-14 months gives the
direction in which the face is growing.
• The vectors may be which the face is growing. The vectors may be classified into four
groups :
8.
8
CATEGORY A :
•Vector of maxilla and mandibular growth is downwards and forwards and
is favourable.
• Velocity of growth is favourable.
• Sn – Mp angle is 25* - 35*
CATEGORY B :
• Vector of development is acceptable.
• The magnitude of growth is unfavourable as it is either too great or too
small.
• Sn – Mp angle is 25* - 35*.
CATEGORY C :
• Vector of growth is unfavourable with steep mandibular plane angle.
• High palatal vault : Retrognathic profile and often buccal crossbite.
• Magnitude of growth is favourable
• SN – Mp angle is 40* - 45*.
9.
9
CATEGORY D :
•Patient has unfavourable vector of growth, as well as
• Unfavourable magnitude of growh.
• SN – MP angle is greater than 45*.
• Patient has dolicocephalic pattern, steep mandibular plane angle, open bite features,
crowded max – mand dentition buccal Crossbite and retrognathic profile.
Ricketts (1976) found that Frankfurt horizontal plane was better than the sella – nasion
plane to evaluate various planes of orientation for growth forecasting.
10.
10
LIMITATIONS OF CEPHALOMETRICS:
• It gives the state of an individual at the time the radiograph was taken
and not the dynamic representation.
• It gives only two dimensional picture of a three dimensionally growing
object.
• Growth does not occur along straight lines but it is a combination of
rectilinear and curvilinear patterns.
11.
11
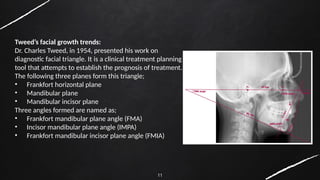
Tweed’s facial growthtrends:
Dr. Charles Tweed, in 1954, presented his work on
diagnostic facial triangle. It is a clinical treatment planning
tool that attempts to establish the prognosis of treatment.
The following three planes form this triangle;
• Frankfort horizontal plane
• Mandibular plane
• Mandibular incisor plane
Three angles formed are named as;
• Frankfort mandibular plane angle (FMA)
• Incisor mandibular plane angle (IMPA)
• Frankfort mandibular incisor plane angle (FMIA)
12.
12
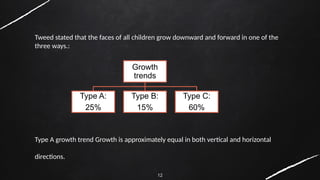
Tweed stated thatthe faces of all children grow downward and forward in one of the
three ways.:
Type A growth trend Growth is approximately equal in both vertical and horizontal
directions.
Growth
trends
Type A:
25%
Type B:
15%
Type C:
60%
13.
13
Type B :
Growthis downward and forward with the middle face
growing forward more rapidly than the lower, as designed by
the increase in ANB angle. If ANB is less than 4◦ , prognosis is
fair and reasonably acceptable facial changes and good
occlusion can be attained with proper and determined
treatment procedures.
Type C :
Lower face is growing downward and forward more rapidly
than the middle face, with a decrease in ANB reading. The
prognosis is excellent for treatment of patient with Type C
growth trend as far as facial esthetics is concerned.
14.
14
Arcial growth:
Ricketts in1972 developed a method to determine the arc of growth of the mandible.
PRINCIPLE: A normal human mandible grows by superior anterior apposition at the ramus on a
curve or arc which is a segment formed from a circle. The radius of this circle is determined by using
the distance from mental protrubence (Pm) to a point at the forking of the stress lines at the
terminus of the oblique ridge on the medial side of the ramus( point Eva)
15.
15
Landmarks :
Xi point-
•The deepest point on the subcoronoid is
selected as R1.
• R2 is selected directly opposite to it on
post border of ramus.
• R3 is selected at the depth of the sigmoid
notch.
• R4 is directly on the lower border of ramus.
• The centroid of the rectangle formed is
called Xi point.
16.
16
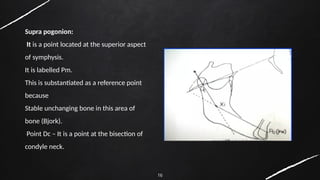
Supra pogonion:
It isa point located at the superior aspect
of symphysis.
It is labelled Pm.
This is substantiated as a reference point
because
Stable unchanging bone in this area of
bone (Bjork).
Point Dc – It is a point at the bisection of
condyle neck.
17.
17
• Point Eva-
Itis a biologic point as it is located over the point of forking of the stress line in the
ramus.
• Ramus reference point (RR) is the point halfway between Xi point and R3 on the
anterior border of ramus.
18.
18
• Construction ofgrowth arc:
• 1.Point RR and R3 are connected.
• Mid point of RR and R3 is pt Eva
• 2.Take pt Eva –Pm as radius circle is drawn
• 1. taking eva as a centre
• 2. taking Pm as a centre.
• The point of intersection is TR (True radius) taking
this as a centre an arc is drawn.
• Where this arc crosses sigmoid notch is called
Murray point.
19.
19
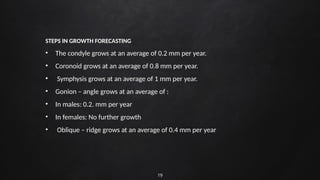
STEPS IN GROWTHFORECASTING
• The condyle grows at an average of 0.2 mm per year.
• Coronoid grows at an average of 0.8 mm per year.
• Symphysis grows at an average of 1 mm per year.
• Gonion – angle grows at an average of :
• In males: 0.2. mm per year
• In females: No further growth
• Oblique – ridge grows at an average of 0.4 mm per year
20.
20
DRAWBACKS OF ARCIALGROWTH PREDICITON
• Rulies heavily on the operators’ skill in tracing the cephalogram. Minor errors could
produce wrong cephalogram. Minor errors could produce wrong prediction.
• Mitchell and Jordan concluded that Ricketts uses the patient’s chronological age rather
than the skeletal age, as he requests for no hand wrist radiographs
• As a average growth increments are added to the age; if the patient has completed
growth or if he is growth spurt or lag phase, it will alter the results.
21.
21
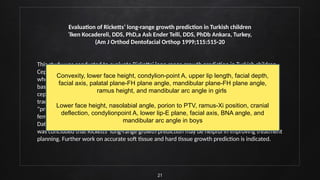
Evaluation of Ricketts’long-range growth prediction in Turkish children
˙lken Kocadereli, DDS, PhD,a Aslı Ender Telli, DDS, PhDb Ankara, Turkey,
(Am J Orthod Dentofacial Orthop 1999;115:515-20
This study was conducted to evaluate Ricketts’ long-range growth prediction in Turkish children.
Cephalometric analysis was conducted at baseline and 7 years for 40 children (20 girls, 20 boys)
who received no orthodontic treatment. Ricketts’ long-range prediction was performed from
baseline cephalograms and compared with actual growth 7 years later. Twenty-one
cephalometric (12 angular and 9 linear) parameters were measured on actual and predicted
tracings. The Pearson correlation coefficient was used to evaluate relationships between the
“predicted” and “actual” measurements. Analysis was conducted on pooled data (males and
females) and data by sex. There was a higher level of correlation for growth prediction in girls.
Data indicate predictability in boys was greater for maxillary mandibular growth parameters. It
was concluded that Ricketts’ long-range growth prediction may be helpful in improving treatment
planning. Further work on accurate soft tissue and hard tissue growth prediction is indicated.
Convexity, lower face height, condylion-point A, upper lip length, facial depth,
facial axis, palatal plane-FH plane angle, mandibular plane-FH plane angle,
ramus height, and mandibular arc angle in girls
Lower face height, nasolabial angle, porion to PTV, ramus-Xi position, cranial
deflection, condylionpoint A, lower lip-E plane, facial axis, BNA angle, and
mandibular arc angle in boys
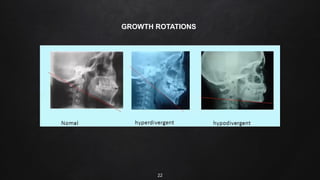
23
Prediction of mandiblegrowth Rotations
Bjork 1969 gave 3 methods to predict growth.
1.Longitudnal – following the course of development in annual x –ray pattern of growth is not
constant
2.Metric- prediction of the facial development on the basis of facial morphology from a single x
ray film.
24.
24
3.Structural- based onthe information concerning the remodelling process of the
mandible during growth gained from implant studies.
Principle- to recognize specific structural feature that develop as a result of
remodelling in a paricular type of mandibular rotation. A prediction of the
subsequent course is then made on assumption that the trend will continue.
25.
25
Mandible may beregarded as an unconstrained bone.
The site of the center of rotation may be located at:
• Anterior ends
• Posterior ends
• Between the ends
26.
26
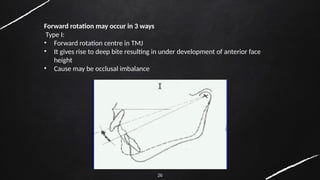
Forward rotation mayoccur in 3 ways
Type I:
• Forward rotation centre in TMJ
• It gives rise to deep bite resulting in under development of anterior face
height
• Cause may be occlusal imbalance
27.
27
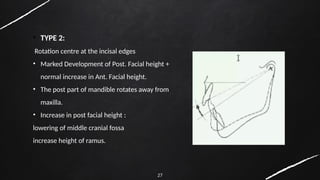
• TYPE 2:
Rotationcentre at the incisal edges
• Marked Development of Post. Facial height +
normal increase in Ant. Facial height.
• The post part of mandible rotates away from
maxilla.
• Increase in post facial height :
lowering of middle cranial fossa
increase height of ramus.
28.
28
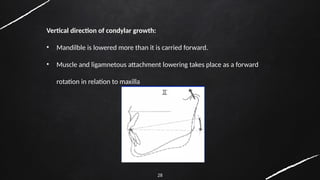
Vertical direction ofcondylar growth:
• Mandilble is lowered more than it is carried forward.
• Muscle and ligamnetous attachment lowering takes place as a forward
rotation in relation to maxilla
29.
29
Type 3: centreat pre molar
• In case of large maxillary overjet the center of rotation is displaced backward
in the arch.to the level of premolars
• AFH – under developed
• PFH - increases.
• Dental arches are pressed into each other and basal deep bite develops.
• In Type II & III the mandibular symphysis swings forward to a marked degree
and the chin becomes prominent.
30.
30
BACKWARD ROTATION OFTHE MANDIBLE
2 types.
TYPE 1: centre of rotation in TMJ
• Backward rotation of the mandible about a center in the joints also
occurs in connection with growth of the cranial base.
• In the case of flattening of the cranial base, the middle cranial
fossae are raised in relation to the anterior one, and then the
mandible is also raised.
• There may be other causes also, such as an incomplete
development in height of the middle cranial fossae
• open-bite as a consequence
31.
31
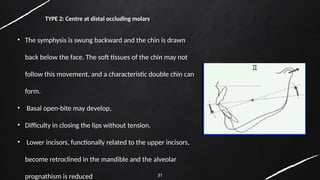
• The symphysisis swung backward and the chin is drawn
back below the face. The soft tissues of the chin may not
follow this movement, and a characteristic double chin can
form.
• Basal open-bite may develop,
• Difficulty in closing the lips without tension.
• Lower incisors, functionally related to the upper incisors,
become retroclined in the mandible and the alveolar
prognathism is reduced
TYPE 2: Centre at distal occluding molars
32.
32
BJORK & RUNEfound a contrast between the positioning of mandible in a longitudinal series
when superimposed on the cranial base and positioning contours resulting from
superimposition on metallic implants. They divided rotations into 3 components.
1. Matrix Rotation
2. Intramatrix rotation
3. Total rotation
33.
33
Matrix Rotation: centrein the condyle
Rotation of bone with its matrix or periosteal capsule in its articulation with
surrounding bone
34.
34
INTRAMATRIX ROTATION :centre in corpus
• Rotation of the mineralized corpus inside the matrix periosteum.
• Surface of bone are remodeled in compensatory fashion
• Matrix retains its stable inclination.
35.
35
TOTAL ROTATION :Combination of the 2 types
• It is rotation of the mandibular corpus measured as a change in the inclination of an
implant line in the mandibular corpus relative to anterior cranial base.
• The position of center of rotation of total rotation is dependent on the other 2
centers of rotation.
36.
36
Structural method ofgrowth prediction :
STRUCTURAL SIGNS OF GROWTH ROTATION
7 structural signs of extreme growth rotation
The greater in number that are present, the more reliable the prediction.
INCLINATION OF CONDYLE HEAD:
Forward or backward inclination of the condylar head
May not be easy to identify on the cephalograms.
37.
37
2) CURVATURE OFMANDIBULAR CANAL:
Forward rotation – curvature of canal is more
Backward rotation - straight mandibular canal
3) SHAPE OF THE LOWER BORDER OF MANDIBLE :
Forward rotation– apposition below the symphysis and anterior part
of mandible
Backward rotation– ant rounding absent thin cortical layer jaw angle
is convex.
38.
38
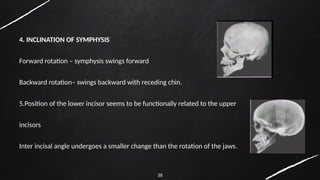
4. INCLINATION OFSYMPHYSIS
Forward rotation – symphysis swings forward
Backward rotation– swings backward with receding chin.
5.Position of the lower incisor seems to be functionally related to the upper
incisors
Inter incisal angle undergoes a smaller change than the rotation of the jaws.
39.
39
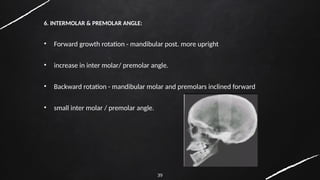
6. INTERMOLAR &PREMOLAR ANGLE:
• Forward growth rotation - mandibular post. more upright
• increase in inter molar/ premolar angle.
• Backward rotation - mandibular molar and premolars inclined forward
• small inter molar / premolar angle.
40.
40
LOWER ANT. FACIALHEIGHT:
Forward growth rotation- decrease in lower AFH
Backward rotation - over development of AFH
41.
41
Thus, from structuralmethod for prediction of rotation B’jork concluded:
• Forward inclination of condyle- ant rotation of the mandible
• Backward inclination- post rotation of the mandible.
42.
42
Clinical significance ofRotation :
• In general, the more extreme the rotation of the mandible during growth, the greater the clinical problems
that it presents.
• Extreme rotation, whether forward or backward, greatly influences the paths of eruption of the teeth and
there is a risk of extreme migration after extractions, thereby secure anchorage is called for.
• Crowding in the mandible results from both directions of growth rotation. In the case of forward rotation,
there is a major risk of deep bite developing which can be prevented by means of a stabilizing appliance, such
‐
as a bite plane, introduced before puberty
43.
43
Johnston method ofgrowth prediction:
• This is a simple method based on the addition of mean
increment by direct superimposing on a printed grid.
• In this regular angular changes in average direction was
shown ie each point advanced 1grid/yr using standard SN
orientation registered at S.
45
• This methodby using the grid produces a moderate flattening of the profile and
occlusal plane as well as a slight mesial drift of M.
• It is not easy to evaluate the significance of the forecasting error.
46.
46
Mesh analysis
• Coenrad.F.A moorrees et al
• The mesh diagram is composed of a grid of rectangular scaled on the pt’s
upper facial height and depth.
47.
47
The face isinscribed in a coordinate system consisting of 24 rectangles.
48.
48
• The lengthand height of mesh rectangle differs among individuals.
• The size increases from 8-16yrs.
• Boys-4.5mm- ht
• Girls- 3.5mm-ht
• Length- 3.2mm in boys
• Length 2.4mm in girls
• Shape of mesh rectangle is determined by shape of the core rectangle.
54
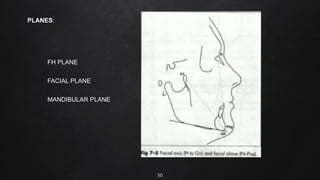
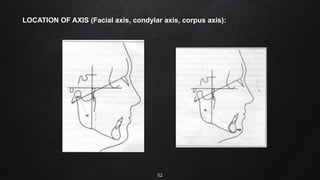
Facial (Depth) angle:
Theangle between the facial plane (N-Pog) and the
frankfort horizontal. This angle provides some
indication of the horizontal position of the chin. It
also suggests whether a skeletal class two or three
pattern is due to the position of the mandible.
On the average, this angle is 87* (at the age of 9 yrs.)
and increases at the rate of 1* for every 3 years. In
adults, this angle is about 90* (average).
55.
55
Mandibular Plane:
Measure anangle to FH. On the average, this
angle is 26* at 9 years of age and reduces
approximately 1* every 3 years. A high or steep
mandibular plane angle, implies that an open
bite may be due to the skeletal morphology of
the mandible. A low mandibular plane suggests
the opposite (i.e. A deep bite).
56.
56
CONVEXITY:
Convexity at PtA:The convexity of the
middle face is measured from point A to
facial plane (N- Pog). The clinical norm at
9 years of age is 2.0 mm and decreases
1* every 5 years. High convexity implies
a class two skeletal pattern. Negative
convexity suggests a class three skeletal
pattern
57.
57
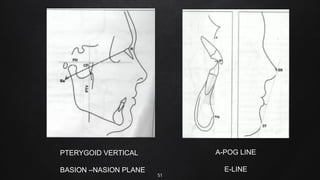
Lower incisor toA-Poq:
The A-Pog line or plane is referred to as the
denture plane and is a useful referance line
from which to measure the position of the
interior teeth. Ideally the lower incisor
should be located 1.0 mm ahead of the A-
Pog line. This measurement is used to
define the protrusion of the lower arch.
58.
58
Upper molar toPtV: This measurement is the
distance from the pterygoid vertical (back to
the maxilla) to the distal of the upper molar.
On the average, this measurement should
equal the age of patient +3.0 mm. (e.g. A
patient 11 years of age has a norm of 11 + 3 =
14 mm).
This measurement assists in determining
whether the malocclusion is due to the
position of the upper or the lower molar. It is
also useful in deciding whether extractions are
necessary.
59.
59
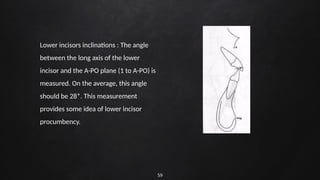
Lower incisors inclinations: The angle
between the long axis of the lower
incisor and the A-PO plane (1 to A-PO) is
measured. On the average, this angle
should be 28*. This measurement
provides some idea of lower incisor
procumbency.
60.
60
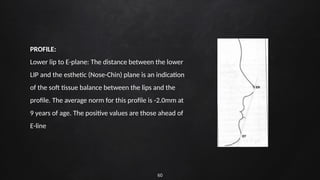
PROFILE:
Lower lip toE-plane: The distance between the lower
LIP and the esthetic (Nose-Chin) plane is an indication
of the soft tissue balance between the lips and the
profile. The average norm for this profile is -2.0mm at
9 years of age. The positive values are those ahead of
E-line
62
Frontal sinus ingrowth prediction:-
• The frontal sinus bud is present at birth in ethmoid region but is not evident radiographically until
the age of 12 years, when they reach nearly adult size.
• Joffe (1964) found that frontal sinus enlargement to be associated with prognathic subjects.
Joffe BM. Frontal sinus enlargement associated with mandibular prognathism. J Dent Assoc S
Afr 1994. 15: 127-29
63.
63
• It wasfound that the main enlargement of
frontal sinus ceased at 15.5 years in boys and
13.75 years in girls, which was very near to
the ages at which the growth increments
reached a plateau in children, suggesting that
the increase in the sinuses follows the trend in
growth in bone lengths very closely.
64.
64
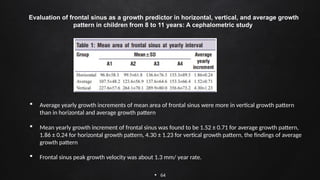
Evaluation offrontal sinus as a growth predictor in horizontal, vertical, and average growth
pattern in children from 8 to 11 years: A cephalometric study
Average yearly growth increments of mean area of frontal sinus were more in vertical growth pattern
than in horizontal and average growth pattern
Mean yearly growth increment of frontal sinus was found to be 1.52 ± 0.71 for average growth pattern,
1.86 ± 0.24 for horizontal growth pattern, 4.30 ± 1.23 for vertical growth pattern, the findings of average
growth pattern
Frontal sinus peak growth velocity was about 1.3 mm/ year rate.
65.
65
Antegonial notch asindicator of growth potential:-
• Singer, Mamandras and Hunter (1987) clearly demonstrated decreased mandibular
growth in deep notch subjects as compared with shallow notched subjects. The frequency
of extraction was three times more in deep notched subjects.
66.
66
• Deep notch(DN) subjects have a more retrusive
mandible, with a sharper corpus, less ramus height, and
a greater gonial angle than did shallow notch (SN)
subjects.
• The mandibular growth direction in DN patterns is more
vertically directed than for SN subjects.
67.
67
When the growthof the mandibular condyle fails to contribute to the lowering of the mandible, the masseter
and the medial pterygoid, by their continued growth, cause the bone in the region of angle to grow
downward, producing antegonial notching.” explains Becker et al.Inference on the association between
pronounced antegonial notching and diminished mandibular growth.
• The DN subjects had longer total facial height and longer lower facial height than did
the SN subjects.
• The DN subjects had a smaller saddle angle than did the SN subjects.
• Notch depth continued to increase in DN subjects, while it decreased only slightly in
SN group.
• The amount of mandibular growth was less in DN sample as compared to SN sample
during the period of study
68.
68
The purpose ofthis study was to compare 3 methodologies that predict facial growth relative to incremental and positional changes
over short- and long-term time periods. The 3 prediction systems that were tested and compared were the Ricketts analysis, the
Johnston grid analysis, and the Fishman maturational analysis.
Methods: Serial lateral cephalometric head films and hand-wrist films of 50 untreated subjects from the Burlington Growth Center at
the University of Toronto, Ontario, Canada, were used. The sample was subdivided by skeletal classification and further subdivided by
sex. The sample comprised 19 skeletal Class I subjects (10 female, 9 male), 20 Class II subjects (10 female, 10 male), and 11 Class III
subjects (6 female, 5 male). Three serial headplates were traced on each subject, and the associated chronologic and maturational ages
were noted. The subjects were divided into a young adolescent subgroup approximately 9 years of age (T1), a midadolescent subgroup
approximately 13 years of age (T2), and a late adolescent-adult age group approximately 20 years of age (T3). Predictions were made
between the time periods. To measure and compare the predicted amounts of downward and forward skeletal growth vs the actual
growth values, anatomic landmarks were chosen in the cranial base and on the maxilla and the mandible (Point A and gnathion), and
increases between the respective points were measured. A paired t test was applied to each test group for the statistical analysis.
Graphic representations were also created in the form of “positional envelopes” that encapsulated the predictive data for each
methodology. To evaluate both incremental and positional accuracy, these data envelopes were subsequently related to the true
positions of Point A and gnathion.
Results and Conclusions: Although not the case in every instance, it was demonstrated that the maturationally oriented Fishman analysis
was superior to both the chronologically based Johnston grid and Ricketts analysis for short- and long-term predictions.
Turchetta BJ, Fishman LS, Subtelny JD. Facial growth prediction: a comparison of methodologies. Am J Orthod
Dentofacial Orthop. 2007;132(4):439-449. doi:10.1016/j.ajodo.2005.10.026
70
REFERENCES:
• PV SAMIR,et. al. “Growth Prediction in Craniofacial Complex & Its Implications in Planning an Orthodontic
Treatment.” IOSR Journal of Dental and Medical Sciences (IOSR-JDMS), 21(09), 2022, pp. 20-30.
• Agarwal V, Tandon R, Singh K, Chandra P, Agarwal S. Growth prediction methods: A review. IP Indian J Orthod
Dentofacial Res 2021;7(2):106-113.
• Jacobson A. Radiographic cephalometry, from basics to video imaging.
• Ricketts RM. A principle of arcial growth of the mandible. AO 1972;42:368-86
• Growth Sridhar Premkumar, Textbook Of growth and Craniofacial Development
• W. J. B. Houston, Mandibular growth rotations—their mechanisms and importance, European Journal of
Orthodontics, Volume 10, Issue 1, February 1988, Pages 369–373, https://doi.org/10.1093/ejo/10.1.369.
#3 The ability to predict the magnitude and direction of a patient’s facial growth early in life would enable the clinician to identify those individual who requires interceptive growth modification and to ensure that the appropriate treatment can be rendered while growth is expected.
#11 When the FMA is between 21° and 29°, the FMIA should be 68°. When the FMA is 30° or greater, the FMIA should be 65°. When the FMA is 20° or less, the IMPA should not exceed 90
Tweed stressed the importance of FMIA angle, and recommended that FMIA should be maintained at 65-70 degrees
#69 Growth prediction is a vital cog for a successful orthodontic treatment in a growing patient. Though there is a slight variability of growth in between individuals, our knowledge of various growth prediction methods can aid us in determining the right time to intervene for a successful orthodontic treatment rather acting blindly on it.