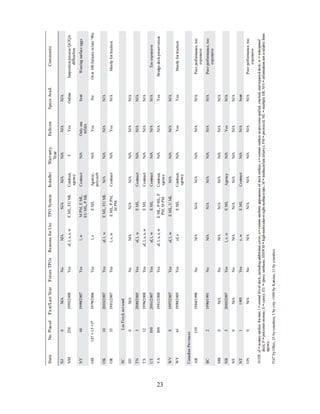
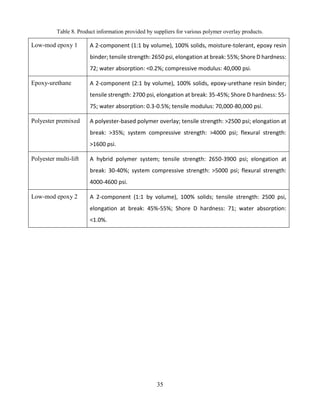
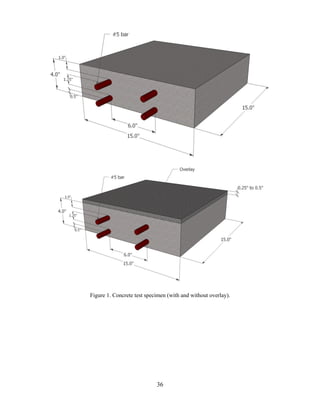
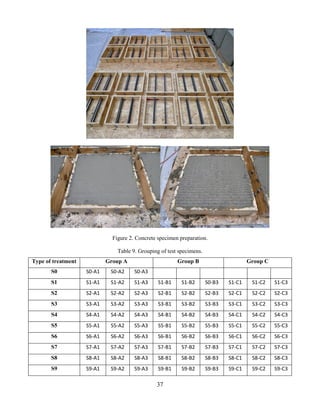
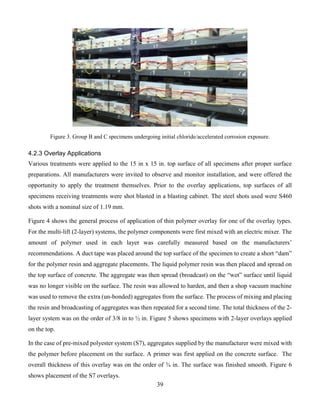
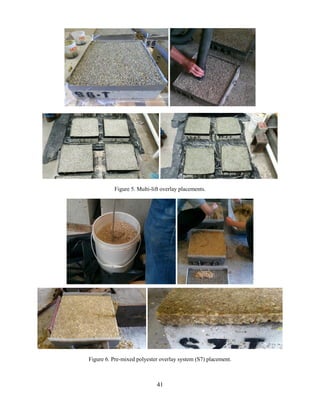
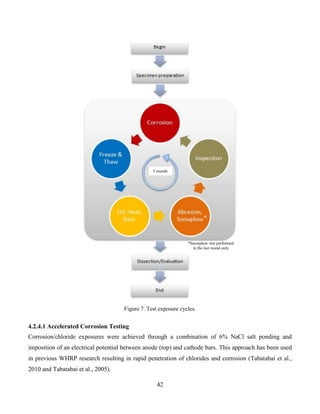
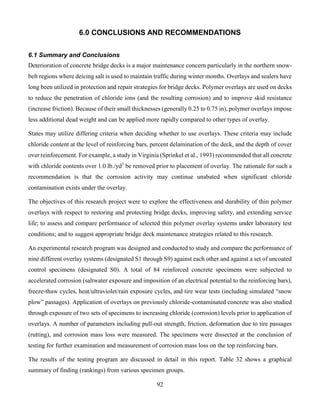
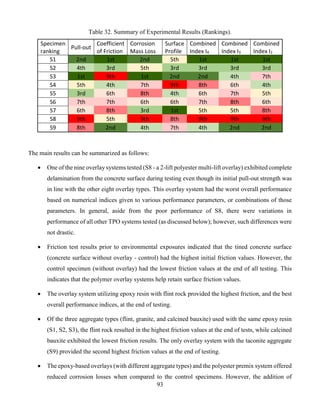
SlideShare a Scribd company logo
See	discussions,	stats,	and	author	profiles	for	this	publication	at:	https://www.researchgate.net/publication/306078312
Evaluation	of	Thin	Polymer	Overlays	for	Bridge
Decks
Technical	Report	·	July	2016
CITATIONS
0
READS
17
6	authors,	including:
Habib	Tabatabai
University	of	Wisconsin	-	Milwaukee
78	PUBLICATIONS			302	CITATIONS			
SEE	PROFILE
Konstantin	Sobolev
University	of	Wisconsin	-	Milwaukee
106	PUBLICATIONS			1,256	CITATIONS			
SEE	PROFILE
Azam	Nabizadeh
University	of	Wisconsin	-	Milwaukee
1	PUBLICATION			0	CITATIONS			
SEE	PROFILE
Available	from:	Habib	Tabatabai
Retrieved	on:	02	September	2016
Evaluation of Thin Polymer Overlays
for Bridge Decks
Habib Tabatabai
Konstantin Sobolev
Al Ghorbanpoor
Azam Nabizadeh
Chin-Wei Lee
Matthias Lind
University of Wisconsin-Milwaukee
WisDOT ID no. 0092-12-06
July 2016
1
DISCLAIMER
This research was funded through the Wisconsin Highway Research Program by the Wisconsin
Department of Transportation and the Federal Highway Administration under Project # 0092-12-06.
The contents of this report reflect the views of the authors who are responsible for the facts and the
accuracy of the data presented herein. The contents do not necessarily reflect the official views of the
Wisconsin Department of Transportation or the Federal Highway Administration at the time of
publication.
This document is disseminated under the sponsorship of the Department of Transportation in the
interest of information exchange. The United States Government assumes no liability for its contents or
use thereof. This report does not constitute a standard, specification, or regulation.
The United States Government does not endorse products or manufacturers. Trade and
manufacturers’ names appear in this report only because they are considered essential to the object of
the document.
2
TECHNICAL REPORT DOCUMENTATION PAGE
1. Report No. 2. Government Accession
No
3. Recipient’s Catalog No
4. Title and Subtitle
Evaluation of Thin Polymer Overlays for Bridge Decks
5. Report Date
July 2016
6. Performing Organization Code
7. Authors
Habib Tabatabai, Konstantin Sobolev, Al Ghorbanpoor, Azam
Nabizadeh, Chin-Wei Lee, and Matthias Lind
8. Performing Organization
Report No.
9. Performing Organization Name and Address
Department of Civil and Environmental Engineering
University of Wisconsin-Milwaukee
3200 North Cramer Street, Milwaukee, WI 53211
10. Work Unit No. (TRAIS)
11. Contract or Grant No.
0092-12-06
12. Sponsoring Agency Name and Address
Wisconsin Department of Transportation
Research & Library Unit
4802 Sheboygan Avenue, Rm 104
Madison, WI 53707
13. Type of Report and Period
Covered
14. Sponsoring Agency Code
15. Supplementary Notes
16. Abstract
Deterioration of concrete bridge decks is a major maintenance concern particularly in the northern snow-belt
regions where deicing salt is used to maintain traffic during winter months. Overlays and sealers have long been
utilized in protection and repair strategies for bridge decks. Polymer overlays are used on decks to reduce the
penetration of chloride ions (and the resulting corrosion) and to improve skid resistance (increase friction). Because
of their small thicknesses (generally 0.25 to 0.75 in), polymer overlays impose less additional dead weight and can
be applied more rapidly compared to other types of overlay. The objectives of this research project were to explore
the effectiveness and durability of thin polymer overlays with respect to restoring and protecting bridge decks,
improving safety, and extending service life; to assess and compare performance of selected thin polymer overlay
systems under laboratory test conditions; and to suggest appropriate bridge deck maintenance strategies related to
this research. An experimental research program was performed to study and compare the performance of nine
different overlay systems. Reinforced concrete slab specimens were subjected to accelerated corrosion, freeze-
thaw cycling, heat/ultraviolet/rain cycles, and tire wear tests (including “snow plow” application). The overlay
system with an epoxy resin and flint rock aggregate provided the best overall performance based on performance
indices determined for friction coefficient, corrosion mass loss, pull-out strength and surface deformation (rut) due
to tire passage. The polyester multi-lift overlay system delaminated from the concrete surface in all nine specimens
utilizing that overlay type. The addition of polymer overlays does not significantly reduce corrosion mass loss in
bridge decks with high levels of chloride contamination. Recommended guidelines for maintenance of bridge
decks are provided.
17. Key Words
Bridge decks, corrosion, friction, overlays, thin
polymer overlay, durability
18. Distribution Statement
No restriction. This document is available to the public
through the National Technical Information Service
5285 Port Royal Road
Springfield VA 22161
19. Security Classif. (of this report)
Unclassified
19. Security Classif. (of this page)
Unclassified
20. No. of Pages
100
21. Price
0092-12-06
3
Table of Contents
ACKNOWLEDGEMENTS........................................................................................................................ 6
DISCLAIMER ............................................................................................................................................ 7
TECHNICAL REPORT DOCUMENTATION PAGE.............................................................................. 8
EXECUTIVE SUMMARY ........................................................................................................................ 9
1.0 INTRODUCTION .............................................................................................................................. 12
1.1 Background..................................................................................................................................... 12
Overlays ............................................................................................................................................ 12
Sealers............................................................................................................................................... 14
1.2 Objectives and Scope...................................................................................................................... 15
2.0 LITERATURE REVIEW ................................................................................................................... 16
3.0 SURVEY RESULTS .......................................................................................................................... 19
3.1 Previous Surveys (by Others) ......................................................................................................... 19
3.2 State Survey Results – This Study.................................................................................................. 26
3.3 Supplier Survey Results – This Study ............................................................................................ 28
3.4 Summary of Survey Results ........................................................................................................... 30
4.MATERIAL SELECTION AND EXPERIMENTAL DESIGN ........................................................... 31
4.1 Material Selection ........................................................................................................................... 31
4.2 Laboratory Testing Procedures....................................................................................................... 32
4.2.1 Test Specimens ........................................................................................................................ 32
4.2.2 Introduction of Initial Chlorides .............................................................................................. 38
4.2.3 Overlay Applications ............................................................................................................... 39
4.2.4 Exposure Rounds ..................................................................................................................... 40
4.2.5 Tests and Measurements.......................................................................................................... 56
4.3 Field Testing ................................................................................................................................... 63
5.0 EXPERIMENTAL RESULTS............................................................................................................ 69
5.1 Pull-Out Test Results...................................................................................................................... 69
5.1.1 Initial (baseline or Round 0) Pull-Out Strength....................................................................... 69
5.1.2 Final Pull-Out Strength............................................................................................................ 70
5.1.3 Discussion of Pull-Out Results................................................................................................ 73
5.2 Friction Test Results ....................................................................................................................... 73
5.2.1 Initial Friction Results.............................................................................................................. 73
5.2.2 Final Friction Results............................................................................................................... 74
5.2.3 Discussion of Friction Results ................................................................................................. 77
5.3 Corrosion Test Results.................................................................................................................... 78
4
5.3.1 Final Corrosion Results............................................................................................................ 78
5.3.3 Discussion of Corrosion Results.............................................................................................. 81
5.4 Surface Profile Results.................................................................................................................... 81
5.4.1 Final Surface Profile Results ................................................................................................... 81
5.4.2 Discussion of Surface Profile Results...................................................................................... 83
5.5 Overall Analysis of Laboratory Results.......................................................................................... 84
5.5.1 Indexed Final Results............................................................................................................... 84
5.5.3 Observations on the Laboratory Test Results .......................................................................... 89
5.6 Field Tests – Initial Friction Results............................................................................................... 91
5.6.1 Initial BPT results .................................................................................................................... 91
5.6.2 Failure of an Overlay System .................................................................................................. 91
6.0 CONCLUSIONS AND RECOMMENDATIONS ............................................................................. 92
6.1 Summary and Conclusions ............................................................................................................. 92
6.2 Recommended Guidelines .............................................................................................................. 95
7.0 REFERENCES ................................................................................................................................... 98
5
List of Figures
Figure 1. Concrete test specimen (with and without overlay). ................................................................. 36
Figure 2. Concrete specimen preparation. ................................................................................................ 37
Figure 3. Group B and C specimens undergoing initial chloride/accelerated corrosion exposure........... 39
Figure 4. Placement of thin polymer overlay on test specimen................................................................ 40
Figure 5. Multi-lift overlay placements. ................................................................................................... 41
Figure 6. Pre-mixed polyester overlay system (S7) placement. ............................................................... 41
Figure 7. Test exposure cycles.................................................................................................................. 42
Figure 8. Accelerated corrosion setup. ..................................................................................................... 44
Figure 9. Accelerated corrosion exposure setup....................................................................................... 45
Figure 10. Automated computer-controlled machine for FT, HURA and wear testing of specimens. .... 46
Figure 11. One of the three carts used for manual FT testing................................................................... 47
Figure 12. FT drawer with specimen placed face-down........................................................................... 48
Figure 13. HURA test cycles: Heat and UV (left), rain and cool down (right)........................................ 49
Figure 14. Manual HURA test box........................................................................................................... 50
Figure 15. Three-Wheel Polishing Device (TWPD) developed by National Center for Asphalt
Technology (NCAT) (Erukulla, 2011). .................................................................................................... 53
Figure 16. UWM-designed wear test device (conceptual drawing). ........................................................ 53
Figure 17. UWM-designed wear test device............................................................................................. 54
Figure 18. Dimension of the “snow plow” using in Round 3 wear test.................................................... 55
Figure 19. “Snow plow” assembly installed between two tires................................................................ 56
Figure 20. British Pendulum Tester used on specimens prior to exposure tests....................................... 57
Figure 21. Friction measuring system for the UWM wear test machine.................................................. 58
Figure 22. Typical friction sensor output.................................................................................................. 58
Figure 23. Coring drill setup..................................................................................................................... 60
Figure 24. Schematic layout of sample coring locations after the end of exposure tests. ........................ 60
Figure 25. Pull-out test device. ................................................................................................................. 61
Figure 26. Measurement of the depth of surface groove (rut) through a dial gage at measurement points
defined using a wooden template.............................................................................................................. 62
Figure 27. Marquette Interchange ramp prior to application of overlays (transverse cracking of the deck
is observed)............................................................................................................................................... 64
Figure 28. Cross section of Marquette Interchange ramp (from WisDOT project drawing). .................. 65
Figure 29. Friction testing using BPT....................................................................................................... 65
Figure 30. Placement of resin and aggregate on a 2-lift overlay system. ................................................. 66
Figure 31. Marquette Interchange ramp after placement of four different thin polymer overlay systems
(A through D)............................................................................................................................................ 66
Figure 32. Four different thin polymer overlay test sections (A, B, C, and D) on the Marquette
Interchange ramp (from WisDOT). .......................................................................................................... 66
Figure 33. Section A drawing (from WisDOT)........................................................................................ 67
Figure 34. Section B drawing (from WisDOT). ....................................................................................... 67
Figure 35. Section C drawing (from WisDOT). ....................................................................................... 68
Figure 36. Section D drawing (from WisDOT)........................................................................................ 68
Figure 37. Average initial pull-out strength (baseline)............................................................................. 70
Figure 38. Average final pull-out strength of all groups. ......................................................................... 72
Figure 39. Pictures of delaminated overlay from a S8 specimen: top surface (left), bottom surface (right).
................................................................................................................................................................... 72
Figure 40. Average final pull-out strength for groups A, B, and C. ......................................................... 73
Figure 41. Initial average coefficients of friction for all groups at Round 0. ........................................... 74
6
Figure 42. Average coefficient of friction for all groups at round 3......................................................... 75
Figure 43. Coefficient of friction for groups A, B, and Cat Round 3....................................................... 76
Figure 44. Average coefficient of friction for all groups at round 0, 1, 2, and 3...................................... 77
Figure 45. Projected coefficients of friction for various overlay types. ................................................... 79
Figure 46. Average corrosion mass loss for all groups............................................................................. 80
Figure 47. Average corrosion mass loss for Groups A, B, and C............................................................. 81
Figure 48. Surface profile average for all groups of overlay types. ......................................................... 83
Figure 49. Average surface profile for groups A, B, and C...................................................................... 83
Figure 50. Overlay Performance Index (I4) - Combined pull-out strength, friction, corrosion, and surface
profile indices............................................................................................................................................ 87
Figure 51. Overlay Performance Index (I3) - Including pull-out strength, friction, and corrosion indices.
................................................................................................................................................................... 88
Figure 52. Overlay Performance Index (I2) - Including pull-out strength, and friction indices. .............. 89
Figure 53. Delaminated multi-lift polyester overlay (from the Marquette Interchange ramp)................. 91
7
List of Tables
Table 1. Summary of Survey Results from NCHRP Synthesis Report 423 (Fowler and Whitney, 2011).
................................................................................................................................................................... 22
Table 2. Reasons for selection of Polymer overlays (Krauss et al., 2009). .............................................. 24
Table 3. Deck conditions that can be addressed by polymer overlays (Krauss et al, 2009)..................... 25
Table 4. Surface preparation techniques in polymer overlays (Krauss et al, 2009). ................................ 26
Table 5. Surface evaluation prior to installing polymer overlays (Krauss et al, 2009). ........................... 26
Table 6. Commercially available products for thin polymer overlays...................................................... 33
Table 7. Selected Test Products/Methods................................................................................................. 34
Table 8. Product information provided by suppliers for various polymer overlay products.................... 35
Table 9. Grouping of test specimens......................................................................................................... 37
Table 10. Description of polymer overlay types used on Marquette Interchange ramp........................... 64
Table 11. Initial (baseline) results of pull-out tests................................................................................... 69
Table 12. Final average pull-out strength for all groups........................................................................... 71
Table 13. Final average pull-out strength for groups A, B, and, C........................................................... 71
Table 14. Initial (Round 0) average coefficient of friction of all groups.................................................. 74
Table 15. Final coefficient of friction (Round 3) values for groups A, B, and C..................................... 75
Table 16. Average coefficient of friction for all groups at round 0, 1, 2, and 3. ...................................... 76
Table 17. Parameters for Modified Exponential Fit-Curve. ..................................................................... 78
Table 18. Average corrosion mass losses and standard deviations for Groups A, B, and C.................... 79
Table 19. Average corrosion mass losses and standard deviations for all specimen groups.................... 80
Table 20. Average surface deformations for groups A, B, and C............................................................. 82
Table 21. Average surface deformations of all groups............................................................................. 82
Table 22. Index values for pull-out strength............................................................................................. 85
Table 23. Index values for coefficient of friction results.......................................................................... 85
Table 24. Index values for corrosion mass loss. ....................................................................................... 86
Table 25. Index values for surface profile results..................................................................................... 86
Table 26. Combined performance index I4 – Combined pull-out strength, friction,................................ 87
Table 27. Combined performance index I3 – Combined pull-out strength, friction,................................ 88
Table 28. Combined performance index I2 – Combined pull-out strength, and friction. ......................... 89
Table 29. Summary of best (highest) and worst (lowest) performance Indices. ...................................... 90
Table 30. Summary of best and worst indices in graphical form. ............................................................ 90
Table 31. Average Friction Test Results Using British Pendulum Tester................................................ 91
Table 32. Summary of Experimental Results ........................................................................................... 93
8
ACKNOWLEDGEMENTS
The project team appreciates the support of the Wisconsin Highway Research Program (WHRP) in
sponsoring this research project. We especially thank Mr. William Oliva, Mr. Travis McDaniel, and Mr.
David Bohnsack of the Wisconsin Department of Transportation and other members of the project
oversight committee for their help and input.
Funding for the tests on one of the nine overlay systems discussed in this report was provided by
Dow Poly Carb, Inc.
Special thanks are due to the many staff members and students at the University of Wisconsin-
Milwaukee who helped with this project including Rahim Reshadi, Brian Mullen, Ali Ehsan Ali,
Kenneth Sosinski, Jorge Henrique Lima Reis, Marinara Andrade Do Nascimento, Sam Rusch, and Tye
Rodriguez.
9
EXECUTIVE SUMMARY
Deterioration of concrete bridge decks is a major maintenance concern particularly in the northern snow-
belt regions where deicing salt is used to maintain traffic during winter months. Overlays and sealers have
long been utilized in protection and repair strategies for bridge decks. Polymer overlays are used on decks
to reduce the penetration of chloride ions (and the resulting corrosion) and to improve skid resistance
(increase friction). Because of their small thicknesses (generally 0.25 to 0.75 in), polymer overlays impose
less additional dead weight and can be applied more rapidly compared to other types of overlay.
States may utilize differing criteria when deciding whether to use overlays. These criteria may include
chloride content at the level of reinforcing bars, percent delamination of the deck, and the depth of cover
over reinforcement. For example, a study in Virginia (Sprinkel et al., 1993) recommended that all concrete
with chloride contents over 1.0 lb./yd3
be removed prior to placement of overlay. The rationale for such a
recommendation is that the corrosion activity may continue unabated when significant chloride
contamination exists under the overlay.
The objectives of this research project were to explore the effectiveness and durability of thin polymer
overlays with respect to restoring and protecting bridge decks, improving safety, and extending service
life; to assess and compare performance of selected thin polymer overlay systems under laboratory test
conditions; and to suggest appropriate bridge deck maintenance strategies related to this research.
An experimental research program was designed and conducted to study and compare the performance of
nine different overlay systems (designated S1 through S9) against each other and against a set of uncoated
control specimens (designated S0). A total of 84 reinforced concrete slab specimens were subjected to
accelerated corrosion (saltwater exposure and imposition of an electrical potential to the reinforcing bars),
freeze-thaw cycles, heat/ultraviolet/rain exposure cycles, and tire wear tests (including simulated “snow
plow” passages). Application of overlays on previously chloride-contaminated concrete was also studied
through exposure of two sets of specimens to increasing chloride (corrosion) levels prior to application of
overlays. A number of parameters including pull-out strength (bond between overlay and concrete
surface), friction, deformation due to tire passages (rutting), and corrosion mass loss were measured. The
specimens were dissected at the conclusion of testing for further examination and measurement of
corrosion mass loss on the top reinforcing bars. The results of the testing program are discussed in detail
in this report. The main results can be summarized as follows:
10
 One of the nine overlay systems tested (S8 - a 2-lift polyester multi-lift overlay) exhibited complete
delamination from the concrete surface during testing even though its initial pull-out strength was
in line with the other eight overlay types. This overlay system had the worst overall performance
based on numerical indices given to various performance parameters, or combinations of those
parameters. In general, aside from the poor performance of S8, there were variations in
performance of all other TPO systems tested (as discussed below); however, such differences were
not drastic.
 Friction test results prior to environmental exposures indicated that the tined concrete surface
(concrete surface without overlay - control) had the highest initial friction values. However, the
control specimen (without overlay) had the lowest friction values at the end of all testing. This
indicates that the polymer overlay systems help retain surface friction values.
 The overlay system utilizing epoxy resin with flint rock provided the highest friction, and the best
overall performance indices, at the end of testing.
 Of the three aggregate types (flint, granite, and calcined bauxite) used with the same epoxy resin
(S1, S2, S3), the flint rock resulted in the highest friction values at the end of tests, while calcined
bauxite exhibited the lowest friction results. The only overlay system with the taconite aggregate
(S9) provided the second highest friction values at the end of testing.
 The epoxy-based overlays (with different aggregate types) and the polyester premix system offered
reduced corrosion losses when compared to the control specimens. However, the addition of
overlays does not significantly reduce corrosion mass loss when specimens are already
contaminated with chlorides prior to installation of overlays.
 As far as pull-out strength (at the end of testing) is concerned, the epoxy overlay systems with
calcined bauxite and flint aggregates (S3 and S1) provided the highest and second highest
strengths, respectively. The lowest and the second lowest pull-out strengths were observed in the
polyester multi-lift system (S8) and the overlay system with taconite (S9), respectively.
 The main advantage of thin polymer overlays is the long-term preservation of friction coefficients
as the deck ages relative to the concrete without overlay. Therefore, for applications where friction
enhancements are needed, the thin polymer overlays are recommended unless chloride
contamination, corrosion, and/or deck surface conditions preclude its use.
11
 Proper installation of the overlays is crucial. Special effort and proper quality controls are needed
to ensure that the overlay is installed properly. If the installation is done correctly, most of the
tested systems (with the exception of the system described above) can perform without premature
delamination.
 During freeze-thaw testing, it was observed that some aggregates would become loose and leave
the overlay system after each round of freeze-thaw cycles. It is anticipated that the loss of
aggregates would continue with time. Since aggregates provide a physical barrier protecting the
polymer against deterioration due to ultraviolet radiation from the sun, it is expected that a longer-
term mode of damage may be related to UV degradation of the polymer following loss of
aggregates.
 Based on information in the literature, survey findings, and results from this study, it is anticipated
that the service life of a 2-lift thin polymer overlay would be on the order of 7 to 15 years, if early
premature failures do not occur. A service life of 10 years can be assumed for economic analyses.
 If the purpose for the installation of the thin polymer overlay is to protect an uncontaminated deck
against corrosion, a more cost effective approach may be to apply penetrating sealer instead shortly
after construction, and repeating the sealer application periodically thereafter. However, on
heavily-travelled roads, routine reapplication of sealers can be particularly disruptive to traffic. In
such cases, thin polymer overlays can be applied as a corrosion protection measure, especially if
the overlay is applied early in the bridge deck’s life before substantial chloride contamination has
occurred.
 The addition of polymer overlays does not significantly reduce corrosion mass loss in bridge decks
with high levels of prior chloride contamination. Therefore, the placement of a thin polymer
overlay on a chloride contaminated bridge deck undergoing active corrosion of the embedded steel
cannot be considered to be an effective corrosion mitigation strategy. Such a step (application of
thin polymer overlay) may still be taken in these situations for other reasons such as improving
friction or providing a smooth riding surface over a limited time period. However, the overlay
must be installed on sound concrete under all circumstances, and it must be realized that the
overlay may eventually fail due to effect of corrosion of the underlying reinforcement, if not for
other factors.
 A set of guidelines for the maintenance of bridge decks is provided in Chapter 6.
12
1.0 INTRODUCTION
1.1 Background
Concrete bridges in Wisconsin and elsewhere have shown varying signs of deterioration due to aging and
other detrimental factors. Considering the enormous cost and effort required to remedy bridge
deficiencies, it is crucial that a concerted effort be made to develop and implement practical, effective and
economical methods and guidelines for protection, repair and rehabilitation of bridges.
Deterioration of concrete bridge decks is a major maintenance problem particularly in the northern snow-
belt regions where deicing salt is used to maintain traffic during the winter months. Bridge decks are a
significant deterioration concern as they are directly subjected to vehicular effects (load, abrasion,…),
deicing salts and freeze-thaw cycles. Chloride ions can penetrate into the concrete and reach the level of
reinforcing steel in concrete. This results in the loss of alkaline environment in concrete and the
elimination of the surface passivity of steel reinforcement. The outcome is initiation of corrosion of steel
in concrete. The problem is further amplified due to the expansive nature of the corrosion products.
To address these problems, overlays and sealers have long been utilized in protection and repair strategies
for bridge decks. In the following, a brief discussion of overlays and sealers is presented.
Overlays
In general, deck overlays include asphalt concretes with or without membranes, latex or micro-silica
modified concrete, high-early-strength hydraulic cement concretes, and polymer overlays. Polymer
overlays are used on decks to reduce penetration of chloride ions, and to increase skid resistance (friction).
Because of their small thicknesses (generally 0.25 to 0.75 in), polymer overlays impose less additional
dead weight compared to other types of overlay. Such overlays can also be applied rapidly with lane
closures of 8 hours or less.
States utilize differing criteria when deciding whether to use overlays. These criteria include chloride
content, percent delamination of the deck, and the depth of cover over reinforcement. For example, the
Washington State DOT criteria recommends use of overlays if a) the chloride level at the level of
reinforcement exceeds 2 lb/yd3
; or 2) delamination (using chain drag) exceeds 2% of deck area; or c) over
15% of measurements show a reinforcement cover of less than 1 inch (Wilson and Henley, 1995).
However, others may not agree with the above conditions. Sprinkel et al (1993) recommended that all
concrete with chloride contents over 1.0 lb/yd3
, or half-cell potentials of -0.250 V (CSE) or less, be
13
removed prior to placement of overlay. The rationale is that corrosion activity will continue unabated
when significant chloride contamination exists under the overlay.
Sprinkel et al (1995) categorize polymer overlays into three basic types: multi-layer, pre-mixed and slurry.
Multi-layer polymer overlays (generally two layers) are the most common type of thin polymer overlays
used. In this method, patch repairs of delaminated deck areas are first performed as needed. Then, the deck
surface is shot-blasted and cleaned. The most common resin used in this approach is epoxy. However,
methyl methacrylate (MM), epoxy-urethanes, polyesters, and other resins are also used. A primer may (or
may not) be first applied. The resin is then mixed with hardener and applied by sprayer, brush, roller, or
squeegee onto the surface. Resin thickness would be on the order of 30 to 40 mils. Typically, a gap-graded
clean aggregate is then broadcast on the resin. There is consensus that the type and quality of aggregates
are crucial in the effectiveness of thin polymer overlays. Basalt-type aggregates are commonly specified.
A short time after the resin application (when the resin is cured), the excess aggregates are broomed or
vacuumed and another layer of resin and aggregates is applied (for a two-layer system).
A proprietary thin polymer overlay system was designed to help reduce icing and accidents by using
aggregates that absorb and re-release deicing agents when needed later (Evans 2010, Sprinkel et al, 2009).
However, its performance was not considered adequate in some early installations.
For premixed overlays, the binder (usually polyester styrene), aggregates, and initiator are mixed, placed
on the deck and finished with a vibrating screed. The thickness of premixed overlay is typically between
0.5 and 1.0 in. Slurry overlays include mixing a flowable polymer mortar on a primed deck surface (0.25
in thick) followed by broadcasting aggregates on the slurry. Excess aggregates are removed and a seal
coat is sometimes applied. The total thickness of this system is about 0.38 in, and the most common
binders are epoxy and methacrylate.
Nelson (2005) identified the following factors as contributing to failure in polymer overlays: improper
binder selection; inadequate surface preparation; improper aggregate selection; improper mixing-
application-curing; and damage due to ultraviolet radiation. The coefficient of thermal expansion of the
overlay system should be compatible with that of the deck concrete. A flexible and solvent-free binder
helps avoid delamination (Appendix A of ACI 503, 1993). A good polymer overlay should have bond
strength of better than 250 psi (Nelsen, 2005). According to Nelsen, the resin material should have a tensile
strength and elongation capability of at least 2000 psi and 30%, respectively. Nelsen also recommended
that polymer overlays not be applied on concretes with rebar level chloride contents of 1.5 lb./yd3
or
higher. Excessive moisture in the concrete at the time of application can lead to early failure. Water vapor
14
can result in weaker bond. The moisture condition can be tested by taping a 18-ft by 18-ft polyethylene
sheet on the concrete surface (ASTM D4263). If moisture collects under this sheet in less time that it takes
for the epoxy to cure, the substrate should be allowed to dry before application of resin. Many states
specify a 2-hr time frame for the plastic sheet test.
The aggregates used in polymer overlays should be resistant to fracturing and polishing. Suitable
aggregates include pure aluminum oxide, emery, basalt with aluminum oxide, or greywacke (Smith,
1991). Aggregates should also be dry and free of dust.
UV radiation absorbed by polymers can cause scission reactions, causing molecules to break up and erode
(Nelsen, 2005). In typical bridge deck overlays, the polymer is shielded from UV radiation by the surface
aggregates. However, UV resistance is still a factor that should be considered.
In northern deicing states, such as Wisconsin, there is significant potential for snow plow damage to the
polymer overlay. The damage is in the form of wear and reduction of skid resistance over time. Evans
(2010) noted that the initially high skid resistance of a proprietary overlay system reduced rapidly over a
few years. Another potential damage mode may be through freeze-thaw action. Damage may potentially
occur at the interface between concrete and the polymer. In general, more recent works suggest a life
expectancy of 10 to 15 years when the thin polymers overlay perform as designed. Rogers et al. (2011)
report a service life of approximately 10 years. There are cases, however, when the overlays did not last
as expected (Soltesz, 2010).
Sealers
To minimize and slow down the deterioration process in concrete decks in bridges, Wisconsin and other
departments of transportation in the United States routinely use different types of deck and crack sealers.
The most commonly used sealers contain hydrophobic agents. These sealers are either applied to the
surface of concrete after it is cured (in new or older construction) or added to the fresh concrete mix (as
admixture) prior to its placement. These sealers are intended to minimize the capillary action at the surface
of undamaged concrete, to fill existing cracks, and to stop the penetration of contaminated water and
oxygen into the concrete. Generally, the use of these sealers has been shown to be effective in reducing
chloride intrusion and extending the service life of concrete decks. However, periodic re-applications of
these sealers are required to counter the loss of their effectiveness (Tabatabai et al, 2009). Sealers may
lose their effectiveness in bridge decks due to various factors including traffic wear, insufficient
penetration depths, and improper surface treatment prior to sealer application. A recent WHRP study
included assessments of sealers in the laboratory and in the field (Tabatabai et al., 2009).
15
1.2 Objectives and Scope
The objectives of this research project were:
1) To explore the effectiveness and durability of thin polymer overlays with respect to restoring and
protecting bridge decks, improving safety, and extending service life.
2) To assess and compare performance of selected thin polymer overlay systems under laboratory test
conditions.
3) To suggest appropriate bridge deck maintenance strategies related to this research.
The scope of work included performing a comprehensive review of literature, conducting a limited survey,
and designing and implementing a testing program. The survey was a follow-up to a comprehensive survey
conducted under a NCHRP Synthesis study by Fowler and Whitney (2011). Selected state engineers and
material suppliers were contacted and interviewed by telephone.
An experimental research program was designed and conducted to study and compare the performance of
nine different overlay systems. A total of 84 reinforced concrete specimens were subjected to accelerated
corrosion (saltwater exposure and imposition of an electrical potential to the reinforcing bars), freeze-
thaw cycles, heat/ultraviolet/rain exposure cycles, and tire wear tests (including simulated “snow plow”
passages). Application of overlays on previously chloride-contaminated concrete was also studied through
exposure of two sets of specimens to increasing chloride (corrosion) levels prior to application of overlays.
A number of parameters including pull-out strength, friction, deformation due to tire passages (rutting),
and corrosion mass loss were measured. The specimens were dissected at the conclusion of testing for
further examination and measurement of corrosion mass loss on the top reinforcing bars. In addition,
initial friction tests were performed on four thin polymer overlay systems installed in 2013 on a Marquette
Interchange ramp in Milwaukee, WI.
16
2.0 LITERATURE REVIEW
The research team conducted a comprehensive review of available domestic and international literature
concerning application of appropriate overlays and sealers for bridge decks. On-line sources of
information as well as conventional search databases were utilized.
A summary of the work on deck protection and repair (until 1993) was presented in a Strategic Highway
Research Program (SHRP) research report (SHRP S-344 by Sprinkel et al, 1993). The SHRP S-344 study
made detailed observations and recommendations on deck overlays and sealers. This study projected that,
in areas of moderate deicing salt applications, the time to reach a chloride content of 1 lb/yd3
is 13 years
without any protection, 25 years with a maintained epoxy sealer, and 77 years with a maintained polymer
overlay. Although this comparative projection of 77 years may be questionable, it does show that early
results were very promising.
Some of the other observations and recommendations in this SHRP study included the following (Sprinkel
et al, 1993):
 Silane-treated decks have higher permeability in the traffic lane than in the shoulders. This SHRP
observation implies the need for re-application of sealers to maintain protection.
 “Multiple-layer epoxy and epoxy-urethane and premixed polyester overlays can provide a skid-
resistant wearing and protective surface for 25 years when exposed to moderate salt application
rates and light traffic”.
 While bond decreases with age, multiple-layer epoxy overlays exhibit the best long-term adhesion;
 Quality of aggregates is important. No. 8 gap graded basalt or silica aggregates should be used in
multi-layer polymer overlays.
 Concrete with chloride content of more than 1 lb/yd3 should be removed to achieve longer service
life.
 “Good skid numbers are achieved when sealers are placed on tined or grooved concrete surfaces
so long as the material does not fill the groove”.
Wilson et al (1995) reported on Washington State Department of Transportation’s (WSDOT’s) 10-year
experience with epoxy and methyl methacrylate (MMA) thin polymer deck overlays. According to that
report, WSDOT normally uses a 1.5-in-thick modified concrete (either latex or microsilica) as its primary
deck overlay. WSDOT considers such overlays more durable than thin polymer overlays. However, when
17
additional deadweight is a problem or when the roadway width is narrow, WSDOT uses 3/8-in thin
polymer overlay. Wilson et al. concluded:
“The latest bond tests on several bridges show that epoxy overlays have a higher average value
(274 psi) over time compared to MMA overlays (143 psi). The latest friction numbers show MMA
overlays retain friction resistance very well over time, from an initial average value of
approximately 40 to a value in the mid-30s after nine years of service. Test results show that the
initial friction numbers for epoxy overlays start around 70 and fall to the mid to low 20s in five to
seven years.”
The literature search performed in this study did not indicate any agency using a combination of a first
epoxy layer followed by a second MMA layer. Such a combination was chosen as an overlay system to
be tested in this research. Wilson et al (1995) stated that additional polymer applications may be needed
in 5-10 year intervals. They concluded that thin polymer overlays are a viable alternative to rigid concrete
overlays when rapid construction is essential or when additional dead load is unacceptable.
Pfeifer and Kowalski (1999) discuss two thin polymer overlay applications on adjacent bridges carrying
I-57 near Clifton, Illinois. These overlays consisted of two layers of aggregate embedded in epoxy with a
total thickness of 0.25 in. A rhyolitic stone aggregate (“trap rock”) was used. Bottom and top layer
aggregates had average particle sizes of 1/16 in and 1/8 in, respectively. Other requirements were that
more than 5% of aggregates may pass #20 sieve, and those passing #200 sieve must be less than 1%. Skid
resistance tests (with treaded and smooth tires) were performed at 4 weeks, 10 months and 20 months after
installation. Initial skid numbers were 70, which over 20 months reduced to 51 (smooth tire) and 60
(treaded tire). Cores removed from these decks had average chloride levels of 2.6 lbs/yd3
. The authors
recommended that an application be first made on a test area, and pull-off testing (Appendix A procedures
in ACI 503R) be performed within 48 hours after the test area application.
Nelsen (2005) discussed polymer deck overlays in details including resin types and failure modes. Soltesz
(2010) evaluated thin overlays for bridge decks in Oregon. According to the author, Oregon has had mixed
results with thin polymer overlays. Eight different thin polymer overlay systems were evaluated in the
laboratory and on two bridge decks. There were installation and crew experience issues for some products.
Skid testing using a skid trailer was performed in the field (ASTM E 274). Overlay applications were done
in 2007 and last skid testing was performed in 2010. Laboratory flexural and compressive strength tests
were performed on the overlay in accordance with ASTM C 580 and C 579. Test temperatures were 0, 70,
and 140 degrees Fahrenheit. According to Soltesz, “none of the overlay systems showed superior
18
performance under moderate average daily traffic from the standpoint of maintaining good skid resistance
and resisting wear through”. Three products began to wear through, one very early and the other two after
1.3 million vehicle passages. Soltesz reported that for the remaining five products, predictive models based
on initial test results suggested that skid would reduce to 40 within five months at a traffic level of 10,000
vehicles per lane per day. Delamination was not a problem. It should be noted that Oregon allows studded
tires.
Fowler and Whitney (2011) provided a history of thin polymer overlay use in bridge decks. They reported
that the first TPO applications in the 1950’s involved use of coal-tar epoxy followed by a fine aggregate
broadcast. In the 1960s and 1970s oil-extended epoxy as well as polyester-styrene resins and methyl
methacrylate monomer systems were utilized to improve performance. Later, products were specifically
designed to address TPO problems including delamination of the overlay. Fowler and Whitney (2011)
reported that lower modulus and higher elongation resins were developed to address an important factor
in overlay delamination, namely thermal incompatibility between polymers and concrete.
Fowler and Whitney also summarized the work of Choi et al. (1996) on interfacial stresses between
overlay and the concrete substrate. They concluded that “overlays that are thinner and less stiff will
produce smaller stresses with the same temperature change.” Fowler and Whitney further report on the
work by White and Montani (1997) in which the effect of temperature on elongation is addressed. White
and Montani (1997) recommend that the elongation be tested at 40°F (minimum 20% elongation) and at
73°F (minimum 30% elongation) in accordance with ASTM D638.
19
3.0 SURVEY RESULTS
3.1 Previous Surveys (by Others)
The research team focused its survey work on follow-up inquiries to a national survey conducted in the
NCHRP Synthesis Report No. 423 on performance of thin polymer overlays for bridge decks. The NCHRP
Synthesis study was performed by David Fowler and David Whitney of the University of Texas at Austin
(Fowler and Whitney, 2011). This work included a national survey of states and contractors on
performance of polymer concrete on bridge decks. The researchers received survey responses from 40
states. Table 1 shows a summary of survey results in that study. Fowler and Whitney summarize results
of their survey as follows:
“The survey responses, from 40 states and seven provinces, revealed that at least 2,400 TPOs have
been constructed in the United States and Canada, a fourfold increase over the number installed
through 1999. Seven states and three provinces that responded have not used TPOs. Nearly all
states use epoxy resins, and only California indicated that it uses predominantly polyester-styrene
in premixed overlays.”
Based on their survey, Fowler and Whitney (2011) report the following causes of TPO failures:
 “Deck condition—in many cases, overall condition of deck probably too poor to apply overlay;
 Repaired areas not sufficiently dry and/or not roughened;
 Inadequate surface preparation;
 Cool damp weather during installation;
 Deck too damp at time of overlay installation;
 Construction problems;
 Inadequate quality control; and
 Use of snow chains”.
Fowler and Whitney (2011) report the contractors’ recommendation (based on their survey) as follows:
 “Bidders be prequalified for TPO experience;
 Resin manufacturer’s representative always be present, especially if warranty is required;
20
 Repairs be made using compatible polymer patching materials supplied or specified by the TPO
manufacturer, which eliminates paying for traffic control twice and having to build in an extra 28
to 56 days to let the patches cure, dry, and outgas;
 Diamond grinding be specified for very rough decks to save on the cost of shot blasting and to
minimize the resin consumption;
 A mandatory 4-hour curing period is too long in hot weather; 1 hour is often enough and can be
verified by the impact hammer and/or screwdriver test; peak exotherm or maturity might also work
to confirm the curing, especially for thicker overlays;
 The specifications requiring the airless spray application for high-molecular-weight methacrylate
sealers and primers be eliminated because of the difficulty in keeping the spray guns calibrated;
by the time the problem is discovered, considerable improperly mixed resin has been applied;
 TPO applications always be restricted to warm and dry periods; and
 Warranties for 5 years be required.”
Fowler and Whitney (2011) report the material suppliers’ identification of problems and the suppliers’
recommendation as follows:
Problems encountered (Fowler and Whitney, 2011):
 “Poor deck condition;
 Cracking and delamination of deck;
 Inadequate concrete cover on steel;
 Bidding followed by requirement that they must provide technical support on site; and
 Obtaining all three surface preparation requirements: clean, dry, and sound.”
Material suppliers’ recommendations (Fowler and Whitney, 2011):
 “Technical representatives be trained;
 Manufacturer’s representative be on site to oversee work;
 The deck be in good condition;
 Deck be clean and dry;
 Deck cleaning texture be specified as ICRI CSP 7, but can accept 6;
21
 Multiple-layer TPOs be used for epoxy systems;
 Minimum tensile elongation be 50% for epoxy systems;
 Aggregate have a Mohs hardness of 7;
 AASHTO Task Force 34 recommendations... be followed;
 For polyester systems specifications, have contractor make an investment in volumetric mixers
with readouts and plural components, paving machine with automatic grade control, and shot-
blasting equipment; and
 Specification must require experience.”
Krauss et al. (2009) report on bridge deck overlays, sealers and treatments. As part of their NCHRP study,
Krauss et al. (2009) conducted a national survey of states on various repair methods and sealers. Polymer
overlays (thin-bonded polymer concrete) were included in their national survey. Twenty-three states
provided responses to the survey. These were AK, CA, CO, GA, ID, IL, KS, MA, ME, MO, NM, NV,
NY, OK, OR, TN, UT, VT, and WY.
The respondents identified the following advantages (Krauss et al., 2009):
 “Quick installation and rapid return to traffic (65%)
 Easy installation (39%)
o No modifications of approaches required
o No redoing of expansion joints is required
 Light weight or low dead load - 7 respondents (30%)
 Good waterproofing and low chloride permeability - 6 respondents (26%)
 Durability or long life - 6 respondents (26%)
 Skid resistance or good friction characteristics - 5 respondents (22%)”
22
Table 1. Summary of Survey Results from NCHRP Synthesis Report 423 (Fowler and Whitney, 2011).
23
24
The following were the disadvantages (Krauss et al. 2009):
 Cost - 11 respondents (48%)
 Installation problems (30%)
o Inadequate surface preparation can affect adhesion
o Binder preparation
 Low durability (17%)
o High traffic loads
o Under the wheel path
 Problems occurring during installation can be difficult to correct (13%)
 Polymer concrete cannot be used as a replacement for bridge deck concrete (4%)
Krauss et al. further report that the use of polymer overlays has increased nationwide, especially within
the last 10 years. Massachusetts has used polymer overlays for over 25 years. Thirty percent of respondents
used polymer overlays in the last 10 to 25 years ago, while thirty-nine percent used such overlays
beginning 5 to 10 years ago. Twenty-six percent of respondents began using polymer overlays in the last
five years.
The mean and median anticipated lifespan of the polymer overlays, as reported by the respondents, were
9 to 18 years and 10 to 18 years, respectively. Table 2 shows survey responses to a question on reasons
for selection of polymer overlays.
Table 2. Reasons for selection of Polymer overlays (Krauss et al., 2009).
25
Table 3 shows the respondent’s answers to a question on deck conditions that can be addressed by
polymer overlays. Polymer overlays were most commonly used for decks with cracking, but otherwise
in good condition with no significant corrosion (15 or 65%). Polymer overlays are also used for other
conditions including for newer desks.
Table 3. Deck conditions that can be addressed by polymer overlays (Krauss et al, 2009).
Table 4 shows the survey responses regarding surface preparation used. The most common surface
preparation is shot blasting. Table 5 shows responses related to surface evaluation prior to installing the
overlay.
The following general recommendations made by the respondents in the Krauss et al (2009) study:
“Three respondents recommended that a manufacturer’s representative be on site during
installation. Three respondents mentioned surface preparation concerns. More than one
respondent mentioned that high quality surface preparation is essential, and that a dry surface
should be obtained. Another mentioned that the system does not adhere well to green concrete.
Two respondents discussed cure time, one stated that cure time can be more than four hours per
layer, the other to recommend use if construction time is a concern. Weather can be a factor in the
cure of some systems, and it is suggested that installers adhere to temperature and humidity
tolerances. One respondent recommended that thin bonded epoxy overlays not be used to repair
decks with active corrosion, and another respondent recommended that polymer concrete not be
used for partial replacement of a bridge deck section. This respondent also recommended the use
of volumetric mixing trucks and paving machines for placement on large areas. Another
respondent recommends that one should determine if cracks are working and determine ride
quality. Another respondent recommends that colleagues avoid methyl methacrylate thin bonded
overlays.”
26
Table 4. Surface preparation techniques in polymer overlays (Krauss et al, 2009).
Table 5. Surface evaluation prior to installing polymer overlays (Krauss et al, 2009).
3.2 State Survey Results – This Study
The research team contacted Prof. David Fowler to obtain detailed survey responses from his NCHRP
synthesis study. Prof. Fowler provided such responses from Iowa, Minnesota, Missouri, and New York.
The project team was able to contact respondents in Iowa, Illinois, Minnesota, and Missouri to ask detailed
questions about their state’s experiences. Furthermore, the research team contacted several manufacturers
of thin polymer overlay products to discuss applications of their products in detail.
The following is a summary of telephone conversations (in 2013) with select state DOT personnel who
had responded to the earlier NCHRP survey, and whose detailed responses were received from Prof.
Fowler.
Missouri: (Ms. Jen Harper)
As of the time of the NCHRP survey (2008), Missouri had reported over 300 TPO installations. However,
Missouri has installed very few since the NCHRP survey. The reason for this major change is related to
the new requirements for TPO installations. Past failures had brought about new criteria for utilization of
TPO requiring that the deck delamination and damage be less than 5%. This requirement has significantly
reduced the number of TPO installations since TPOs are typically not employed in a preventive mode on
better deck conditions.
27
Missouri uses a 2-lift epoxy system with a sand broadcast, and does not use premixed systems. Missouri
may sometimes use a MMA sealer prior to placement of TPO. Missouri’s specifications require pull-out
and moisture tests, and limit types of aggregates and gradations to be used. Missouri used to perform skid
resistance tests, but does not do so anymore, and has not tested for changes in skid resistance over time.
Missouri requires a 20% elongation on the epoxy resin.
Illinois: (Mr. Gary Kowalski)
In 2008, Illinois had reported a total of 24 TPO installations between 1996 and 2007. Illinois has since
installed 10 more TPO systems. Illinois requires that the deck be in “good shape”, and prefers that any
patching be done ahead of time. The type of binder used is low-mod epoxy. MMA is not used as TPO
binder, but is used for waterproofing. Illinois requires that the deck be shot-blasted and pull-out tests be
performed at 3 locations with strength greater than 175 psi. Illinois requires “no visible moisture on
surface” at installation.
Regarding aggregates, crushed basalt and aluminum oxide with gradation requirements are allowed. A
hardness of at least 6 is required (on Mohs scale). Some of the early problems in other states have been
due to use of bottom coal slag, which is not allowed for TPO applications in Illinois anymore.
Illinois did not report problems with UV resistance, skid resistance or overall TPO failures. Localized
failures in wheel lanes were mentioned. Illinois has six pre-approved products for TPO applications.
Iowa: (Mr. Norm McDonald)
In the 2008 NCHRP survey, Iowa had reported one TPO installation, and reported that it had stopped
using TPOs. The single TPO was installed in 1986. The deck performed well for 4 years, but later
delaminated. There was another failure of TPO on another city bridge in Iowa. The TPO was installed in
1987 and failed in 1991. Cores were taken, which showed shallow delamination below bottom of overlay.
Iowa plans to install another TPO next spring, and has developed a new set of specifications for TPOs.
They require pull-out tests (250 psi) and specify “no visible moisture” on concrete surface. A 2-hr taped
plastic test is performed for moisture indication (ASTM D4263).
Minnesota: (Mr. Ed Lutgen)
The first five TPO bridge decks (in 2006) were a proprietary system with limestone aggregates. They
developed skid problems. In 2009, two bridges received a different overlay system with a taconite
aggregate from Virginia. However, the aggregates dislodged because the aggregates were dirty and they
were not dry. In 2012, they installed a premix polyester system with a cost of about $12/sq ft. There was
28
some spalling near joints, but there were no other problems reported. In 2011, two epoxy-urethane overlay
installations were made. Minnesota has not used a methacrylate system.
Minnesota does not have established criteria for applying TPOs. They decide on project-by-project basis.
Minnesota requires pull-off test before application of TPO (on concrete). A minimum strength of 250 psi
is required. The 2-hr plastic test is used for moisture. For aggregates, they require a hardness of 6 and have
an aggregate gradation requirement.
3.3 Supplier Survey Results – This Study
Material suppliers were interviewed on the telephone in 2013.
TK Products: (Don Kopen)
The TK2109 is the epoxy-based product for thin polymer overlays. The first layer is applied at 40 sq. ft.
per gallon (thinner) and the second layer is applied at 20 sq. ft. per gallon. A thinner epoxy product
TK2110 is used for sealing cracks prior to application of TK2109. There are also two other types of crack
sealer, a methacrylate product (TK2414, a little thinner than TK2110), and a polyurea product (TK9030).
The elongation for TK2109 is 36%. States prefer angular aggregates. “Trap rock” (from Kansas City) and
“Red Flint” (from Eau Clair – not as angular) are sometimes used. Aggregate should be dry with less than
17% moisture (measured using a 2-needle probe). Pull-off tests are not done on jobs, and they haven’t
done any tests.
Regarding surface treatment, shot blasting is very good as the epoxy can wet the surface.
The most common system is a 2-lift system. The expected life is at least 15 years. As soon as epoxy goes
down, there should be another crew behind it placing aggregate. Set time is about 4 hours at 70 degrees.
If there is too much delamination on the deck slab, do not place the overlay.
SIKA (Craig Frier):
Their product for thin polymer overlays is “Sikadur 22 Lo-Mod”, which is an epoxy-based system. They
have two products for crack sealing: “SikaPronto 19TF” has very low viscosity and can be applied in
colder temperature. “Sikadur 55 SLV” is another crack sealer, which cannot be used at or below 40
degrees.
The first and second layers are placed at 40 and 20 sq. ft. per gallon, respectively. Pull-off tests can be
used before (to check substrate) and after overlay placement. Moisture is normally not a problem except
when fresh patches exist. Moisture test can be with the plastic sheath method, probes, or calcium chloride
29
test. A clean and sound surface must be present. There are no problems with putting overlay on patched
surfaces that are cured.
Wisconsin requires a more angular aggregate. Moisture content of aggregate is tested. The state requires
independent field testing. The state may also remove cores to measure thickness.
Only one overlay delamination has been reported in 60 cases. Overlay can break down near expansion
joints, but that is easy to repair.
Dayton Superior (Unitex): (Don Edwards)
Their “Pro-Poxy” product for thin polymer overlays is an epoxy-urethane-based product. They have a
crack sealer product (“Bridge Seal”), which is an epoxy-based healer/sealer or primer. They also provide
a system for skid resistance in which typically one lift is used.
The causes of problems are bad installation and contaminants. Pull-off testing only gives indication in the
particular measurement area. Aggregates are provided by contractors. Typically, bauxite or flint rock is
used. Moisture content of substrate measured using a moisture meter should be less than 4%.
International Coating (Mike Kramer):
They have an epoxy overlay system and a crack sealer/filler product that can be used with the overlay.
The overlay has a ¼-in thickness in two lifts. Each lift includes 25 sq. ft./ gallon (approximately 60 mils).
The epoxy elongation is 40% but can be lower at colder temperatures. Preparation of slab is important
(shot blasting). The “no standing water” rule is OK. Substrate moisture is not an issue on bridge decks.
Moisture tests can be done using the calcium chloride method, the relative humidity test, or the plastic
sheet method. A pull-off test is not necessary, but 250-300 psi pull-off strength is standard. Coatings over
patched areas are OK as long as there is a solid surface. Regarding aggregates, the manufacturer does not
supply aggregates, and whatever the state requires in its specifications is followed.
Kwik Bond Polymers (Greg Freeman):
The company provides premixed and multi-lift polyester overlay systems. They have worked with
Caltrans for many years (1970s). In the last 6-8 years, multi-lift polyester with slightly modified polyester
is also used.
The premixed polyester overlay is considered to be a better system. The premixed system has to have
trained contractors. Most states have multi-lift specifications, and there is market demand for multi-lift
systems. Polyester has better UV stability, better thermal compatibility, and shorter time is needed to
30
return traffic. Calcined bauxite aggregate (from aluminum smelting) would be the best type of aggregate
because of its polished stone value (PSV) test results. This aggregate is imported from overseas and is
processed in the US. They require visibly surface dry conditions for the substrate. Pull-off tests results are
expected to be over 300 psi. They expect skid resistance in 5 years of over 65. On patched systems, some
patches could have off-gas that affects good bond. Cured properties are important.
3.4 Summary of Survey Results
A comprehensive survey related to thin polymer overlays was conducted by Fowler and Whitney in 2011.
Therefore, instead of conducting a new survey, the research team focused on reviewing the existing
survey, and seeking follow-up feedback from those who had responded to the initial survey. Engineers
from departments of transportation in Missouri, Illinois, Iowa, and Minnesota were contacted for
telephone interviews. In addition, suppliers of polymer overlay materials were contacted and interviewed
to obtain feedback. The following summarizes some of the survey results
Causes of overlay failure include:
 Improper surface preparation
 Surface moisture
 Out-of-range concrete temperature
 Deck patch materials that have not sufficiently aged
 Unsound concrete deck surface
 Pre-existing corrosion deterioration and chloride contamination
Recommendations:
 Specifications should address surface preparation procedures and outcomes.
 Specifications should address hardness (Mohs scale), gradation, shape, dryness, and cleanliness
of aggregates.
 Specifications should address thermal compatibility between the polymer and the deck concrete
as well as minimum strength and elongation properties for the polymer.
 Quality control procedures should include pull-out strength, moisture (dryness) tests, and surface
temperature measurements.
 Experience of crews and/or presence of experienced supplier representative are considerations in
quality control.
31
4.MATERIAL SELECTION AND EXPERIMENTAL DESIGN
4.1 Material Selection
A list of available commercial products for thin polymer overlays and crack sealers that are commonly
used in conjunction with polymer overlays is shown in Table 6. Based on the evaluation of available
literature, surveys, and discussions with state DOTs and manufacturers, the research team proposed nine
sets of different products/methods/materials (treatment systems) for testing. These overlay systems were
designated S1 through S9. The research team’s proposed treatment selections were presented to the project
oversight committee and approved. One set of control specimens (without any overlay) were also used
(designated S0). Table 7 shows the various treatments that were tested.
The treatments used included the primary generic polymer types that are commercially available (two
low-modulus epoxy products, an epoxy-urethane, and a polyester styrene). The baseline polymer used
was a low-mod epoxy. Three types of aggregates were used with the baseline polymer: flint rock,
Wisconsin granite, and calcined bauxite. The baseline aggregate used was flint rock. All commercially-
available aggregate types that were used in this study had been graded and prepared by their suppliers for
the purpose of use in thin polymer overlay applications. Treatment S1 had the baseline polymer resin
(epoxy) and the baseline aggregate (flint rock) used in the 2-lift overlay. Treatments S2 and S3 were
designed to compare Wisconsin granite (S2) and calcined bauxite aggregates (S3) with the flint rock
aggregate since all three treatments (S1, S2, and S3) had the same low-mod epoxy resin.
It should be noted that the calcined bauxite aggregates used for high friction surface treatment (HFST) of
pavements are typically required to have a minimum aluminum oxide content of 87% (measured using
procedures in ASTM C25). In general, specifications on thin polymer applications for bridge decks do not
have such a requirement. The calcined bauxite aggregates used in this study had material test reports
indicating compliance with the 87% aluminum oxide requirement. However, energy dispersive X-ray
spectroscopy (SEM/EDS) tests performed after the conclusion of the experimental program indicated
aluminum contents that were below the prescribed limits for HFST.
Treatment S4 had a first layer of the baseline epoxy and a second methacrylate layer. Both layers used
Flint rock as aggregate. Treatment S5 had two layers of the baseline epoxy. However, the second (top)
epoxy layer was modified by adding Flue Gas Desulfurization (FGD) gypsum powder (air dried) at a
weight fraction of 70% of resin. FGD gypsum is a byproduct of burning coal in electric power plants.
Previous research at UWM indicated that such an additive improved mechanical properties of polyesters.
32
Treatment S5 had Flint rock for both layers. Treatment S6 had two layers of an epoxy-urethane resin with
calcined bauxite aggregate as a manufacturer’s choice of aggregate for this product.
Treatment S7 was a pre-mixed polyester-styrene system in which aggregates are pre-mixed with the
polymer and then placed on the surface of concrete. Aggregates were part of the system supplied by the
manufacturer and therefore the aggregate type is not specified in Table 7. This was the only premixed
product used in this research.
Treatment S8 was a polyester multi-lift system. Two layers of polyester resin with flint rock were used.
Finally, Treatment S9 was added to the test program as an additional treatment tested under a separate
contract with the manufacturer. A fourth aggregate type, taconite, was used only in conjunction with the
S9 overlay system since the manufacturer wished to use that aggregate type as part of their system. The
resin type used in S9 was identified as a low-mod epoxy. Additional information on various overlay
products are shown in Table 8.
4.2 Laboratory Testing Procedures
4.2.1 Test Specimens
The laboratory experimental plans included tests to evaluate the effects of freeze-thaw cycles, tire
passages, and heating/cooling/ultraviolet exposure on surface friction, bond to concrete, and
reinforcement corrosion. The test specimens used were concrete blocks with the overall dimensions of 15
in x 15 in x 4 in. The concrete material was a conventional WisDOT mix design for bridge decks.
Specimens includes four No. 5 bars (two at the top layer and two at the bottom layer) as shown in Figure
1. The cover distance to the top surface was 1.0 in. instead of the commonly-used bridge deck cover of 2
in to accelerate chloride penetration during corrosion testing. All specimens were tined (grooved) in
accordance with standard practices.
Figure 2 shows specimen molds before casting concrete, and cast specimens before and after tining their
top surface. All specimens were cured by covering with plastic sheathing for one week. All specimens
were more than 28 days old when overlays were applied.
The total number of test specimens was eighty-four (84). There was one additional slab specimen for each
overlay system to allow pull-off testing and baseline chloride measurements at the beginning of tests.
Initial bond pull-out tests (in accordance with ACI 503R – Appendix A procedures) was conducted within
48 hours of overlay application. Prior to exposure tests, all specimen surfaces (except the top surface)
33
were coated with an epoxy paint so as to limit moisture movements into or out of the specimens except
through the top surface (overlay).
The specimens were grouped and numbered as shown in Table 9. The specimen numbering system
contains information on the overlay system (type of overlay, S1 through S9, with S0 used for control
specimens), extent of pre-existing corrosion/chlorides (Groups A, B, or C), and specimen number (1
through 3). For example, S4-B2 refers to the second specimen with overlay type S4 and moderate
corrosion/chloride exposure condition (Group B).
Table 6. Commercially available products for thin polymer overlays.
Manufacturer Product Trade Name Generic Type Usage
BASF Trafficguard EP35 Epoxy Overlay
Dayton Superior Pro-Poxy Type III Epoxy and Urethane Overlay
Dayton Superior Bridge Seal 75% Epoxy Crack Sealer
International Coating, Inc. ICO Flexi-Coat BD Epoxy Overlay
International Coating, Inc ICO-Gel Epoxy Crack Sealer
Kwik Bond PPC MLS Polyester Overlay
Kwik Bond PPC 1121 MM MIX Polyester premixed Overlay
Poly Carb, Inc. Mark 154 Safe-T-Grid Epoxy Overlay
Poly Carb, Inc. Mark 163 Flexogrid Epoxy and Urethane Overlay
Sika Corporation Sikadur 22 Lo-Mod Epoxy Overlay
Sika Corporation SikaPronto 19 TF Methacrylate Crack Sealer
Sika Corporation Sikadur 55 SLV Epoxy Crack Sealer
TK Products TK 2109 Epoxy Overlay
TK Products TK-2110 Epoxy Crack Sealer
TK Products TK-2414 Methacrylate Crack Sealer
TK Products TK-9030 Urethane/Polyurea Hybrid Crack Sealer
Transpo Transpo T-48 Polysulfide Epoxy Overlay
34
Table 7. Selected Test Products/Methods.
Specimen Product
Broadcast
Aggregate
S0 Control – no overlay system -
S1 low-mod epoxy 1 (2 lifts) flint rock
S2 low-mod epoxy 1 (2 lifts) Wisconsin granite
S3 low-mod epoxy 1 (2 lifts) Calcined bauxite*
S4
low-mod epoxy 1 (1 lift) +
methacrylate (1 lift)
flint rock
S5
low-mod epoxy 1 (1 lift) + low-
mod epoxy 1 augmented with
additive (1 lift)
flint rock
S6 Epoxy-urethane (2 lifts) Calcined bauxite
S7 Polyester styrene (premix) NA
S8 Polyester styrene (2 lifts) flint rock
S9 Low-mod epoxy 2 (2 lifts) Taconite
*This calcined bauxite aggregate did not meet the HFST requirement for aluminum oxide
content.
35
Table 8. Product information provided by suppliers for various polymer overlay products.
Low-mod epoxy 1 A 2-component (1:1 by volume), 100% solids, moisture-tolerant, epoxy resin
binder; tensile strength: 2650 psi, elongation at break: 55%; Shore D hardness:
72; water absorption: <0.2%; compressive modulus: 40,000 psi.
Epoxy-urethane A 2-component (2:1 by volume), 100% solids, epoxy-urethane resin binder;
tensile strength: 2700 psi, elongation at break: 35-45%; Shore D hardness: 55-
75; water absorption: 0.3-0.5%; tensile modulus: 70,000-80,000 psi.
Polyester premixed A polyester-based polymer overlay; tensile strength: >2500 psi; elongation at
break: >35%; system compressive strength: >4000 psi; flexural strength:
>1600 psi.
Polyester multi-lift A hybrid polymer system; tensile strength: 2650-3900 psi; elongation at
break: 30-40%; system compressive strength: >5000 psi; flexural strength:
4000-4600 psi.
Low-mod epoxy 2 A 2-component (1:1 by volume), 100% solids; tensile strength: 2500 psi,
elongation at break: 45%-55%; Shore D hardness: 71; water absorption:
<1.0%.
36
Figure 1. Concrete test specimen (with and without overlay).
37
Figure 2. Concrete specimen preparation.
Table 9. Grouping of test specimens.
Type of treatment Group A Group B Group C
S0 S0-A1 S0-A2 S0-A3
S1 S1-A1 S1-A2 S1-A3 S1-B1 S1-B2 S0-B3 S1-C1 S1-C2 S1-C3
S2 S2-A1 S2-A2 S2-A3 S2-B1 S2-B2 S2-B3 S2-C1 S2-C2 S2-C3
S3 S3-A1 S3-A2 S3-A3 S3-B1 S3-B2 S3-B3 S3-C1 S3-C2 S3-C3
S4 S4-A1 S4-A2 S4-A3 S4-B1 S4-B2 S4-B3 S4-C1 S4-C2 S4-C3
S5 S5-A1 S5-A2 S5-A3 S5-B1 S5-B2 S5-B3 S5-C1 S5-C2 S5-C3
S6 S6-A1 S6-A2 S6-A3 S6-B1 S6-B2 S6-B3 S6-C1 S6-C2 S6-C3
S7 S7-A1 S7-A2 S7-A3 S7-B1 S7-B2 S7-B3 S7-C1 S7-C2 S7-C3
S8 S8-A1 S8-A2 S8-A3 S8-B1 S8-B2 S8-B3 S8-C1 S8-C2 S8-C3
S9 S9-A1 S9-A2 S9-A3 S9-B1 S9-B2 S9-B3 S9-C1 S9-C2 S9-C3
38
4.2.2 Introduction of Initial Chlorides
For each of the nine overlay systems, three different corrosion/chloride exposure levels were considered.
Prior to the application of overlay, the test specimens were divided into three Groups A, B, and C. Group
B and C specimens were subjected to 6% saltwater exposure and an electrical potential of 2 volts between
top and bottom bars (similar to the accelerated corrosion procedures discussed later). Group B and C
specimens were exposed to 1 and 2 weeks of accelerated corrosion exposure, respectively. Each week
consisted of 4 days of wet condition (saltwater on top surface) and 3 days of dry surface conditions
(saltwater removed from top surface) while an external constant voltage of 2 volts was applied. The
application of electrical potential (making top bars anodic) accelerates reinforcing bar corrosion as well
as penetration of chloride ions into the concrete. Figure 3 shows specimens undergoing initial
chloride/accelerated corrosion exposure prior to the start of exposure tests.
The amounts of chlorides (prior to placement of overlays) under Group A, B, and C exposure conditions
were measured on three slab specimens that were dedicated to these destructive chloride tests. Chloride
testing was done using the Rapid Chloride Test (RCT) procedures (Germann Instruments, 2010). The
RCT method has a reported average variation of ±4% with respect to the AASHTO T 260 titration method
(Pritzl et al., 2015).
The measured baseline acid soluble chlorides for specimens with Group A exposure was 0.023% of
concrete mass (0.90 lb/yd3
). The source of this chloride was the concrete ingredients themselves as there
were no external chloride exposures for this group. The average measured acid soluble chlorides within
the top 1 in (25 mm) of test slab in Group B and C specimens were 0.115% and 0.145% of concrete mass,
respectively. Therefore, the average added chlorides within the top 1 in for Group B and C specimens
were 0.092% and 0.122%, respectively. This amount is equivalent to 3.6 and 4.8 lb. per cubic yard of
added chlorides in the top 1 inch of slab for the Groups B and C, respectively. It should be noted that the
chloride levels in the top 1 inch (cover depth) of the test slab specimens is equivalent to the bottom 1 inch
of the depth of cover (directly above the bar) in typical bridge decks with a minimum cover depth of 2 in.
Therefore, Group A specimens had no added chlorides, while Group B and C specimens had ‘moderate’
and ‘high’ initial chloride levels. These groups were meant to represent different ages of concrete at which
times overlays may be applied. Each test treatment/ Chloride group combination had three specimens.
39
Figure 3. Group B and C specimens undergoing initial chloride/accelerated corrosion exposure.
4.2.3 Overlay Applications
Various treatments were applied to the 15 in x 15 in. top surface of all specimens after proper surface
preparations. All manufacturers were invited to observe and monitor installation, and were offered the
opportunity to apply the treatment themselves. Prior to the overlay applications, top surfaces of all
specimens receiving treatments were shot blasted in a blasting cabinet. The steel shots used were S460
shots with a nominal size of 1.19 mm.
Figure 4 shows the general process of application of thin polymer overlay for one of the overlay types.
For the multi-lift (2-layer) systems, the polymer components were first mixed with an electric mixer. The
amount of polymer used in each layer was carefully measured based on the manufacturers’
recommendations. A duct tape was placed around the top surface of the specimen to create a short “dam”
for the polymer resin and aggregate placements. The liquid polymer resin was then placed and spread on
the top surface of concrete. The aggregate was then spread (broadcast) on the “wet” surface until liquid
was no longer visible on the surface. The resin was allowed to harden, and then a shop vacuum machine
was used to remove the extra (un-bonded) aggregates from the surface. The process of mixing and placing
the resin and broadcasting of aggregates was then repeated for a second time. The total thickness of the 2-
layer system was on the order of 3/8 in to ½ in. Figure 5 shows specimens with 2-layer overlays applied
on the top.
In the case of pre-mixed polyester system (S7), aggregates supplied by the manufacturer were mixed with
the polymer before placement on the surface. A primer was first applied on the concrete surface. The
overall thickness of this overlay was on the order of ¾ in. The surface was finished smooth. Figure 6
shows placement of the S7 overlays.
40
Figure 4. Placement of thin polymer overlay on test specimen.
4.2.4 Exposure Rounds
Each specimen was subjected to a sequential series of exposures/tests as shown in Figure 7. After the
application of overlays, all specimens were subjected to three rounds of testing/exposure involving
accelerated corrosion, freeze-thaw cycles, heat/UV/rain cycles, and wear testing (repetitive tire passage),
and a “snow plow” test at the end of round 3 testing. Details of each test component are described below.
41
Figure 5. Multi-lift overlay placements.
Figure 6. Pre-mixed polyester overlay system (S7) placement.
42
Figure 7. Test exposure cycles.
4.2.4.1 Accelerated Corrosion Testing
Corrosion/chloride exposures were achieved through a combination of 6% NaCl salt ponding and
imposition of an electrical potential between anode (top) and cathode bars. This approach has been used
in previous WHRP research resulting in rapid penetration of chlorides and corrosion (Tabatabai et al.,
2010 and Tabatabai et al., 2005).
3 rounds
*
*Snowplow test performed
in the last round only
43
The accelerated corrosion program was designed to test the ability of the polymer overlay and the concrete
block to prevent or limit infiltration of chloride ions (introduced through road salt) and the resulting
corrosion. During the exposure test, chlorides (saltwater) were introduced at the top surface of the samples.
The source of the chlorides in this controlled test was food-grade salt (NaCl) dissolved in water to achieve
a 6% concentration. A constant external potential of 2V was imposed between the two top bars (anode
bars) and the two bottom bars (cathode bars) to accelerate the corrosion process. A regulated power supply
was used to supply the constant voltage to all specimens under accelerated corrosion exposure.
Each set of accelerated corrosion test groups consisted of six specimens. The samples were arrayed in two
rows of three on the testing table. Once the samples were placed in position in the accelerated corrosion
station, rigid plastic sidewalls were installed around the top surface of all six specimens. Silicone caulk
was used to attach rigid plastic walls to the four side walls of the specimen. Silicone caulk was needed to
ensure that saltwater would not leak out from the top surface during testing.
Once the caulk was set, electrical wires were attached to the reinforcing bars within the test specimens.
Each of the bars were pre-drilled at each of its two ends to create a small opening perpendicular to the
axis of the bar. The opening was used to insert a connector (banana plug) and make full electrical contact
between the wires and the reinforcing bars. The surface of the drilled holes was cleaned to ensure proper
electrical connection prior to each accelerated corrosion round. The top bars (anode or corroding bars)
and the bottom bars (cathode or non-corroding bars) were connected to the electrical circuit shown in
Figure 8. The two top bars were connected together and the two bottom bars were similarly connected
together as well (as shown in Figure 9).
The specimens were subjected to 7-days of accelerated corrosion testing in each of the three rounds of
testing. Each week of exposure involved placement of saltwater on the top surface (wet condition) for 4
days followed by removing the saltwater (dry condition) for the remaining three days.
Figure 9 shows the accelerated corrosion testing setup under wet and dry conditions.
44
Figure 8. Accelerated corrosion setup.
45
Figure 9. Accelerated corrosion exposure setup.
4.2.4.2 Freeze-Thaw Cycles
Once the specimens completed each corrosion exposure round, they could begin the freeze-thaw (FT)
phase of testing. The FT exposure subjected the specimens to repeated cycles of freezing and thawing to
assess their effects on the durability and adhesion of the overlays. All specimens were subjected to three
rounds of freeze-thaw cycles. A total of 50 freeze-thaw cycles were applied (two round of 16 cycles each
and last round of 18 cycles).
A specially-designed machine with computer controls (“automated setup”) was used for the freeze-thaw
tests (as well as heat/UV/rain and wear tests) during the first two exposure rounds (Figure 10). The last
round of testing (round 3) involved manually moving carts loaded with specimens into and out of a freeze-
room (“manual setup”) (Figure 11) to achieve the required number of freeze-thaw cycles. A total of three
46
carts were made for the manual setup. The use of the manual procedures was necessary after malfunction
of the automated machine following the completion of the second round of testing.
The automated setup was part of custom-made test machine that was designed and constructed for this
research. The automated machine had six drawers with its three lower drawers dedicated to FT testing.
Each drawer was designed to receive one specimen. The heating/cooling elements were located
underneath the bottom surface of each FT drawer.
Figure 10. Automated computer-controlled machine for FT, HURA and wear testing of specimens.
3 FT drawers
3 HURA
drawers
Wear test
stand
Computer
controller
station
47
Figure 11. One of the three carts used for manual FT testing.
The following procedures were followed using the automated test machine in the first two round of FT
testing:
Automated Procedures (FT Procedure 1) (used in rounds 1 and 2):
• Before beginning of each round, the drawer was cleaned and any loose aggregate or standing water
was removed.
• Four non-metallic washers were placed on the base of the FT drawer as supports for the specimens,
and to ensure that the specimen is slightly off of the bottom.
• The specimen was placed inside the drawer with the top (overlay) surface facing down (Figure
12).
• A temperature sensor was placed on the side concrete surface just adjacent to the overlay. A piece
of insulating foam was placed over the sensor thus wedging the sensor between the insulating foam
and the concrete. This would allow for an accurate reading of the concrete temperature next to the
overlay.
• Approximately one liter of non-salted tap water was poured into the drawer. The water would then
be in contact with the overlay face of the specimen.
• An insulating lid was placed over the specimen inside the drawer.
48
• The desired number of FT cycles was programmed into the controller for each individual drawer.
The temperature range was 10° F to 45 ° F. The machine could complete 3-4 cycles in each day.
Figure 12. FT drawer with specimen placed face-down.
Manual Procedures (FT Procedure 2) (used in Round 3):
• Each of the three shelves on each cart was cleaned and any loose aggregate or standing water was
removed.
• Four non-metallic washers were placed at the base of each shelf as supports for the specimen, and
to ensure that the specimen is slightly off of the bottom of the shelf.
• Specimens were placed on the shelves of the cart with the overlay surface facing down (Figure
11). Each of the three shelves of each cart was a water-tight container that could hold two
specimens.
• Two to three liters of non-salted tap water was placed in the shelves, making sure that there is a
sufficient amount of water to cover the surface aggregates.
• Each cart was rolled into the walk-in freezer room. This room was set at a temperature of -10° F.
• The carts were kept in the freeze-room for 7-8 hours. The specimens were then removed from the
freeze room.
49
• The carts were left to thaw overnight to room temperature, approximately 65°F. One FT cycle was
achieved in each 24-hour day.
4.2.4.3 High Temperature/UV/Rain/Ambient Temperature (HURA)
The High-temperature/UV/rain/ambient temperature (HURA) exposure tests were designed to subject the
overlays to repetitive cycles of heat and ultraviolet light followed by “rain” and cooling down (Figure 13).
This was intended to represent summer exposure situation when rain may follow a hot sunny day. The
peak target concrete temperature during heating was 120º F (at the concrete level directly adjacent to the
overlay). Four UV fluorescent lamps located at the ceiling of each HURA drawer provided ultraviolet
exposure during the heating period. When temperature of concrete reached 120º F, the overlay surface
was rapidly cooled by “rain” (i.e. splashing of water from the drawer’s ceiling) until concrete temperature
fell below 70° F. Heating was provided using elements on the bottom of the drawer. All UV bulbs used
were 25 watt, 18 in, T8 fluorescent tubes (F25T8350BL18).
Figure 13. HURA test cycles: Heat and UV (left), rain and cool down (right).
The automated test machine described in the previous section was also used for the HURA tests (Figure
10). The three upper drawers of the test machine were used in Rounds 1 and 2 of testing. The machine
was set to complete 21 cycles of heating and cooling in each round.
Due to the automated machine’s malfunction after the completion of the second round of HURA tests, a
second manually-controlled box was designed and built for simultaneous testing of nine specimens. The
manual device for HURA testing consisted of a custom designed wood enclosure. Unlike the automated
system, temperature monitoring and release of cooling water was done by a test observer. Figure 14 shows
the manual HURA test box. The removable box top had nine heat lamps (one for each specimen) and 4
50
UV light bulb (the same type as those used in the automated system). In addition to the heat lamps, an
electric heater also provided general heating for the inside of the box through a side access duct. The top
surfaces of the specimens (overlays) were cooled by a system of pipes that sprayed each specimen
individually with tap water to rapidly cool the surface of the overlay.
Figure 14. Manual HURA test box.
Automated Procedures (HURA Procedure 1) (used in Rounds 1 and 2):
• HURA drawers were cleaned and any loose aggregate or standing water was removed.
• Four non-metallic washers were placed on the base of the HURA drawer as supports for the
specimens. This would allow the “rain” water to drain under the specimens when the cooling cycle
was engaged.
• The specimens were placed in the drawer on the washers with the overlay surface facing up
(upright) exposing it to the UV lamps and the water spout.
• A temperature sensor with a splash guard was placed on the side wall of the concrete specimen
adjacent to the overlay. The splash guard was used to prevent water from reaching the temperature
sensor.
• The drawer door was closed and a foam insulation strip was placed over the gap in the drawer.
• Each specimen completed 21 HURA cycles.
51
Manual Procedures (HURA Procedure 2) (used in Round 3 only):
• Nine specimens were placed inside the box and the lid was closed.
• All lamps and the electric heater were turned on.
• Once the specimen temperature (on the side wall concrete adjacent to the overlay) reached 120
degrees, the lamps were turned off and the lid was removed.
• The cooling pipe system was placed over the box and tap water was turned on. The water was
allowed to cool the specimens for roughly 10 minutes until the temperature reading reduced to
approximately 70 degrees.
• The process was repeated 21 times.
• Each manual cycle took roughly 1 hour and 45 minutes.
4.2.4.4 Wear Tests
The wear test was designed to simulate the effects of vehicle tire wear on the roadway surface. A three-
wheel machine for wear testing of asphalt pavements was originally developed at the National Center for
Asphalt Technology (NCAT) and later refined at Auburn University (Erukulla, 2011) (Figure 15). The
UWM wear test machine, which was designed for this study (Figures 16 and 17), is a modified version of
the NCAT machine. The UWM machine was built into the automated test machine shown in Figure 10.
The UWM wear test machine consists of three rotating tires arranged in a circular pattern with a diameter
of 12 in (i.e. the diameter of the centerline of tire path circle was 12 in.). The wheels (tires) were 10-in
diameter, non-flattening, solid rubber tires with a nominal load capacity of 350 lbs. The wear machine has
an adjustable speed control. A speed of 30 rpm was used for all tests performed in this research. Each
round of wear testing included 11,000 turns (33,000 tire passages). The total number of tire passages for
the three rounds of testing was 99,000.
During testing, the specimen is placed in an aluminum container, which acts as a cart that can move
horizontally along the length of the machine. The cart can ride on a set of horizontal bearings on the top
surface of the machine. The cart is first moved away from underneath the wear device head to allow
placement of the specimen. The cart (and the specimen) is then horizontally slid to a position directly
under the wear device. The cart is then locked in place so that it would not move during wear tests.
The machine head can be raised or lowered (on a linear bearing) using a pneumatic system. When the air
pressure (holding the wear device up) is reduced to zero during testing, the weight of the entire wear
52
device is supported on the three tires that are placed on the specimen. The total weight of the wear device
head was 114.4 lbs. The top surfaces of specimens were kept wet during the entire period of testing (using
dripping tap water). Before the start of testing (Round 0) and after each completed round, the friction
coefficient for the tire passage on the specimens was measured. Procedures for measuring the friction
coefficients are described in Section 4.2.4.5.
The following procedures were used for wear testing:
• The specimen was placed on the friction cart (face up) directly under the wear device and
secured tightly in place. The cart was also locked in place.
• Water was used to wet the top surface of the specimen, and the wear test apparatus (and tires)
was lowered onto the specimen (by releasing the air pressure). The central position of the
apparatus with respect to the specimen was verified (and changed if necessary). At this stage,
the full weight of the apparatus was on the sample.
• The machine controller was set to perform 11,000 turns (3 tire passages per each of the 11,000
turns equals 33,000 tire passages). The speed of the turns was set at 30 rpm.
• The water supply was adjusted to achieve a steady water drip onto the top surface to maintain
the surface in a wet condition for the entire duration of the test.
• When the 11000 turns were completed, the specimen cart was slid away from under the tires
and the top surface of the block was cleaned with a soft brush and water to remove any tire
residue that may have accumulated.
• One of the three tires was removed from the head apparatus, and the friction test hardware was
inserted in its place. The electrical wires from the test hardware were then plugged in.
• The specimen was examined for on any cracks, delamination, or other changes that may have
occurred during the previous round of testing.
• The specimen cart was slid back under the head apparatus and locked in place. The friction test
wheel was then lowered onto the surface of the specimen.
• The computer data acquisition system designed to capture load cell (torque) data due to friction
was turned on, and the friction test wheel brake assembly was powered.
• The wear test machine was turned on to start the turning of the friction wheel assembly.
• A control button was used to temporarily lock the brakes on the friction wheel. This button
was pressed 12 times or more at approximately 5 second intervals. High-speed force readings
were made using the data acquisition system.
53
• The specimen was then removed from the test machine, and the data were recorded for further
analysis.
Figure 15. Three-Wheel Polishing Device (TWPD) developed by National Center for Asphalt Technology
(NCAT) (Erukulla, 2011).
Figure 16. UWM-designed wear test device (conceptual drawing).
12-06 Final Report PDF

More Related Content

Viewers also liked

Mujeres predicadoras prohibido en la biblia
Mujeres predicadoras prohibido en la bibliaMujeres predicadoras prohibido en la biblia
Mujeres predicadoras prohibido en la biblia
Milton Camargo
 
Drennan and Alred (Eds) Ch 1 'Secure Recovery' (2012)
Drennan and Alred (Eds) Ch 1 'Secure Recovery' (2012)Drennan and Alred (Eds) Ch 1 'Secure Recovery' (2012)
Drennan and Alred (Eds) Ch 1 'Secure Recovery' (2012)
Andrew Voyce MA
 
Northwest Indian Fisheries Commission Annual Report 2015
Northwest Indian Fisheries Commission Annual Report 2015Northwest Indian Fisheries Commission Annual Report 2015
Northwest Indian Fisheries Commission Annual Report 2015
Northwest Indian Fisheries Commission
 
2010 Annual Report
2010 Annual Report2010 Annual Report
Notiplastic abril 2015
Notiplastic abril 2015Notiplastic abril 2015
Notiplastic abril 2015
avipla
 
El cuerno pequeño
El cuerno pequeñoEl cuerno pequeño
El cuerno pequeño
asociacion
 
Revista Plural UnP
Revista Plural UnPRevista Plural UnP
Revista Plural UnP
Daniel Freire
 
Cómo lucran las universidades que por ley no deben lucrar
Cómo lucran las universidades que por ley no deben lucrarCómo lucran las universidades que por ley no deben lucrar
Cómo lucran las universidades que por ley no deben lucrar
Roberto Manriquez
 
Talent Moves_April - August 2013_PlenumGroup
Talent Moves_April - August 2013_PlenumGroupTalent Moves_April - August 2013_PlenumGroup
Talent Moves_April - August 2013_PlenumGroup
PlenumGroupResearch
 
curso de iniciación a la biblia (Arabia)
 curso de iniciación a la biblia (Arabia) curso de iniciación a la biblia (Arabia)
curso de iniciación a la biblia (Arabia)
Milton Camargo
 
36th Annual African Literature Association Conference The ...
36th Annual African Literature Association Conference The ...36th Annual African Literature Association Conference The ...
36th Annual African Literature Association Conference The ...
butest
 
Substance Abuse Gladwin, Michigan
Substance Abuse Gladwin, MichiganSubstance Abuse Gladwin, Michigan
Substance Abuse Gladwin, Michigan
recoveryrestart2
 
kp.book_spreads_FINAL
kp.book_spreads_FINALkp.book_spreads_FINAL
kp.book_spreads_FINAL
Bob Gray
 
Convocatoria congreso-smg-2011
Convocatoria congreso-smg-2011Convocatoria congreso-smg-2011
Convocatoria congreso-smg-2011
CiberGeneticaUNAM
 
Guia digital UniNorte
Guia digital UniNorteGuia digital UniNorte
Guia digital UniNorte
Centro Universitário do Norte
 
¿Cómo animar a leer a los niños y no morir en el intento? Propuestas de activ...
¿Cómo animar a leer a los niños y no morir en el intento? Propuestas de activ...¿Cómo animar a leer a los niños y no morir en el intento? Propuestas de activ...
¿Cómo animar a leer a los niños y no morir en el intento? Propuestas de activ...
Elisa Yuste
 
FT - HOW TO SPEND IT MAGAZINE
FT - HOW TO SPEND IT MAGAZINEFT - HOW TO SPEND IT MAGAZINE
FT - HOW TO SPEND IT MAGAZINE
Fabio Immediato (www.fabioimmediato.com)
 

Viewers also liked (18)

Mujeres predicadoras prohibido en la biblia
Mujeres predicadoras prohibido en la bibliaMujeres predicadoras prohibido en la biblia
Mujeres predicadoras prohibido en la biblia
 
Drennan and Alred (Eds) Ch 1 'Secure Recovery' (2012)
Drennan and Alred (Eds) Ch 1 'Secure Recovery' (2012)Drennan and Alred (Eds) Ch 1 'Secure Recovery' (2012)
Drennan and Alred (Eds) Ch 1 'Secure Recovery' (2012)
 
Northwest Indian Fisheries Commission Annual Report 2015
Northwest Indian Fisheries Commission Annual Report 2015Northwest Indian Fisheries Commission Annual Report 2015
Northwest Indian Fisheries Commission Annual Report 2015
 
2010 Annual Report
2010 Annual Report2010 Annual Report
2010 Annual Report
 
Notiplastic abril 2015
Notiplastic abril 2015Notiplastic abril 2015
Notiplastic abril 2015
 
El cuerno pequeño
El cuerno pequeñoEl cuerno pequeño
El cuerno pequeño
 
Revista Plural UnP
Revista Plural UnPRevista Plural UnP
Revista Plural UnP
 
Cómo lucran las universidades que por ley no deben lucrar
Cómo lucran las universidades que por ley no deben lucrarCómo lucran las universidades que por ley no deben lucrar
Cómo lucran las universidades que por ley no deben lucrar
 
Talent Moves_April - August 2013_PlenumGroup
Talent Moves_April - August 2013_PlenumGroupTalent Moves_April - August 2013_PlenumGroup
Talent Moves_April - August 2013_PlenumGroup
 
curso de iniciación a la biblia (Arabia)
 curso de iniciación a la biblia (Arabia) curso de iniciación a la biblia (Arabia)
curso de iniciación a la biblia (Arabia)
 
Standard briefing
Standard briefingStandard briefing
Standard briefing
 
36th Annual African Literature Association Conference The ...
36th Annual African Literature Association Conference The ...36th Annual African Literature Association Conference The ...
36th Annual African Literature Association Conference The ...
 
Substance Abuse Gladwin, Michigan
Substance Abuse Gladwin, MichiganSubstance Abuse Gladwin, Michigan
Substance Abuse Gladwin, Michigan
 
kp.book_spreads_FINAL
kp.book_spreads_FINALkp.book_spreads_FINAL
kp.book_spreads_FINAL
 
Convocatoria congreso-smg-2011
Convocatoria congreso-smg-2011Convocatoria congreso-smg-2011
Convocatoria congreso-smg-2011
 
Guia digital UniNorte
Guia digital UniNorteGuia digital UniNorte
Guia digital UniNorte
 
¿Cómo animar a leer a los niños y no morir en el intento? Propuestas de activ...
¿Cómo animar a leer a los niños y no morir en el intento? Propuestas de activ...¿Cómo animar a leer a los niños y no morir en el intento? Propuestas de activ...
¿Cómo animar a leer a los niños y no morir en el intento? Propuestas de activ...
 
FT - HOW TO SPEND IT MAGAZINE
FT - HOW TO SPEND IT MAGAZINEFT - HOW TO SPEND IT MAGAZINE
FT - HOW TO SPEND IT MAGAZINE
 

Similar to 12-06 Final Report PDF

FHWA Steel Bridge Design Handbook Volume 19
FHWA Steel Bridge Design Handbook Volume 19 FHWA Steel Bridge Design Handbook Volume 19
FHWA Steel Bridge Design Handbook Volume 19
Walid Alaywan
 
AASHTO Steel Bridge Design Handbook Volume 12
AASHTO Steel Bridge Design Handbook Volume 12 AASHTO Steel Bridge Design Handbook Volume 12
AASHTO Steel Bridge Design Handbook Volume 12
Walid Alaywan
 
IRJET- Study on Causes of Cracks and its Remedial Measures in Reinforced Conc...
IRJET- Study on Causes of Cracks and its Remedial Measures in Reinforced Conc...IRJET- Study on Causes of Cracks and its Remedial Measures in Reinforced Conc...
IRJET- Study on Causes of Cracks and its Remedial Measures in Reinforced Conc...
IRJET Journal
 
Experimental Evaluation of Durability Indices for Medium Strength Concrete Co...
Experimental Evaluation of Durability Indices for Medium Strength Concrete Co...Experimental Evaluation of Durability Indices for Medium Strength Concrete Co...
Experimental Evaluation of Durability Indices for Medium Strength Concrete Co...
IRJET Journal
 
IRJET - Design, Simulation of Loadcells for Commercial Vehicles
IRJET - Design, Simulation of Loadcells for Commercial VehiclesIRJET - Design, Simulation of Loadcells for Commercial Vehicles
IRJET - Design, Simulation of Loadcells for Commercial Vehicles
IRJET Journal
 
Tb 1500b
Tb 1500bTb 1500b
Anti-Icing and De-Icing Superhydrophobic Concrete to Improve the Safety on Cr...
Anti-Icing and De-Icing Superhydrophobic Concrete to Improve the Safety on Cr...Anti-Icing and De-Icing Superhydrophobic Concrete to Improve the Safety on Cr...
Anti-Icing and De-Icing Superhydrophobic Concrete to Improve the Safety on Cr...
Awais44108
 
Pavement Preservation - Novel Lithium Densifier surface hardener
Pavement Preservation - Novel Lithium Densifier surface hardenerPavement Preservation - Novel Lithium Densifier surface hardener
Pavement Preservation - Novel Lithium Densifier surface hardener
Claudio Manissero
 
AASHTO Steel Bridge Design Handbook Volume 09
AASHTO Steel Bridge Design Handbook Volume 09 AASHTO Steel Bridge Design Handbook Volume 09
AASHTO Steel Bridge Design Handbook Volume 09
Walid Alaywan
 
FHWA Steel Bridge Design Handbook Volume 14
FHWA Steel Bridge Design Handbook Volume 14 FHWA Steel Bridge Design Handbook Volume 14
FHWA Steel Bridge Design Handbook Volume 14
Walid Alaywan
 
The Monster Eating Your Rigs
The Monster Eating Your RigsThe Monster Eating Your Rigs
The Monster Eating Your Rigs
purdywest
 
Investigation And Analysis of Traffic Flow Capacity And Level of Service Dete...
Investigation And Analysis of Traffic Flow Capacity And Level of Service Dete...Investigation And Analysis of Traffic Flow Capacity And Level of Service Dete...
Investigation And Analysis of Traffic Flow Capacity And Level of Service Dete...
IRJET Journal
 
00081 (see pg 71).pdf
00081 (see pg 71).pdf00081 (see pg 71).pdf
00081 (see pg 71).pdf
Rajesh Bhurke
 
AASHTO Steel Bridge Design Handbook Volume 06 Stringer Bridges
AASHTO Steel Bridge Design Handbook Volume 06 Stringer BridgesAASHTO Steel Bridge Design Handbook Volume 06 Stringer Bridges
AASHTO Steel Bridge Design Handbook Volume 06 Stringer Bridges
Walid Alaywan
 
Mechanical and Statistical Study of Seawater Mixed Concrete
Mechanical and Statistical Study of Seawater Mixed ConcreteMechanical and Statistical Study of Seawater Mixed Concrete
Mechanical and Statistical Study of Seawater Mixed Concrete
IRJET Journal
 
AASHTO Steel Bridge Design Handbook Volume 04
AASHTO Steel Bridge Design Handbook Volume 04AASHTO Steel Bridge Design Handbook Volume 04
AASHTO Steel Bridge Design Handbook Volume 04
Walid Alaywan
 
Effect of admixtures on shrinkage properties in self compacting concrete
Effect of admixtures on shrinkage properties in self compacting concreteEffect of admixtures on shrinkage properties in self compacting concrete
Effect of admixtures on shrinkage properties in self compacting concrete
eSAT Journals
 
Longitudinal Channelizing Devices
Longitudinal Channelizing DevicesLongitudinal Channelizing Devices
Longitudinal Channelizing Devices
Ryan Sueoka
 
Retractable Road Reflector
Retractable Road ReflectorRetractable Road Reflector
Retractable Road Reflector
Lassonde Institute
 
FULLTEXT01(5).pdf
FULLTEXT01(5).pdfFULLTEXT01(5).pdf
FULLTEXT01(5).pdf
dmehary
 

Similar to 12-06 Final Report PDF (20)

FHWA Steel Bridge Design Handbook Volume 19
FHWA Steel Bridge Design Handbook Volume 19 FHWA Steel Bridge Design Handbook Volume 19
FHWA Steel Bridge Design Handbook Volume 19
 
AASHTO Steel Bridge Design Handbook Volume 12
AASHTO Steel Bridge Design Handbook Volume 12 AASHTO Steel Bridge Design Handbook Volume 12
AASHTO Steel Bridge Design Handbook Volume 12
 
IRJET- Study on Causes of Cracks and its Remedial Measures in Reinforced Conc...
IRJET- Study on Causes of Cracks and its Remedial Measures in Reinforced Conc...IRJET- Study on Causes of Cracks and its Remedial Measures in Reinforced Conc...
IRJET- Study on Causes of Cracks and its Remedial Measures in Reinforced Conc...
 
Experimental Evaluation of Durability Indices for Medium Strength Concrete Co...
Experimental Evaluation of Durability Indices for Medium Strength Concrete Co...Experimental Evaluation of Durability Indices for Medium Strength Concrete Co...
Experimental Evaluation of Durability Indices for Medium Strength Concrete Co...
 
IRJET - Design, Simulation of Loadcells for Commercial Vehicles
IRJET - Design, Simulation of Loadcells for Commercial VehiclesIRJET - Design, Simulation of Loadcells for Commercial Vehicles
IRJET - Design, Simulation of Loadcells for Commercial Vehicles
 
Tb 1500b
Tb 1500bTb 1500b
Tb 1500b
 
Anti-Icing and De-Icing Superhydrophobic Concrete to Improve the Safety on Cr...
Anti-Icing and De-Icing Superhydrophobic Concrete to Improve the Safety on Cr...Anti-Icing and De-Icing Superhydrophobic Concrete to Improve the Safety on Cr...
Anti-Icing and De-Icing Superhydrophobic Concrete to Improve the Safety on Cr...
 
Pavement Preservation - Novel Lithium Densifier surface hardener
Pavement Preservation - Novel Lithium Densifier surface hardenerPavement Preservation - Novel Lithium Densifier surface hardener
Pavement Preservation - Novel Lithium Densifier surface hardener
 
AASHTO Steel Bridge Design Handbook Volume 09
AASHTO Steel Bridge Design Handbook Volume 09 AASHTO Steel Bridge Design Handbook Volume 09
AASHTO Steel Bridge Design Handbook Volume 09
 
FHWA Steel Bridge Design Handbook Volume 14
FHWA Steel Bridge Design Handbook Volume 14 FHWA Steel Bridge Design Handbook Volume 14
FHWA Steel Bridge Design Handbook Volume 14
 
The Monster Eating Your Rigs
The Monster Eating Your RigsThe Monster Eating Your Rigs
The Monster Eating Your Rigs
 
Investigation And Analysis of Traffic Flow Capacity And Level of Service Dete...
Investigation And Analysis of Traffic Flow Capacity And Level of Service Dete...Investigation And Analysis of Traffic Flow Capacity And Level of Service Dete...
Investigation And Analysis of Traffic Flow Capacity And Level of Service Dete...
 
00081 (see pg 71).pdf
00081 (see pg 71).pdf00081 (see pg 71).pdf
00081 (see pg 71).pdf
 
AASHTO Steel Bridge Design Handbook Volume 06 Stringer Bridges
AASHTO Steel Bridge Design Handbook Volume 06 Stringer BridgesAASHTO Steel Bridge Design Handbook Volume 06 Stringer Bridges
AASHTO Steel Bridge Design Handbook Volume 06 Stringer Bridges
 
Mechanical and Statistical Study of Seawater Mixed Concrete
Mechanical and Statistical Study of Seawater Mixed ConcreteMechanical and Statistical Study of Seawater Mixed Concrete
Mechanical and Statistical Study of Seawater Mixed Concrete
 
AASHTO Steel Bridge Design Handbook Volume 04
AASHTO Steel Bridge Design Handbook Volume 04AASHTO Steel Bridge Design Handbook Volume 04
AASHTO Steel Bridge Design Handbook Volume 04
 
Effect of admixtures on shrinkage properties in self compacting concrete
Effect of admixtures on shrinkage properties in self compacting concreteEffect of admixtures on shrinkage properties in self compacting concrete
Effect of admixtures on shrinkage properties in self compacting concrete
 
Longitudinal Channelizing Devices
Longitudinal Channelizing DevicesLongitudinal Channelizing Devices
Longitudinal Channelizing Devices
 
Retractable Road Reflector
Retractable Road ReflectorRetractable Road Reflector
Retractable Road Reflector
 
FULLTEXT01(5).pdf
FULLTEXT01(5).pdfFULLTEXT01(5).pdf
FULLTEXT01(5).pdf
 

12-06 Final Report PDF

  • 2. Evaluation of Thin Polymer Overlays for Bridge Decks Habib Tabatabai Konstantin Sobolev Al Ghorbanpoor Azam Nabizadeh Chin-Wei Lee Matthias Lind University of Wisconsin-Milwaukee WisDOT ID no. 0092-12-06 July 2016
  • 3. 1 DISCLAIMER This research was funded through the Wisconsin Highway Research Program by the Wisconsin Department of Transportation and the Federal Highway Administration under Project # 0092-12-06. The contents of this report reflect the views of the authors who are responsible for the facts and the accuracy of the data presented herein. The contents do not necessarily reflect the official views of the Wisconsin Department of Transportation or the Federal Highway Administration at the time of publication. This document is disseminated under the sponsorship of the Department of Transportation in the interest of information exchange. The United States Government assumes no liability for its contents or use thereof. This report does not constitute a standard, specification, or regulation. The United States Government does not endorse products or manufacturers. Trade and manufacturers’ names appear in this report only because they are considered essential to the object of the document.
  • 4. 2 TECHNICAL REPORT DOCUMENTATION PAGE 1. Report No. 2. Government Accession No 3. Recipient’s Catalog No 4. Title and Subtitle Evaluation of Thin Polymer Overlays for Bridge Decks 5. Report Date July 2016 6. Performing Organization Code 7. Authors Habib Tabatabai, Konstantin Sobolev, Al Ghorbanpoor, Azam Nabizadeh, Chin-Wei Lee, and Matthias Lind 8. Performing Organization Report No. 9. Performing Organization Name and Address Department of Civil and Environmental Engineering University of Wisconsin-Milwaukee 3200 North Cramer Street, Milwaukee, WI 53211 10. Work Unit No. (TRAIS) 11. Contract or Grant No. 0092-12-06 12. Sponsoring Agency Name and Address Wisconsin Department of Transportation Research & Library Unit 4802 Sheboygan Avenue, Rm 104 Madison, WI 53707 13. Type of Report and Period Covered 14. Sponsoring Agency Code 15. Supplementary Notes 16. Abstract Deterioration of concrete bridge decks is a major maintenance concern particularly in the northern snow-belt regions where deicing salt is used to maintain traffic during winter months. Overlays and sealers have long been utilized in protection and repair strategies for bridge decks. Polymer overlays are used on decks to reduce the penetration of chloride ions (and the resulting corrosion) and to improve skid resistance (increase friction). Because of their small thicknesses (generally 0.25 to 0.75 in), polymer overlays impose less additional dead weight and can be applied more rapidly compared to other types of overlay. The objectives of this research project were to explore the effectiveness and durability of thin polymer overlays with respect to restoring and protecting bridge decks, improving safety, and extending service life; to assess and compare performance of selected thin polymer overlay systems under laboratory test conditions; and to suggest appropriate bridge deck maintenance strategies related to this research. An experimental research program was performed to study and compare the performance of nine different overlay systems. Reinforced concrete slab specimens were subjected to accelerated corrosion, freeze- thaw cycling, heat/ultraviolet/rain cycles, and tire wear tests (including “snow plow” application). The overlay system with an epoxy resin and flint rock aggregate provided the best overall performance based on performance indices determined for friction coefficient, corrosion mass loss, pull-out strength and surface deformation (rut) due to tire passage. The polyester multi-lift overlay system delaminated from the concrete surface in all nine specimens utilizing that overlay type. The addition of polymer overlays does not significantly reduce corrosion mass loss in bridge decks with high levels of chloride contamination. Recommended guidelines for maintenance of bridge decks are provided. 17. Key Words Bridge decks, corrosion, friction, overlays, thin polymer overlay, durability 18. Distribution Statement No restriction. This document is available to the public through the National Technical Information Service 5285 Port Royal Road Springfield VA 22161 19. Security Classif. (of this report) Unclassified 19. Security Classif. (of this page) Unclassified 20. No. of Pages 100 21. Price 0092-12-06
  • 5. 3 Table of Contents ACKNOWLEDGEMENTS........................................................................................................................ 6 DISCLAIMER ............................................................................................................................................ 7 TECHNICAL REPORT DOCUMENTATION PAGE.............................................................................. 8 EXECUTIVE SUMMARY ........................................................................................................................ 9 1.0 INTRODUCTION .............................................................................................................................. 12 1.1 Background..................................................................................................................................... 12 Overlays ............................................................................................................................................ 12 Sealers............................................................................................................................................... 14 1.2 Objectives and Scope...................................................................................................................... 15 2.0 LITERATURE REVIEW ................................................................................................................... 16 3.0 SURVEY RESULTS .......................................................................................................................... 19 3.1 Previous Surveys (by Others) ......................................................................................................... 19 3.2 State Survey Results – This Study.................................................................................................. 26 3.3 Supplier Survey Results – This Study ............................................................................................ 28 3.4 Summary of Survey Results ........................................................................................................... 30 4.MATERIAL SELECTION AND EXPERIMENTAL DESIGN ........................................................... 31 4.1 Material Selection ........................................................................................................................... 31 4.2 Laboratory Testing Procedures....................................................................................................... 32 4.2.1 Test Specimens ........................................................................................................................ 32 4.2.2 Introduction of Initial Chlorides .............................................................................................. 38 4.2.3 Overlay Applications ............................................................................................................... 39 4.2.4 Exposure Rounds ..................................................................................................................... 40 4.2.5 Tests and Measurements.......................................................................................................... 56 4.3 Field Testing ................................................................................................................................... 63 5.0 EXPERIMENTAL RESULTS............................................................................................................ 69 5.1 Pull-Out Test Results...................................................................................................................... 69 5.1.1 Initial (baseline or Round 0) Pull-Out Strength....................................................................... 69 5.1.2 Final Pull-Out Strength............................................................................................................ 70 5.1.3 Discussion of Pull-Out Results................................................................................................ 73 5.2 Friction Test Results ....................................................................................................................... 73 5.2.1 Initial Friction Results.............................................................................................................. 73 5.2.2 Final Friction Results............................................................................................................... 74 5.2.3 Discussion of Friction Results ................................................................................................. 77 5.3 Corrosion Test Results.................................................................................................................... 78
  • 6. 4 5.3.1 Final Corrosion Results............................................................................................................ 78 5.3.3 Discussion of Corrosion Results.............................................................................................. 81 5.4 Surface Profile Results.................................................................................................................... 81 5.4.1 Final Surface Profile Results ................................................................................................... 81 5.4.2 Discussion of Surface Profile Results...................................................................................... 83 5.5 Overall Analysis of Laboratory Results.......................................................................................... 84 5.5.1 Indexed Final Results............................................................................................................... 84 5.5.3 Observations on the Laboratory Test Results .......................................................................... 89 5.6 Field Tests – Initial Friction Results............................................................................................... 91 5.6.1 Initial BPT results .................................................................................................................... 91 5.6.2 Failure of an Overlay System .................................................................................................. 91 6.0 CONCLUSIONS AND RECOMMENDATIONS ............................................................................. 92 6.1 Summary and Conclusions ............................................................................................................. 92 6.2 Recommended Guidelines .............................................................................................................. 95 7.0 REFERENCES ................................................................................................................................... 98
  • 7. 5 List of Figures Figure 1. Concrete test specimen (with and without overlay). ................................................................. 36 Figure 2. Concrete specimen preparation. ................................................................................................ 37 Figure 3. Group B and C specimens undergoing initial chloride/accelerated corrosion exposure........... 39 Figure 4. Placement of thin polymer overlay on test specimen................................................................ 40 Figure 5. Multi-lift overlay placements. ................................................................................................... 41 Figure 6. Pre-mixed polyester overlay system (S7) placement. ............................................................... 41 Figure 7. Test exposure cycles.................................................................................................................. 42 Figure 8. Accelerated corrosion setup. ..................................................................................................... 44 Figure 9. Accelerated corrosion exposure setup....................................................................................... 45 Figure 10. Automated computer-controlled machine for FT, HURA and wear testing of specimens. .... 46 Figure 11. One of the three carts used for manual FT testing................................................................... 47 Figure 12. FT drawer with specimen placed face-down........................................................................... 48 Figure 13. HURA test cycles: Heat and UV (left), rain and cool down (right)........................................ 49 Figure 14. Manual HURA test box........................................................................................................... 50 Figure 15. Three-Wheel Polishing Device (TWPD) developed by National Center for Asphalt Technology (NCAT) (Erukulla, 2011). .................................................................................................... 53 Figure 16. UWM-designed wear test device (conceptual drawing). ........................................................ 53 Figure 17. UWM-designed wear test device............................................................................................. 54 Figure 18. Dimension of the “snow plow” using in Round 3 wear test.................................................... 55 Figure 19. “Snow plow” assembly installed between two tires................................................................ 56 Figure 20. British Pendulum Tester used on specimens prior to exposure tests....................................... 57 Figure 21. Friction measuring system for the UWM wear test machine.................................................. 58 Figure 22. Typical friction sensor output.................................................................................................. 58 Figure 23. Coring drill setup..................................................................................................................... 60 Figure 24. Schematic layout of sample coring locations after the end of exposure tests. ........................ 60 Figure 25. Pull-out test device. ................................................................................................................. 61 Figure 26. Measurement of the depth of surface groove (rut) through a dial gage at measurement points defined using a wooden template.............................................................................................................. 62 Figure 27. Marquette Interchange ramp prior to application of overlays (transverse cracking of the deck is observed)............................................................................................................................................... 64 Figure 28. Cross section of Marquette Interchange ramp (from WisDOT project drawing). .................. 65 Figure 29. Friction testing using BPT....................................................................................................... 65 Figure 30. Placement of resin and aggregate on a 2-lift overlay system. ................................................. 66 Figure 31. Marquette Interchange ramp after placement of four different thin polymer overlay systems (A through D)............................................................................................................................................ 66 Figure 32. Four different thin polymer overlay test sections (A, B, C, and D) on the Marquette Interchange ramp (from WisDOT). .......................................................................................................... 66 Figure 33. Section A drawing (from WisDOT)........................................................................................ 67 Figure 34. Section B drawing (from WisDOT). ....................................................................................... 67 Figure 35. Section C drawing (from WisDOT). ....................................................................................... 68 Figure 36. Section D drawing (from WisDOT)........................................................................................ 68 Figure 37. Average initial pull-out strength (baseline)............................................................................. 70 Figure 38. Average final pull-out strength of all groups. ......................................................................... 72 Figure 39. Pictures of delaminated overlay from a S8 specimen: top surface (left), bottom surface (right). ................................................................................................................................................................... 72 Figure 40. Average final pull-out strength for groups A, B, and C. ......................................................... 73 Figure 41. Initial average coefficients of friction for all groups at Round 0. ........................................... 74
  • 8. 6 Figure 42. Average coefficient of friction for all groups at round 3......................................................... 75 Figure 43. Coefficient of friction for groups A, B, and Cat Round 3....................................................... 76 Figure 44. Average coefficient of friction for all groups at round 0, 1, 2, and 3...................................... 77 Figure 45. Projected coefficients of friction for various overlay types. ................................................... 79 Figure 46. Average corrosion mass loss for all groups............................................................................. 80 Figure 47. Average corrosion mass loss for Groups A, B, and C............................................................. 81 Figure 48. Surface profile average for all groups of overlay types. ......................................................... 83 Figure 49. Average surface profile for groups A, B, and C...................................................................... 83 Figure 50. Overlay Performance Index (I4) - Combined pull-out strength, friction, corrosion, and surface profile indices............................................................................................................................................ 87 Figure 51. Overlay Performance Index (I3) - Including pull-out strength, friction, and corrosion indices. ................................................................................................................................................................... 88 Figure 52. Overlay Performance Index (I2) - Including pull-out strength, and friction indices. .............. 89 Figure 53. Delaminated multi-lift polyester overlay (from the Marquette Interchange ramp)................. 91
  • 9. 7 List of Tables Table 1. Summary of Survey Results from NCHRP Synthesis Report 423 (Fowler and Whitney, 2011). ................................................................................................................................................................... 22 Table 2. Reasons for selection of Polymer overlays (Krauss et al., 2009). .............................................. 24 Table 3. Deck conditions that can be addressed by polymer overlays (Krauss et al, 2009)..................... 25 Table 4. Surface preparation techniques in polymer overlays (Krauss et al, 2009). ................................ 26 Table 5. Surface evaluation prior to installing polymer overlays (Krauss et al, 2009). ........................... 26 Table 6. Commercially available products for thin polymer overlays...................................................... 33 Table 7. Selected Test Products/Methods................................................................................................. 34 Table 8. Product information provided by suppliers for various polymer overlay products.................... 35 Table 9. Grouping of test specimens......................................................................................................... 37 Table 10. Description of polymer overlay types used on Marquette Interchange ramp........................... 64 Table 11. Initial (baseline) results of pull-out tests................................................................................... 69 Table 12. Final average pull-out strength for all groups........................................................................... 71 Table 13. Final average pull-out strength for groups A, B, and, C........................................................... 71 Table 14. Initial (Round 0) average coefficient of friction of all groups.................................................. 74 Table 15. Final coefficient of friction (Round 3) values for groups A, B, and C..................................... 75 Table 16. Average coefficient of friction for all groups at round 0, 1, 2, and 3. ...................................... 76 Table 17. Parameters for Modified Exponential Fit-Curve. ..................................................................... 78 Table 18. Average corrosion mass losses and standard deviations for Groups A, B, and C.................... 79 Table 19. Average corrosion mass losses and standard deviations for all specimen groups.................... 80 Table 20. Average surface deformations for groups A, B, and C............................................................. 82 Table 21. Average surface deformations of all groups............................................................................. 82 Table 22. Index values for pull-out strength............................................................................................. 85 Table 23. Index values for coefficient of friction results.......................................................................... 85 Table 24. Index values for corrosion mass loss. ....................................................................................... 86 Table 25. Index values for surface profile results..................................................................................... 86 Table 26. Combined performance index I4 – Combined pull-out strength, friction,................................ 87 Table 27. Combined performance index I3 – Combined pull-out strength, friction,................................ 88 Table 28. Combined performance index I2 – Combined pull-out strength, and friction. ......................... 89 Table 29. Summary of best (highest) and worst (lowest) performance Indices. ...................................... 90 Table 30. Summary of best and worst indices in graphical form. ............................................................ 90 Table 31. Average Friction Test Results Using British Pendulum Tester................................................ 91 Table 32. Summary of Experimental Results ........................................................................................... 93
  • 10. 8 ACKNOWLEDGEMENTS The project team appreciates the support of the Wisconsin Highway Research Program (WHRP) in sponsoring this research project. We especially thank Mr. William Oliva, Mr. Travis McDaniel, and Mr. David Bohnsack of the Wisconsin Department of Transportation and other members of the project oversight committee for their help and input. Funding for the tests on one of the nine overlay systems discussed in this report was provided by Dow Poly Carb, Inc. Special thanks are due to the many staff members and students at the University of Wisconsin- Milwaukee who helped with this project including Rahim Reshadi, Brian Mullen, Ali Ehsan Ali, Kenneth Sosinski, Jorge Henrique Lima Reis, Marinara Andrade Do Nascimento, Sam Rusch, and Tye Rodriguez.
  • 11. 9 EXECUTIVE SUMMARY Deterioration of concrete bridge decks is a major maintenance concern particularly in the northern snow- belt regions where deicing salt is used to maintain traffic during winter months. Overlays and sealers have long been utilized in protection and repair strategies for bridge decks. Polymer overlays are used on decks to reduce the penetration of chloride ions (and the resulting corrosion) and to improve skid resistance (increase friction). Because of their small thicknesses (generally 0.25 to 0.75 in), polymer overlays impose less additional dead weight and can be applied more rapidly compared to other types of overlay. States may utilize differing criteria when deciding whether to use overlays. These criteria may include chloride content at the level of reinforcing bars, percent delamination of the deck, and the depth of cover over reinforcement. For example, a study in Virginia (Sprinkel et al., 1993) recommended that all concrete with chloride contents over 1.0 lb./yd3 be removed prior to placement of overlay. The rationale for such a recommendation is that the corrosion activity may continue unabated when significant chloride contamination exists under the overlay. The objectives of this research project were to explore the effectiveness and durability of thin polymer overlays with respect to restoring and protecting bridge decks, improving safety, and extending service life; to assess and compare performance of selected thin polymer overlay systems under laboratory test conditions; and to suggest appropriate bridge deck maintenance strategies related to this research. An experimental research program was designed and conducted to study and compare the performance of nine different overlay systems (designated S1 through S9) against each other and against a set of uncoated control specimens (designated S0). A total of 84 reinforced concrete slab specimens were subjected to accelerated corrosion (saltwater exposure and imposition of an electrical potential to the reinforcing bars), freeze-thaw cycles, heat/ultraviolet/rain exposure cycles, and tire wear tests (including simulated “snow plow” passages). Application of overlays on previously chloride-contaminated concrete was also studied through exposure of two sets of specimens to increasing chloride (corrosion) levels prior to application of overlays. A number of parameters including pull-out strength (bond between overlay and concrete surface), friction, deformation due to tire passages (rutting), and corrosion mass loss were measured. The specimens were dissected at the conclusion of testing for further examination and measurement of corrosion mass loss on the top reinforcing bars. The results of the testing program are discussed in detail in this report. The main results can be summarized as follows:
  • 12. 10  One of the nine overlay systems tested (S8 - a 2-lift polyester multi-lift overlay) exhibited complete delamination from the concrete surface during testing even though its initial pull-out strength was in line with the other eight overlay types. This overlay system had the worst overall performance based on numerical indices given to various performance parameters, or combinations of those parameters. In general, aside from the poor performance of S8, there were variations in performance of all other TPO systems tested (as discussed below); however, such differences were not drastic.  Friction test results prior to environmental exposures indicated that the tined concrete surface (concrete surface without overlay - control) had the highest initial friction values. However, the control specimen (without overlay) had the lowest friction values at the end of all testing. This indicates that the polymer overlay systems help retain surface friction values.  The overlay system utilizing epoxy resin with flint rock provided the highest friction, and the best overall performance indices, at the end of testing.  Of the three aggregate types (flint, granite, and calcined bauxite) used with the same epoxy resin (S1, S2, S3), the flint rock resulted in the highest friction values at the end of tests, while calcined bauxite exhibited the lowest friction results. The only overlay system with the taconite aggregate (S9) provided the second highest friction values at the end of testing.  The epoxy-based overlays (with different aggregate types) and the polyester premix system offered reduced corrosion losses when compared to the control specimens. However, the addition of overlays does not significantly reduce corrosion mass loss when specimens are already contaminated with chlorides prior to installation of overlays.  As far as pull-out strength (at the end of testing) is concerned, the epoxy overlay systems with calcined bauxite and flint aggregates (S3 and S1) provided the highest and second highest strengths, respectively. The lowest and the second lowest pull-out strengths were observed in the polyester multi-lift system (S8) and the overlay system with taconite (S9), respectively.  The main advantage of thin polymer overlays is the long-term preservation of friction coefficients as the deck ages relative to the concrete without overlay. Therefore, for applications where friction enhancements are needed, the thin polymer overlays are recommended unless chloride contamination, corrosion, and/or deck surface conditions preclude its use.
  • 13. 11  Proper installation of the overlays is crucial. Special effort and proper quality controls are needed to ensure that the overlay is installed properly. If the installation is done correctly, most of the tested systems (with the exception of the system described above) can perform without premature delamination.  During freeze-thaw testing, it was observed that some aggregates would become loose and leave the overlay system after each round of freeze-thaw cycles. It is anticipated that the loss of aggregates would continue with time. Since aggregates provide a physical barrier protecting the polymer against deterioration due to ultraviolet radiation from the sun, it is expected that a longer- term mode of damage may be related to UV degradation of the polymer following loss of aggregates.  Based on information in the literature, survey findings, and results from this study, it is anticipated that the service life of a 2-lift thin polymer overlay would be on the order of 7 to 15 years, if early premature failures do not occur. A service life of 10 years can be assumed for economic analyses.  If the purpose for the installation of the thin polymer overlay is to protect an uncontaminated deck against corrosion, a more cost effective approach may be to apply penetrating sealer instead shortly after construction, and repeating the sealer application periodically thereafter. However, on heavily-travelled roads, routine reapplication of sealers can be particularly disruptive to traffic. In such cases, thin polymer overlays can be applied as a corrosion protection measure, especially if the overlay is applied early in the bridge deck’s life before substantial chloride contamination has occurred.  The addition of polymer overlays does not significantly reduce corrosion mass loss in bridge decks with high levels of prior chloride contamination. Therefore, the placement of a thin polymer overlay on a chloride contaminated bridge deck undergoing active corrosion of the embedded steel cannot be considered to be an effective corrosion mitigation strategy. Such a step (application of thin polymer overlay) may still be taken in these situations for other reasons such as improving friction or providing a smooth riding surface over a limited time period. However, the overlay must be installed on sound concrete under all circumstances, and it must be realized that the overlay may eventually fail due to effect of corrosion of the underlying reinforcement, if not for other factors.  A set of guidelines for the maintenance of bridge decks is provided in Chapter 6.
  • 14. 12 1.0 INTRODUCTION 1.1 Background Concrete bridges in Wisconsin and elsewhere have shown varying signs of deterioration due to aging and other detrimental factors. Considering the enormous cost and effort required to remedy bridge deficiencies, it is crucial that a concerted effort be made to develop and implement practical, effective and economical methods and guidelines for protection, repair and rehabilitation of bridges. Deterioration of concrete bridge decks is a major maintenance problem particularly in the northern snow- belt regions where deicing salt is used to maintain traffic during the winter months. Bridge decks are a significant deterioration concern as they are directly subjected to vehicular effects (load, abrasion,…), deicing salts and freeze-thaw cycles. Chloride ions can penetrate into the concrete and reach the level of reinforcing steel in concrete. This results in the loss of alkaline environment in concrete and the elimination of the surface passivity of steel reinforcement. The outcome is initiation of corrosion of steel in concrete. The problem is further amplified due to the expansive nature of the corrosion products. To address these problems, overlays and sealers have long been utilized in protection and repair strategies for bridge decks. In the following, a brief discussion of overlays and sealers is presented. Overlays In general, deck overlays include asphalt concretes with or without membranes, latex or micro-silica modified concrete, high-early-strength hydraulic cement concretes, and polymer overlays. Polymer overlays are used on decks to reduce penetration of chloride ions, and to increase skid resistance (friction). Because of their small thicknesses (generally 0.25 to 0.75 in), polymer overlays impose less additional dead weight compared to other types of overlay. Such overlays can also be applied rapidly with lane closures of 8 hours or less. States utilize differing criteria when deciding whether to use overlays. These criteria include chloride content, percent delamination of the deck, and the depth of cover over reinforcement. For example, the Washington State DOT criteria recommends use of overlays if a) the chloride level at the level of reinforcement exceeds 2 lb/yd3 ; or 2) delamination (using chain drag) exceeds 2% of deck area; or c) over 15% of measurements show a reinforcement cover of less than 1 inch (Wilson and Henley, 1995). However, others may not agree with the above conditions. Sprinkel et al (1993) recommended that all concrete with chloride contents over 1.0 lb/yd3 , or half-cell potentials of -0.250 V (CSE) or less, be
  • 15. 13 removed prior to placement of overlay. The rationale is that corrosion activity will continue unabated when significant chloride contamination exists under the overlay. Sprinkel et al (1995) categorize polymer overlays into three basic types: multi-layer, pre-mixed and slurry. Multi-layer polymer overlays (generally two layers) are the most common type of thin polymer overlays used. In this method, patch repairs of delaminated deck areas are first performed as needed. Then, the deck surface is shot-blasted and cleaned. The most common resin used in this approach is epoxy. However, methyl methacrylate (MM), epoxy-urethanes, polyesters, and other resins are also used. A primer may (or may not) be first applied. The resin is then mixed with hardener and applied by sprayer, brush, roller, or squeegee onto the surface. Resin thickness would be on the order of 30 to 40 mils. Typically, a gap-graded clean aggregate is then broadcast on the resin. There is consensus that the type and quality of aggregates are crucial in the effectiveness of thin polymer overlays. Basalt-type aggregates are commonly specified. A short time after the resin application (when the resin is cured), the excess aggregates are broomed or vacuumed and another layer of resin and aggregates is applied (for a two-layer system). A proprietary thin polymer overlay system was designed to help reduce icing and accidents by using aggregates that absorb and re-release deicing agents when needed later (Evans 2010, Sprinkel et al, 2009). However, its performance was not considered adequate in some early installations. For premixed overlays, the binder (usually polyester styrene), aggregates, and initiator are mixed, placed on the deck and finished with a vibrating screed. The thickness of premixed overlay is typically between 0.5 and 1.0 in. Slurry overlays include mixing a flowable polymer mortar on a primed deck surface (0.25 in thick) followed by broadcasting aggregates on the slurry. Excess aggregates are removed and a seal coat is sometimes applied. The total thickness of this system is about 0.38 in, and the most common binders are epoxy and methacrylate. Nelson (2005) identified the following factors as contributing to failure in polymer overlays: improper binder selection; inadequate surface preparation; improper aggregate selection; improper mixing- application-curing; and damage due to ultraviolet radiation. The coefficient of thermal expansion of the overlay system should be compatible with that of the deck concrete. A flexible and solvent-free binder helps avoid delamination (Appendix A of ACI 503, 1993). A good polymer overlay should have bond strength of better than 250 psi (Nelsen, 2005). According to Nelsen, the resin material should have a tensile strength and elongation capability of at least 2000 psi and 30%, respectively. Nelsen also recommended that polymer overlays not be applied on concretes with rebar level chloride contents of 1.5 lb./yd3 or higher. Excessive moisture in the concrete at the time of application can lead to early failure. Water vapor
  • 16. 14 can result in weaker bond. The moisture condition can be tested by taping a 18-ft by 18-ft polyethylene sheet on the concrete surface (ASTM D4263). If moisture collects under this sheet in less time that it takes for the epoxy to cure, the substrate should be allowed to dry before application of resin. Many states specify a 2-hr time frame for the plastic sheet test. The aggregates used in polymer overlays should be resistant to fracturing and polishing. Suitable aggregates include pure aluminum oxide, emery, basalt with aluminum oxide, or greywacke (Smith, 1991). Aggregates should also be dry and free of dust. UV radiation absorbed by polymers can cause scission reactions, causing molecules to break up and erode (Nelsen, 2005). In typical bridge deck overlays, the polymer is shielded from UV radiation by the surface aggregates. However, UV resistance is still a factor that should be considered. In northern deicing states, such as Wisconsin, there is significant potential for snow plow damage to the polymer overlay. The damage is in the form of wear and reduction of skid resistance over time. Evans (2010) noted that the initially high skid resistance of a proprietary overlay system reduced rapidly over a few years. Another potential damage mode may be through freeze-thaw action. Damage may potentially occur at the interface between concrete and the polymer. In general, more recent works suggest a life expectancy of 10 to 15 years when the thin polymers overlay perform as designed. Rogers et al. (2011) report a service life of approximately 10 years. There are cases, however, when the overlays did not last as expected (Soltesz, 2010). Sealers To minimize and slow down the deterioration process in concrete decks in bridges, Wisconsin and other departments of transportation in the United States routinely use different types of deck and crack sealers. The most commonly used sealers contain hydrophobic agents. These sealers are either applied to the surface of concrete after it is cured (in new or older construction) or added to the fresh concrete mix (as admixture) prior to its placement. These sealers are intended to minimize the capillary action at the surface of undamaged concrete, to fill existing cracks, and to stop the penetration of contaminated water and oxygen into the concrete. Generally, the use of these sealers has been shown to be effective in reducing chloride intrusion and extending the service life of concrete decks. However, periodic re-applications of these sealers are required to counter the loss of their effectiveness (Tabatabai et al, 2009). Sealers may lose their effectiveness in bridge decks due to various factors including traffic wear, insufficient penetration depths, and improper surface treatment prior to sealer application. A recent WHRP study included assessments of sealers in the laboratory and in the field (Tabatabai et al., 2009).
  • 17. 15 1.2 Objectives and Scope The objectives of this research project were: 1) To explore the effectiveness and durability of thin polymer overlays with respect to restoring and protecting bridge decks, improving safety, and extending service life. 2) To assess and compare performance of selected thin polymer overlay systems under laboratory test conditions. 3) To suggest appropriate bridge deck maintenance strategies related to this research. The scope of work included performing a comprehensive review of literature, conducting a limited survey, and designing and implementing a testing program. The survey was a follow-up to a comprehensive survey conducted under a NCHRP Synthesis study by Fowler and Whitney (2011). Selected state engineers and material suppliers were contacted and interviewed by telephone. An experimental research program was designed and conducted to study and compare the performance of nine different overlay systems. A total of 84 reinforced concrete specimens were subjected to accelerated corrosion (saltwater exposure and imposition of an electrical potential to the reinforcing bars), freeze- thaw cycles, heat/ultraviolet/rain exposure cycles, and tire wear tests (including simulated “snow plow” passages). Application of overlays on previously chloride-contaminated concrete was also studied through exposure of two sets of specimens to increasing chloride (corrosion) levels prior to application of overlays. A number of parameters including pull-out strength, friction, deformation due to tire passages (rutting), and corrosion mass loss were measured. The specimens were dissected at the conclusion of testing for further examination and measurement of corrosion mass loss on the top reinforcing bars. In addition, initial friction tests were performed on four thin polymer overlay systems installed in 2013 on a Marquette Interchange ramp in Milwaukee, WI.
  • 18. 16 2.0 LITERATURE REVIEW The research team conducted a comprehensive review of available domestic and international literature concerning application of appropriate overlays and sealers for bridge decks. On-line sources of information as well as conventional search databases were utilized. A summary of the work on deck protection and repair (until 1993) was presented in a Strategic Highway Research Program (SHRP) research report (SHRP S-344 by Sprinkel et al, 1993). The SHRP S-344 study made detailed observations and recommendations on deck overlays and sealers. This study projected that, in areas of moderate deicing salt applications, the time to reach a chloride content of 1 lb/yd3 is 13 years without any protection, 25 years with a maintained epoxy sealer, and 77 years with a maintained polymer overlay. Although this comparative projection of 77 years may be questionable, it does show that early results were very promising. Some of the other observations and recommendations in this SHRP study included the following (Sprinkel et al, 1993):  Silane-treated decks have higher permeability in the traffic lane than in the shoulders. This SHRP observation implies the need for re-application of sealers to maintain protection.  “Multiple-layer epoxy and epoxy-urethane and premixed polyester overlays can provide a skid- resistant wearing and protective surface for 25 years when exposed to moderate salt application rates and light traffic”.  While bond decreases with age, multiple-layer epoxy overlays exhibit the best long-term adhesion;  Quality of aggregates is important. No. 8 gap graded basalt or silica aggregates should be used in multi-layer polymer overlays.  Concrete with chloride content of more than 1 lb/yd3 should be removed to achieve longer service life.  “Good skid numbers are achieved when sealers are placed on tined or grooved concrete surfaces so long as the material does not fill the groove”. Wilson et al (1995) reported on Washington State Department of Transportation’s (WSDOT’s) 10-year experience with epoxy and methyl methacrylate (MMA) thin polymer deck overlays. According to that report, WSDOT normally uses a 1.5-in-thick modified concrete (either latex or microsilica) as its primary deck overlay. WSDOT considers such overlays more durable than thin polymer overlays. However, when
  • 19. 17 additional deadweight is a problem or when the roadway width is narrow, WSDOT uses 3/8-in thin polymer overlay. Wilson et al. concluded: “The latest bond tests on several bridges show that epoxy overlays have a higher average value (274 psi) over time compared to MMA overlays (143 psi). The latest friction numbers show MMA overlays retain friction resistance very well over time, from an initial average value of approximately 40 to a value in the mid-30s after nine years of service. Test results show that the initial friction numbers for epoxy overlays start around 70 and fall to the mid to low 20s in five to seven years.” The literature search performed in this study did not indicate any agency using a combination of a first epoxy layer followed by a second MMA layer. Such a combination was chosen as an overlay system to be tested in this research. Wilson et al (1995) stated that additional polymer applications may be needed in 5-10 year intervals. They concluded that thin polymer overlays are a viable alternative to rigid concrete overlays when rapid construction is essential or when additional dead load is unacceptable. Pfeifer and Kowalski (1999) discuss two thin polymer overlay applications on adjacent bridges carrying I-57 near Clifton, Illinois. These overlays consisted of two layers of aggregate embedded in epoxy with a total thickness of 0.25 in. A rhyolitic stone aggregate (“trap rock”) was used. Bottom and top layer aggregates had average particle sizes of 1/16 in and 1/8 in, respectively. Other requirements were that more than 5% of aggregates may pass #20 sieve, and those passing #200 sieve must be less than 1%. Skid resistance tests (with treaded and smooth tires) were performed at 4 weeks, 10 months and 20 months after installation. Initial skid numbers were 70, which over 20 months reduced to 51 (smooth tire) and 60 (treaded tire). Cores removed from these decks had average chloride levels of 2.6 lbs/yd3 . The authors recommended that an application be first made on a test area, and pull-off testing (Appendix A procedures in ACI 503R) be performed within 48 hours after the test area application. Nelsen (2005) discussed polymer deck overlays in details including resin types and failure modes. Soltesz (2010) evaluated thin overlays for bridge decks in Oregon. According to the author, Oregon has had mixed results with thin polymer overlays. Eight different thin polymer overlay systems were evaluated in the laboratory and on two bridge decks. There were installation and crew experience issues for some products. Skid testing using a skid trailer was performed in the field (ASTM E 274). Overlay applications were done in 2007 and last skid testing was performed in 2010. Laboratory flexural and compressive strength tests were performed on the overlay in accordance with ASTM C 580 and C 579. Test temperatures were 0, 70, and 140 degrees Fahrenheit. According to Soltesz, “none of the overlay systems showed superior
  • 20. 18 performance under moderate average daily traffic from the standpoint of maintaining good skid resistance and resisting wear through”. Three products began to wear through, one very early and the other two after 1.3 million vehicle passages. Soltesz reported that for the remaining five products, predictive models based on initial test results suggested that skid would reduce to 40 within five months at a traffic level of 10,000 vehicles per lane per day. Delamination was not a problem. It should be noted that Oregon allows studded tires. Fowler and Whitney (2011) provided a history of thin polymer overlay use in bridge decks. They reported that the first TPO applications in the 1950’s involved use of coal-tar epoxy followed by a fine aggregate broadcast. In the 1960s and 1970s oil-extended epoxy as well as polyester-styrene resins and methyl methacrylate monomer systems were utilized to improve performance. Later, products were specifically designed to address TPO problems including delamination of the overlay. Fowler and Whitney (2011) reported that lower modulus and higher elongation resins were developed to address an important factor in overlay delamination, namely thermal incompatibility between polymers and concrete. Fowler and Whitney also summarized the work of Choi et al. (1996) on interfacial stresses between overlay and the concrete substrate. They concluded that “overlays that are thinner and less stiff will produce smaller stresses with the same temperature change.” Fowler and Whitney further report on the work by White and Montani (1997) in which the effect of temperature on elongation is addressed. White and Montani (1997) recommend that the elongation be tested at 40°F (minimum 20% elongation) and at 73°F (minimum 30% elongation) in accordance with ASTM D638.
  • 21. 19 3.0 SURVEY RESULTS 3.1 Previous Surveys (by Others) The research team focused its survey work on follow-up inquiries to a national survey conducted in the NCHRP Synthesis Report No. 423 on performance of thin polymer overlays for bridge decks. The NCHRP Synthesis study was performed by David Fowler and David Whitney of the University of Texas at Austin (Fowler and Whitney, 2011). This work included a national survey of states and contractors on performance of polymer concrete on bridge decks. The researchers received survey responses from 40 states. Table 1 shows a summary of survey results in that study. Fowler and Whitney summarize results of their survey as follows: “The survey responses, from 40 states and seven provinces, revealed that at least 2,400 TPOs have been constructed in the United States and Canada, a fourfold increase over the number installed through 1999. Seven states and three provinces that responded have not used TPOs. Nearly all states use epoxy resins, and only California indicated that it uses predominantly polyester-styrene in premixed overlays.” Based on their survey, Fowler and Whitney (2011) report the following causes of TPO failures:  “Deck condition—in many cases, overall condition of deck probably too poor to apply overlay;  Repaired areas not sufficiently dry and/or not roughened;  Inadequate surface preparation;  Cool damp weather during installation;  Deck too damp at time of overlay installation;  Construction problems;  Inadequate quality control; and  Use of snow chains”. Fowler and Whitney (2011) report the contractors’ recommendation (based on their survey) as follows:  “Bidders be prequalified for TPO experience;  Resin manufacturer’s representative always be present, especially if warranty is required;
  • 22. 20  Repairs be made using compatible polymer patching materials supplied or specified by the TPO manufacturer, which eliminates paying for traffic control twice and having to build in an extra 28 to 56 days to let the patches cure, dry, and outgas;  Diamond grinding be specified for very rough decks to save on the cost of shot blasting and to minimize the resin consumption;  A mandatory 4-hour curing period is too long in hot weather; 1 hour is often enough and can be verified by the impact hammer and/or screwdriver test; peak exotherm or maturity might also work to confirm the curing, especially for thicker overlays;  The specifications requiring the airless spray application for high-molecular-weight methacrylate sealers and primers be eliminated because of the difficulty in keeping the spray guns calibrated; by the time the problem is discovered, considerable improperly mixed resin has been applied;  TPO applications always be restricted to warm and dry periods; and  Warranties for 5 years be required.” Fowler and Whitney (2011) report the material suppliers’ identification of problems and the suppliers’ recommendation as follows: Problems encountered (Fowler and Whitney, 2011):  “Poor deck condition;  Cracking and delamination of deck;  Inadequate concrete cover on steel;  Bidding followed by requirement that they must provide technical support on site; and  Obtaining all three surface preparation requirements: clean, dry, and sound.” Material suppliers’ recommendations (Fowler and Whitney, 2011):  “Technical representatives be trained;  Manufacturer’s representative be on site to oversee work;  The deck be in good condition;  Deck be clean and dry;  Deck cleaning texture be specified as ICRI CSP 7, but can accept 6;
  • 23. 21  Multiple-layer TPOs be used for epoxy systems;  Minimum tensile elongation be 50% for epoxy systems;  Aggregate have a Mohs hardness of 7;  AASHTO Task Force 34 recommendations... be followed;  For polyester systems specifications, have contractor make an investment in volumetric mixers with readouts and plural components, paving machine with automatic grade control, and shot- blasting equipment; and  Specification must require experience.” Krauss et al. (2009) report on bridge deck overlays, sealers and treatments. As part of their NCHRP study, Krauss et al. (2009) conducted a national survey of states on various repair methods and sealers. Polymer overlays (thin-bonded polymer concrete) were included in their national survey. Twenty-three states provided responses to the survey. These were AK, CA, CO, GA, ID, IL, KS, MA, ME, MO, NM, NV, NY, OK, OR, TN, UT, VT, and WY. The respondents identified the following advantages (Krauss et al., 2009):  “Quick installation and rapid return to traffic (65%)  Easy installation (39%) o No modifications of approaches required o No redoing of expansion joints is required  Light weight or low dead load - 7 respondents (30%)  Good waterproofing and low chloride permeability - 6 respondents (26%)  Durability or long life - 6 respondents (26%)  Skid resistance or good friction characteristics - 5 respondents (22%)”
  • 24. 22 Table 1. Summary of Survey Results from NCHRP Synthesis Report 423 (Fowler and Whitney, 2011).
  • 25. 23
  • 26. 24 The following were the disadvantages (Krauss et al. 2009):  Cost - 11 respondents (48%)  Installation problems (30%) o Inadequate surface preparation can affect adhesion o Binder preparation  Low durability (17%) o High traffic loads o Under the wheel path  Problems occurring during installation can be difficult to correct (13%)  Polymer concrete cannot be used as a replacement for bridge deck concrete (4%) Krauss et al. further report that the use of polymer overlays has increased nationwide, especially within the last 10 years. Massachusetts has used polymer overlays for over 25 years. Thirty percent of respondents used polymer overlays in the last 10 to 25 years ago, while thirty-nine percent used such overlays beginning 5 to 10 years ago. Twenty-six percent of respondents began using polymer overlays in the last five years. The mean and median anticipated lifespan of the polymer overlays, as reported by the respondents, were 9 to 18 years and 10 to 18 years, respectively. Table 2 shows survey responses to a question on reasons for selection of polymer overlays. Table 2. Reasons for selection of Polymer overlays (Krauss et al., 2009).
  • 27. 25 Table 3 shows the respondent’s answers to a question on deck conditions that can be addressed by polymer overlays. Polymer overlays were most commonly used for decks with cracking, but otherwise in good condition with no significant corrosion (15 or 65%). Polymer overlays are also used for other conditions including for newer desks. Table 3. Deck conditions that can be addressed by polymer overlays (Krauss et al, 2009). Table 4 shows the survey responses regarding surface preparation used. The most common surface preparation is shot blasting. Table 5 shows responses related to surface evaluation prior to installing the overlay. The following general recommendations made by the respondents in the Krauss et al (2009) study: “Three respondents recommended that a manufacturer’s representative be on site during installation. Three respondents mentioned surface preparation concerns. More than one respondent mentioned that high quality surface preparation is essential, and that a dry surface should be obtained. Another mentioned that the system does not adhere well to green concrete. Two respondents discussed cure time, one stated that cure time can be more than four hours per layer, the other to recommend use if construction time is a concern. Weather can be a factor in the cure of some systems, and it is suggested that installers adhere to temperature and humidity tolerances. One respondent recommended that thin bonded epoxy overlays not be used to repair decks with active corrosion, and another respondent recommended that polymer concrete not be used for partial replacement of a bridge deck section. This respondent also recommended the use of volumetric mixing trucks and paving machines for placement on large areas. Another respondent recommends that one should determine if cracks are working and determine ride quality. Another respondent recommends that colleagues avoid methyl methacrylate thin bonded overlays.”
  • 28. 26 Table 4. Surface preparation techniques in polymer overlays (Krauss et al, 2009). Table 5. Surface evaluation prior to installing polymer overlays (Krauss et al, 2009). 3.2 State Survey Results – This Study The research team contacted Prof. David Fowler to obtain detailed survey responses from his NCHRP synthesis study. Prof. Fowler provided such responses from Iowa, Minnesota, Missouri, and New York. The project team was able to contact respondents in Iowa, Illinois, Minnesota, and Missouri to ask detailed questions about their state’s experiences. Furthermore, the research team contacted several manufacturers of thin polymer overlay products to discuss applications of their products in detail. The following is a summary of telephone conversations (in 2013) with select state DOT personnel who had responded to the earlier NCHRP survey, and whose detailed responses were received from Prof. Fowler. Missouri: (Ms. Jen Harper) As of the time of the NCHRP survey (2008), Missouri had reported over 300 TPO installations. However, Missouri has installed very few since the NCHRP survey. The reason for this major change is related to the new requirements for TPO installations. Past failures had brought about new criteria for utilization of TPO requiring that the deck delamination and damage be less than 5%. This requirement has significantly reduced the number of TPO installations since TPOs are typically not employed in a preventive mode on better deck conditions.
  • 29. 27 Missouri uses a 2-lift epoxy system with a sand broadcast, and does not use premixed systems. Missouri may sometimes use a MMA sealer prior to placement of TPO. Missouri’s specifications require pull-out and moisture tests, and limit types of aggregates and gradations to be used. Missouri used to perform skid resistance tests, but does not do so anymore, and has not tested for changes in skid resistance over time. Missouri requires a 20% elongation on the epoxy resin. Illinois: (Mr. Gary Kowalski) In 2008, Illinois had reported a total of 24 TPO installations between 1996 and 2007. Illinois has since installed 10 more TPO systems. Illinois requires that the deck be in “good shape”, and prefers that any patching be done ahead of time. The type of binder used is low-mod epoxy. MMA is not used as TPO binder, but is used for waterproofing. Illinois requires that the deck be shot-blasted and pull-out tests be performed at 3 locations with strength greater than 175 psi. Illinois requires “no visible moisture on surface” at installation. Regarding aggregates, crushed basalt and aluminum oxide with gradation requirements are allowed. A hardness of at least 6 is required (on Mohs scale). Some of the early problems in other states have been due to use of bottom coal slag, which is not allowed for TPO applications in Illinois anymore. Illinois did not report problems with UV resistance, skid resistance or overall TPO failures. Localized failures in wheel lanes were mentioned. Illinois has six pre-approved products for TPO applications. Iowa: (Mr. Norm McDonald) In the 2008 NCHRP survey, Iowa had reported one TPO installation, and reported that it had stopped using TPOs. The single TPO was installed in 1986. The deck performed well for 4 years, but later delaminated. There was another failure of TPO on another city bridge in Iowa. The TPO was installed in 1987 and failed in 1991. Cores were taken, which showed shallow delamination below bottom of overlay. Iowa plans to install another TPO next spring, and has developed a new set of specifications for TPOs. They require pull-out tests (250 psi) and specify “no visible moisture” on concrete surface. A 2-hr taped plastic test is performed for moisture indication (ASTM D4263). Minnesota: (Mr. Ed Lutgen) The first five TPO bridge decks (in 2006) were a proprietary system with limestone aggregates. They developed skid problems. In 2009, two bridges received a different overlay system with a taconite aggregate from Virginia. However, the aggregates dislodged because the aggregates were dirty and they were not dry. In 2012, they installed a premix polyester system with a cost of about $12/sq ft. There was
  • 30. 28 some spalling near joints, but there were no other problems reported. In 2011, two epoxy-urethane overlay installations were made. Minnesota has not used a methacrylate system. Minnesota does not have established criteria for applying TPOs. They decide on project-by-project basis. Minnesota requires pull-off test before application of TPO (on concrete). A minimum strength of 250 psi is required. The 2-hr plastic test is used for moisture. For aggregates, they require a hardness of 6 and have an aggregate gradation requirement. 3.3 Supplier Survey Results – This Study Material suppliers were interviewed on the telephone in 2013. TK Products: (Don Kopen) The TK2109 is the epoxy-based product for thin polymer overlays. The first layer is applied at 40 sq. ft. per gallon (thinner) and the second layer is applied at 20 sq. ft. per gallon. A thinner epoxy product TK2110 is used for sealing cracks prior to application of TK2109. There are also two other types of crack sealer, a methacrylate product (TK2414, a little thinner than TK2110), and a polyurea product (TK9030). The elongation for TK2109 is 36%. States prefer angular aggregates. “Trap rock” (from Kansas City) and “Red Flint” (from Eau Clair – not as angular) are sometimes used. Aggregate should be dry with less than 17% moisture (measured using a 2-needle probe). Pull-off tests are not done on jobs, and they haven’t done any tests. Regarding surface treatment, shot blasting is very good as the epoxy can wet the surface. The most common system is a 2-lift system. The expected life is at least 15 years. As soon as epoxy goes down, there should be another crew behind it placing aggregate. Set time is about 4 hours at 70 degrees. If there is too much delamination on the deck slab, do not place the overlay. SIKA (Craig Frier): Their product for thin polymer overlays is “Sikadur 22 Lo-Mod”, which is an epoxy-based system. They have two products for crack sealing: “SikaPronto 19TF” has very low viscosity and can be applied in colder temperature. “Sikadur 55 SLV” is another crack sealer, which cannot be used at or below 40 degrees. The first and second layers are placed at 40 and 20 sq. ft. per gallon, respectively. Pull-off tests can be used before (to check substrate) and after overlay placement. Moisture is normally not a problem except when fresh patches exist. Moisture test can be with the plastic sheath method, probes, or calcium chloride
  • 31. 29 test. A clean and sound surface must be present. There are no problems with putting overlay on patched surfaces that are cured. Wisconsin requires a more angular aggregate. Moisture content of aggregate is tested. The state requires independent field testing. The state may also remove cores to measure thickness. Only one overlay delamination has been reported in 60 cases. Overlay can break down near expansion joints, but that is easy to repair. Dayton Superior (Unitex): (Don Edwards) Their “Pro-Poxy” product for thin polymer overlays is an epoxy-urethane-based product. They have a crack sealer product (“Bridge Seal”), which is an epoxy-based healer/sealer or primer. They also provide a system for skid resistance in which typically one lift is used. The causes of problems are bad installation and contaminants. Pull-off testing only gives indication in the particular measurement area. Aggregates are provided by contractors. Typically, bauxite or flint rock is used. Moisture content of substrate measured using a moisture meter should be less than 4%. International Coating (Mike Kramer): They have an epoxy overlay system and a crack sealer/filler product that can be used with the overlay. The overlay has a ¼-in thickness in two lifts. Each lift includes 25 sq. ft./ gallon (approximately 60 mils). The epoxy elongation is 40% but can be lower at colder temperatures. Preparation of slab is important (shot blasting). The “no standing water” rule is OK. Substrate moisture is not an issue on bridge decks. Moisture tests can be done using the calcium chloride method, the relative humidity test, or the plastic sheet method. A pull-off test is not necessary, but 250-300 psi pull-off strength is standard. Coatings over patched areas are OK as long as there is a solid surface. Regarding aggregates, the manufacturer does not supply aggregates, and whatever the state requires in its specifications is followed. Kwik Bond Polymers (Greg Freeman): The company provides premixed and multi-lift polyester overlay systems. They have worked with Caltrans for many years (1970s). In the last 6-8 years, multi-lift polyester with slightly modified polyester is also used. The premixed polyester overlay is considered to be a better system. The premixed system has to have trained contractors. Most states have multi-lift specifications, and there is market demand for multi-lift systems. Polyester has better UV stability, better thermal compatibility, and shorter time is needed to
  • 32. 30 return traffic. Calcined bauxite aggregate (from aluminum smelting) would be the best type of aggregate because of its polished stone value (PSV) test results. This aggregate is imported from overseas and is processed in the US. They require visibly surface dry conditions for the substrate. Pull-off tests results are expected to be over 300 psi. They expect skid resistance in 5 years of over 65. On patched systems, some patches could have off-gas that affects good bond. Cured properties are important. 3.4 Summary of Survey Results A comprehensive survey related to thin polymer overlays was conducted by Fowler and Whitney in 2011. Therefore, instead of conducting a new survey, the research team focused on reviewing the existing survey, and seeking follow-up feedback from those who had responded to the initial survey. Engineers from departments of transportation in Missouri, Illinois, Iowa, and Minnesota were contacted for telephone interviews. In addition, suppliers of polymer overlay materials were contacted and interviewed to obtain feedback. The following summarizes some of the survey results Causes of overlay failure include:  Improper surface preparation  Surface moisture  Out-of-range concrete temperature  Deck patch materials that have not sufficiently aged  Unsound concrete deck surface  Pre-existing corrosion deterioration and chloride contamination Recommendations:  Specifications should address surface preparation procedures and outcomes.  Specifications should address hardness (Mohs scale), gradation, shape, dryness, and cleanliness of aggregates.  Specifications should address thermal compatibility between the polymer and the deck concrete as well as minimum strength and elongation properties for the polymer.  Quality control procedures should include pull-out strength, moisture (dryness) tests, and surface temperature measurements.  Experience of crews and/or presence of experienced supplier representative are considerations in quality control.
  • 33. 31 4.MATERIAL SELECTION AND EXPERIMENTAL DESIGN 4.1 Material Selection A list of available commercial products for thin polymer overlays and crack sealers that are commonly used in conjunction with polymer overlays is shown in Table 6. Based on the evaluation of available literature, surveys, and discussions with state DOTs and manufacturers, the research team proposed nine sets of different products/methods/materials (treatment systems) for testing. These overlay systems were designated S1 through S9. The research team’s proposed treatment selections were presented to the project oversight committee and approved. One set of control specimens (without any overlay) were also used (designated S0). Table 7 shows the various treatments that were tested. The treatments used included the primary generic polymer types that are commercially available (two low-modulus epoxy products, an epoxy-urethane, and a polyester styrene). The baseline polymer used was a low-mod epoxy. Three types of aggregates were used with the baseline polymer: flint rock, Wisconsin granite, and calcined bauxite. The baseline aggregate used was flint rock. All commercially- available aggregate types that were used in this study had been graded and prepared by their suppliers for the purpose of use in thin polymer overlay applications. Treatment S1 had the baseline polymer resin (epoxy) and the baseline aggregate (flint rock) used in the 2-lift overlay. Treatments S2 and S3 were designed to compare Wisconsin granite (S2) and calcined bauxite aggregates (S3) with the flint rock aggregate since all three treatments (S1, S2, and S3) had the same low-mod epoxy resin. It should be noted that the calcined bauxite aggregates used for high friction surface treatment (HFST) of pavements are typically required to have a minimum aluminum oxide content of 87% (measured using procedures in ASTM C25). In general, specifications on thin polymer applications for bridge decks do not have such a requirement. The calcined bauxite aggregates used in this study had material test reports indicating compliance with the 87% aluminum oxide requirement. However, energy dispersive X-ray spectroscopy (SEM/EDS) tests performed after the conclusion of the experimental program indicated aluminum contents that were below the prescribed limits for HFST. Treatment S4 had a first layer of the baseline epoxy and a second methacrylate layer. Both layers used Flint rock as aggregate. Treatment S5 had two layers of the baseline epoxy. However, the second (top) epoxy layer was modified by adding Flue Gas Desulfurization (FGD) gypsum powder (air dried) at a weight fraction of 70% of resin. FGD gypsum is a byproduct of burning coal in electric power plants. Previous research at UWM indicated that such an additive improved mechanical properties of polyesters.
  • 34. 32 Treatment S5 had Flint rock for both layers. Treatment S6 had two layers of an epoxy-urethane resin with calcined bauxite aggregate as a manufacturer’s choice of aggregate for this product. Treatment S7 was a pre-mixed polyester-styrene system in which aggregates are pre-mixed with the polymer and then placed on the surface of concrete. Aggregates were part of the system supplied by the manufacturer and therefore the aggregate type is not specified in Table 7. This was the only premixed product used in this research. Treatment S8 was a polyester multi-lift system. Two layers of polyester resin with flint rock were used. Finally, Treatment S9 was added to the test program as an additional treatment tested under a separate contract with the manufacturer. A fourth aggregate type, taconite, was used only in conjunction with the S9 overlay system since the manufacturer wished to use that aggregate type as part of their system. The resin type used in S9 was identified as a low-mod epoxy. Additional information on various overlay products are shown in Table 8. 4.2 Laboratory Testing Procedures 4.2.1 Test Specimens The laboratory experimental plans included tests to evaluate the effects of freeze-thaw cycles, tire passages, and heating/cooling/ultraviolet exposure on surface friction, bond to concrete, and reinforcement corrosion. The test specimens used were concrete blocks with the overall dimensions of 15 in x 15 in x 4 in. The concrete material was a conventional WisDOT mix design for bridge decks. Specimens includes four No. 5 bars (two at the top layer and two at the bottom layer) as shown in Figure 1. The cover distance to the top surface was 1.0 in. instead of the commonly-used bridge deck cover of 2 in to accelerate chloride penetration during corrosion testing. All specimens were tined (grooved) in accordance with standard practices. Figure 2 shows specimen molds before casting concrete, and cast specimens before and after tining their top surface. All specimens were cured by covering with plastic sheathing for one week. All specimens were more than 28 days old when overlays were applied. The total number of test specimens was eighty-four (84). There was one additional slab specimen for each overlay system to allow pull-off testing and baseline chloride measurements at the beginning of tests. Initial bond pull-out tests (in accordance with ACI 503R – Appendix A procedures) was conducted within 48 hours of overlay application. Prior to exposure tests, all specimen surfaces (except the top surface)
  • 35. 33 were coated with an epoxy paint so as to limit moisture movements into or out of the specimens except through the top surface (overlay). The specimens were grouped and numbered as shown in Table 9. The specimen numbering system contains information on the overlay system (type of overlay, S1 through S9, with S0 used for control specimens), extent of pre-existing corrosion/chlorides (Groups A, B, or C), and specimen number (1 through 3). For example, S4-B2 refers to the second specimen with overlay type S4 and moderate corrosion/chloride exposure condition (Group B). Table 6. Commercially available products for thin polymer overlays. Manufacturer Product Trade Name Generic Type Usage BASF Trafficguard EP35 Epoxy Overlay Dayton Superior Pro-Poxy Type III Epoxy and Urethane Overlay Dayton Superior Bridge Seal 75% Epoxy Crack Sealer International Coating, Inc. ICO Flexi-Coat BD Epoxy Overlay International Coating, Inc ICO-Gel Epoxy Crack Sealer Kwik Bond PPC MLS Polyester Overlay Kwik Bond PPC 1121 MM MIX Polyester premixed Overlay Poly Carb, Inc. Mark 154 Safe-T-Grid Epoxy Overlay Poly Carb, Inc. Mark 163 Flexogrid Epoxy and Urethane Overlay Sika Corporation Sikadur 22 Lo-Mod Epoxy Overlay Sika Corporation SikaPronto 19 TF Methacrylate Crack Sealer Sika Corporation Sikadur 55 SLV Epoxy Crack Sealer TK Products TK 2109 Epoxy Overlay TK Products TK-2110 Epoxy Crack Sealer TK Products TK-2414 Methacrylate Crack Sealer TK Products TK-9030 Urethane/Polyurea Hybrid Crack Sealer Transpo Transpo T-48 Polysulfide Epoxy Overlay
  • 36. 34 Table 7. Selected Test Products/Methods. Specimen Product Broadcast Aggregate S0 Control – no overlay system - S1 low-mod epoxy 1 (2 lifts) flint rock S2 low-mod epoxy 1 (2 lifts) Wisconsin granite S3 low-mod epoxy 1 (2 lifts) Calcined bauxite* S4 low-mod epoxy 1 (1 lift) + methacrylate (1 lift) flint rock S5 low-mod epoxy 1 (1 lift) + low- mod epoxy 1 augmented with additive (1 lift) flint rock S6 Epoxy-urethane (2 lifts) Calcined bauxite S7 Polyester styrene (premix) NA S8 Polyester styrene (2 lifts) flint rock S9 Low-mod epoxy 2 (2 lifts) Taconite *This calcined bauxite aggregate did not meet the HFST requirement for aluminum oxide content.
  • 37. 35 Table 8. Product information provided by suppliers for various polymer overlay products. Low-mod epoxy 1 A 2-component (1:1 by volume), 100% solids, moisture-tolerant, epoxy resin binder; tensile strength: 2650 psi, elongation at break: 55%; Shore D hardness: 72; water absorption: <0.2%; compressive modulus: 40,000 psi. Epoxy-urethane A 2-component (2:1 by volume), 100% solids, epoxy-urethane resin binder; tensile strength: 2700 psi, elongation at break: 35-45%; Shore D hardness: 55- 75; water absorption: 0.3-0.5%; tensile modulus: 70,000-80,000 psi. Polyester premixed A polyester-based polymer overlay; tensile strength: >2500 psi; elongation at break: >35%; system compressive strength: >4000 psi; flexural strength: >1600 psi. Polyester multi-lift A hybrid polymer system; tensile strength: 2650-3900 psi; elongation at break: 30-40%; system compressive strength: >5000 psi; flexural strength: 4000-4600 psi. Low-mod epoxy 2 A 2-component (1:1 by volume), 100% solids; tensile strength: 2500 psi, elongation at break: 45%-55%; Shore D hardness: 71; water absorption: <1.0%.
  • 38. 36 Figure 1. Concrete test specimen (with and without overlay).
  • 39. 37 Figure 2. Concrete specimen preparation. Table 9. Grouping of test specimens. Type of treatment Group A Group B Group C S0 S0-A1 S0-A2 S0-A3 S1 S1-A1 S1-A2 S1-A3 S1-B1 S1-B2 S0-B3 S1-C1 S1-C2 S1-C3 S2 S2-A1 S2-A2 S2-A3 S2-B1 S2-B2 S2-B3 S2-C1 S2-C2 S2-C3 S3 S3-A1 S3-A2 S3-A3 S3-B1 S3-B2 S3-B3 S3-C1 S3-C2 S3-C3 S4 S4-A1 S4-A2 S4-A3 S4-B1 S4-B2 S4-B3 S4-C1 S4-C2 S4-C3 S5 S5-A1 S5-A2 S5-A3 S5-B1 S5-B2 S5-B3 S5-C1 S5-C2 S5-C3 S6 S6-A1 S6-A2 S6-A3 S6-B1 S6-B2 S6-B3 S6-C1 S6-C2 S6-C3 S7 S7-A1 S7-A2 S7-A3 S7-B1 S7-B2 S7-B3 S7-C1 S7-C2 S7-C3 S8 S8-A1 S8-A2 S8-A3 S8-B1 S8-B2 S8-B3 S8-C1 S8-C2 S8-C3 S9 S9-A1 S9-A2 S9-A3 S9-B1 S9-B2 S9-B3 S9-C1 S9-C2 S9-C3
  • 40. 38 4.2.2 Introduction of Initial Chlorides For each of the nine overlay systems, three different corrosion/chloride exposure levels were considered. Prior to the application of overlay, the test specimens were divided into three Groups A, B, and C. Group B and C specimens were subjected to 6% saltwater exposure and an electrical potential of 2 volts between top and bottom bars (similar to the accelerated corrosion procedures discussed later). Group B and C specimens were exposed to 1 and 2 weeks of accelerated corrosion exposure, respectively. Each week consisted of 4 days of wet condition (saltwater on top surface) and 3 days of dry surface conditions (saltwater removed from top surface) while an external constant voltage of 2 volts was applied. The application of electrical potential (making top bars anodic) accelerates reinforcing bar corrosion as well as penetration of chloride ions into the concrete. Figure 3 shows specimens undergoing initial chloride/accelerated corrosion exposure prior to the start of exposure tests. The amounts of chlorides (prior to placement of overlays) under Group A, B, and C exposure conditions were measured on three slab specimens that were dedicated to these destructive chloride tests. Chloride testing was done using the Rapid Chloride Test (RCT) procedures (Germann Instruments, 2010). The RCT method has a reported average variation of ±4% with respect to the AASHTO T 260 titration method (Pritzl et al., 2015). The measured baseline acid soluble chlorides for specimens with Group A exposure was 0.023% of concrete mass (0.90 lb/yd3 ). The source of this chloride was the concrete ingredients themselves as there were no external chloride exposures for this group. The average measured acid soluble chlorides within the top 1 in (25 mm) of test slab in Group B and C specimens were 0.115% and 0.145% of concrete mass, respectively. Therefore, the average added chlorides within the top 1 in for Group B and C specimens were 0.092% and 0.122%, respectively. This amount is equivalent to 3.6 and 4.8 lb. per cubic yard of added chlorides in the top 1 inch of slab for the Groups B and C, respectively. It should be noted that the chloride levels in the top 1 inch (cover depth) of the test slab specimens is equivalent to the bottom 1 inch of the depth of cover (directly above the bar) in typical bridge decks with a minimum cover depth of 2 in. Therefore, Group A specimens had no added chlorides, while Group B and C specimens had ‘moderate’ and ‘high’ initial chloride levels. These groups were meant to represent different ages of concrete at which times overlays may be applied. Each test treatment/ Chloride group combination had three specimens.
  • 41. 39 Figure 3. Group B and C specimens undergoing initial chloride/accelerated corrosion exposure. 4.2.3 Overlay Applications Various treatments were applied to the 15 in x 15 in. top surface of all specimens after proper surface preparations. All manufacturers were invited to observe and monitor installation, and were offered the opportunity to apply the treatment themselves. Prior to the overlay applications, top surfaces of all specimens receiving treatments were shot blasted in a blasting cabinet. The steel shots used were S460 shots with a nominal size of 1.19 mm. Figure 4 shows the general process of application of thin polymer overlay for one of the overlay types. For the multi-lift (2-layer) systems, the polymer components were first mixed with an electric mixer. The amount of polymer used in each layer was carefully measured based on the manufacturers’ recommendations. A duct tape was placed around the top surface of the specimen to create a short “dam” for the polymer resin and aggregate placements. The liquid polymer resin was then placed and spread on the top surface of concrete. The aggregate was then spread (broadcast) on the “wet” surface until liquid was no longer visible on the surface. The resin was allowed to harden, and then a shop vacuum machine was used to remove the extra (un-bonded) aggregates from the surface. The process of mixing and placing the resin and broadcasting of aggregates was then repeated for a second time. The total thickness of the 2- layer system was on the order of 3/8 in to ½ in. Figure 5 shows specimens with 2-layer overlays applied on the top. In the case of pre-mixed polyester system (S7), aggregates supplied by the manufacturer were mixed with the polymer before placement on the surface. A primer was first applied on the concrete surface. The overall thickness of this overlay was on the order of ¾ in. The surface was finished smooth. Figure 6 shows placement of the S7 overlays.
  • 42. 40 Figure 4. Placement of thin polymer overlay on test specimen. 4.2.4 Exposure Rounds Each specimen was subjected to a sequential series of exposures/tests as shown in Figure 7. After the application of overlays, all specimens were subjected to three rounds of testing/exposure involving accelerated corrosion, freeze-thaw cycles, heat/UV/rain cycles, and wear testing (repetitive tire passage), and a “snow plow” test at the end of round 3 testing. Details of each test component are described below.
  • 43. 41 Figure 5. Multi-lift overlay placements. Figure 6. Pre-mixed polyester overlay system (S7) placement.
  • 44. 42 Figure 7. Test exposure cycles. 4.2.4.1 Accelerated Corrosion Testing Corrosion/chloride exposures were achieved through a combination of 6% NaCl salt ponding and imposition of an electrical potential between anode (top) and cathode bars. This approach has been used in previous WHRP research resulting in rapid penetration of chlorides and corrosion (Tabatabai et al., 2010 and Tabatabai et al., 2005). 3 rounds * *Snowplow test performed in the last round only
  • 45. 43 The accelerated corrosion program was designed to test the ability of the polymer overlay and the concrete block to prevent or limit infiltration of chloride ions (introduced through road salt) and the resulting corrosion. During the exposure test, chlorides (saltwater) were introduced at the top surface of the samples. The source of the chlorides in this controlled test was food-grade salt (NaCl) dissolved in water to achieve a 6% concentration. A constant external potential of 2V was imposed between the two top bars (anode bars) and the two bottom bars (cathode bars) to accelerate the corrosion process. A regulated power supply was used to supply the constant voltage to all specimens under accelerated corrosion exposure. Each set of accelerated corrosion test groups consisted of six specimens. The samples were arrayed in two rows of three on the testing table. Once the samples were placed in position in the accelerated corrosion station, rigid plastic sidewalls were installed around the top surface of all six specimens. Silicone caulk was used to attach rigid plastic walls to the four side walls of the specimen. Silicone caulk was needed to ensure that saltwater would not leak out from the top surface during testing. Once the caulk was set, electrical wires were attached to the reinforcing bars within the test specimens. Each of the bars were pre-drilled at each of its two ends to create a small opening perpendicular to the axis of the bar. The opening was used to insert a connector (banana plug) and make full electrical contact between the wires and the reinforcing bars. The surface of the drilled holes was cleaned to ensure proper electrical connection prior to each accelerated corrosion round. The top bars (anode or corroding bars) and the bottom bars (cathode or non-corroding bars) were connected to the electrical circuit shown in Figure 8. The two top bars were connected together and the two bottom bars were similarly connected together as well (as shown in Figure 9). The specimens were subjected to 7-days of accelerated corrosion testing in each of the three rounds of testing. Each week of exposure involved placement of saltwater on the top surface (wet condition) for 4 days followed by removing the saltwater (dry condition) for the remaining three days. Figure 9 shows the accelerated corrosion testing setup under wet and dry conditions.
  • 46. 44 Figure 8. Accelerated corrosion setup.
  • 47. 45 Figure 9. Accelerated corrosion exposure setup. 4.2.4.2 Freeze-Thaw Cycles Once the specimens completed each corrosion exposure round, they could begin the freeze-thaw (FT) phase of testing. The FT exposure subjected the specimens to repeated cycles of freezing and thawing to assess their effects on the durability and adhesion of the overlays. All specimens were subjected to three rounds of freeze-thaw cycles. A total of 50 freeze-thaw cycles were applied (two round of 16 cycles each and last round of 18 cycles). A specially-designed machine with computer controls (“automated setup”) was used for the freeze-thaw tests (as well as heat/UV/rain and wear tests) during the first two exposure rounds (Figure 10). The last round of testing (round 3) involved manually moving carts loaded with specimens into and out of a freeze- room (“manual setup”) (Figure 11) to achieve the required number of freeze-thaw cycles. A total of three
  • 48. 46 carts were made for the manual setup. The use of the manual procedures was necessary after malfunction of the automated machine following the completion of the second round of testing. The automated setup was part of custom-made test machine that was designed and constructed for this research. The automated machine had six drawers with its three lower drawers dedicated to FT testing. Each drawer was designed to receive one specimen. The heating/cooling elements were located underneath the bottom surface of each FT drawer. Figure 10. Automated computer-controlled machine for FT, HURA and wear testing of specimens. 3 FT drawers 3 HURA drawers Wear test stand Computer controller station
  • 49. 47 Figure 11. One of the three carts used for manual FT testing. The following procedures were followed using the automated test machine in the first two round of FT testing: Automated Procedures (FT Procedure 1) (used in rounds 1 and 2): • Before beginning of each round, the drawer was cleaned and any loose aggregate or standing water was removed. • Four non-metallic washers were placed on the base of the FT drawer as supports for the specimens, and to ensure that the specimen is slightly off of the bottom. • The specimen was placed inside the drawer with the top (overlay) surface facing down (Figure 12). • A temperature sensor was placed on the side concrete surface just adjacent to the overlay. A piece of insulating foam was placed over the sensor thus wedging the sensor between the insulating foam and the concrete. This would allow for an accurate reading of the concrete temperature next to the overlay. • Approximately one liter of non-salted tap water was poured into the drawer. The water would then be in contact with the overlay face of the specimen. • An insulating lid was placed over the specimen inside the drawer.
  • 50. 48 • The desired number of FT cycles was programmed into the controller for each individual drawer. The temperature range was 10° F to 45 ° F. The machine could complete 3-4 cycles in each day. Figure 12. FT drawer with specimen placed face-down. Manual Procedures (FT Procedure 2) (used in Round 3): • Each of the three shelves on each cart was cleaned and any loose aggregate or standing water was removed. • Four non-metallic washers were placed at the base of each shelf as supports for the specimen, and to ensure that the specimen is slightly off of the bottom of the shelf. • Specimens were placed on the shelves of the cart with the overlay surface facing down (Figure 11). Each of the three shelves of each cart was a water-tight container that could hold two specimens. • Two to three liters of non-salted tap water was placed in the shelves, making sure that there is a sufficient amount of water to cover the surface aggregates. • Each cart was rolled into the walk-in freezer room. This room was set at a temperature of -10° F. • The carts were kept in the freeze-room for 7-8 hours. The specimens were then removed from the freeze room.
  • 51. 49 • The carts were left to thaw overnight to room temperature, approximately 65°F. One FT cycle was achieved in each 24-hour day. 4.2.4.3 High Temperature/UV/Rain/Ambient Temperature (HURA) The High-temperature/UV/rain/ambient temperature (HURA) exposure tests were designed to subject the overlays to repetitive cycles of heat and ultraviolet light followed by “rain” and cooling down (Figure 13). This was intended to represent summer exposure situation when rain may follow a hot sunny day. The peak target concrete temperature during heating was 120º F (at the concrete level directly adjacent to the overlay). Four UV fluorescent lamps located at the ceiling of each HURA drawer provided ultraviolet exposure during the heating period. When temperature of concrete reached 120º F, the overlay surface was rapidly cooled by “rain” (i.e. splashing of water from the drawer’s ceiling) until concrete temperature fell below 70° F. Heating was provided using elements on the bottom of the drawer. All UV bulbs used were 25 watt, 18 in, T8 fluorescent tubes (F25T8350BL18). Figure 13. HURA test cycles: Heat and UV (left), rain and cool down (right). The automated test machine described in the previous section was also used for the HURA tests (Figure 10). The three upper drawers of the test machine were used in Rounds 1 and 2 of testing. The machine was set to complete 21 cycles of heating and cooling in each round. Due to the automated machine’s malfunction after the completion of the second round of HURA tests, a second manually-controlled box was designed and built for simultaneous testing of nine specimens. The manual device for HURA testing consisted of a custom designed wood enclosure. Unlike the automated system, temperature monitoring and release of cooling water was done by a test observer. Figure 14 shows the manual HURA test box. The removable box top had nine heat lamps (one for each specimen) and 4
  • 52. 50 UV light bulb (the same type as those used in the automated system). In addition to the heat lamps, an electric heater also provided general heating for the inside of the box through a side access duct. The top surfaces of the specimens (overlays) were cooled by a system of pipes that sprayed each specimen individually with tap water to rapidly cool the surface of the overlay. Figure 14. Manual HURA test box. Automated Procedures (HURA Procedure 1) (used in Rounds 1 and 2): • HURA drawers were cleaned and any loose aggregate or standing water was removed. • Four non-metallic washers were placed on the base of the HURA drawer as supports for the specimens. This would allow the “rain” water to drain under the specimens when the cooling cycle was engaged. • The specimens were placed in the drawer on the washers with the overlay surface facing up (upright) exposing it to the UV lamps and the water spout. • A temperature sensor with a splash guard was placed on the side wall of the concrete specimen adjacent to the overlay. The splash guard was used to prevent water from reaching the temperature sensor. • The drawer door was closed and a foam insulation strip was placed over the gap in the drawer. • Each specimen completed 21 HURA cycles.
  • 53. 51 Manual Procedures (HURA Procedure 2) (used in Round 3 only): • Nine specimens were placed inside the box and the lid was closed. • All lamps and the electric heater were turned on. • Once the specimen temperature (on the side wall concrete adjacent to the overlay) reached 120 degrees, the lamps were turned off and the lid was removed. • The cooling pipe system was placed over the box and tap water was turned on. The water was allowed to cool the specimens for roughly 10 minutes until the temperature reading reduced to approximately 70 degrees. • The process was repeated 21 times. • Each manual cycle took roughly 1 hour and 45 minutes. 4.2.4.4 Wear Tests The wear test was designed to simulate the effects of vehicle tire wear on the roadway surface. A three- wheel machine for wear testing of asphalt pavements was originally developed at the National Center for Asphalt Technology (NCAT) and later refined at Auburn University (Erukulla, 2011) (Figure 15). The UWM wear test machine, which was designed for this study (Figures 16 and 17), is a modified version of the NCAT machine. The UWM machine was built into the automated test machine shown in Figure 10. The UWM wear test machine consists of three rotating tires arranged in a circular pattern with a diameter of 12 in (i.e. the diameter of the centerline of tire path circle was 12 in.). The wheels (tires) were 10-in diameter, non-flattening, solid rubber tires with a nominal load capacity of 350 lbs. The wear machine has an adjustable speed control. A speed of 30 rpm was used for all tests performed in this research. Each round of wear testing included 11,000 turns (33,000 tire passages). The total number of tire passages for the three rounds of testing was 99,000. During testing, the specimen is placed in an aluminum container, which acts as a cart that can move horizontally along the length of the machine. The cart can ride on a set of horizontal bearings on the top surface of the machine. The cart is first moved away from underneath the wear device head to allow placement of the specimen. The cart (and the specimen) is then horizontally slid to a position directly under the wear device. The cart is then locked in place so that it would not move during wear tests. The machine head can be raised or lowered (on a linear bearing) using a pneumatic system. When the air pressure (holding the wear device up) is reduced to zero during testing, the weight of the entire wear
  • 54. 52 device is supported on the three tires that are placed on the specimen. The total weight of the wear device head was 114.4 lbs. The top surfaces of specimens were kept wet during the entire period of testing (using dripping tap water). Before the start of testing (Round 0) and after each completed round, the friction coefficient for the tire passage on the specimens was measured. Procedures for measuring the friction coefficients are described in Section 4.2.4.5. The following procedures were used for wear testing: • The specimen was placed on the friction cart (face up) directly under the wear device and secured tightly in place. The cart was also locked in place. • Water was used to wet the top surface of the specimen, and the wear test apparatus (and tires) was lowered onto the specimen (by releasing the air pressure). The central position of the apparatus with respect to the specimen was verified (and changed if necessary). At this stage, the full weight of the apparatus was on the sample. • The machine controller was set to perform 11,000 turns (3 tire passages per each of the 11,000 turns equals 33,000 tire passages). The speed of the turns was set at 30 rpm. • The water supply was adjusted to achieve a steady water drip onto the top surface to maintain the surface in a wet condition for the entire duration of the test. • When the 11000 turns were completed, the specimen cart was slid away from under the tires and the top surface of the block was cleaned with a soft brush and water to remove any tire residue that may have accumulated. • One of the three tires was removed from the head apparatus, and the friction test hardware was inserted in its place. The electrical wires from the test hardware were then plugged in. • The specimen was examined for on any cracks, delamination, or other changes that may have occurred during the previous round of testing. • The specimen cart was slid back under the head apparatus and locked in place. The friction test wheel was then lowered onto the surface of the specimen. • The computer data acquisition system designed to capture load cell (torque) data due to friction was turned on, and the friction test wheel brake assembly was powered. • The wear test machine was turned on to start the turning of the friction wheel assembly. • A control button was used to temporarily lock the brakes on the friction wheel. This button was pressed 12 times or more at approximately 5 second intervals. High-speed force readings were made using the data acquisition system.
  • 55. 53 • The specimen was then removed from the test machine, and the data were recorded for further analysis. Figure 15. Three-Wheel Polishing Device (TWPD) developed by National Center for Asphalt Technology (NCAT) (Erukulla, 2011). Figure 16. UWM-designed wear test device (conceptual drawing).