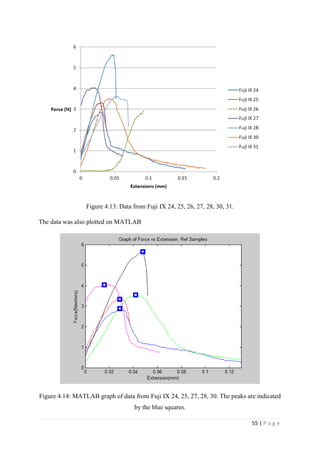
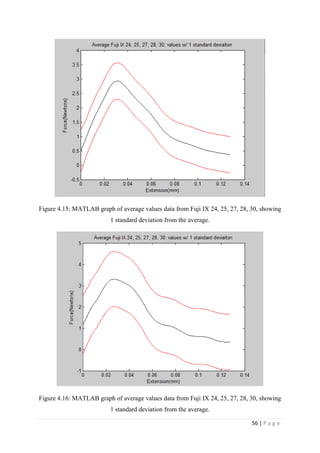
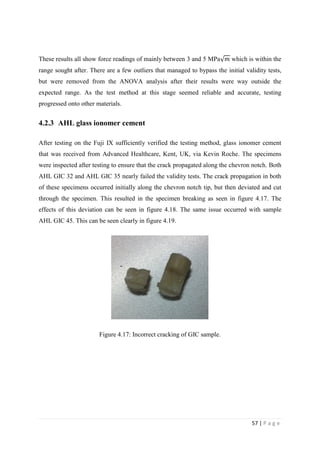
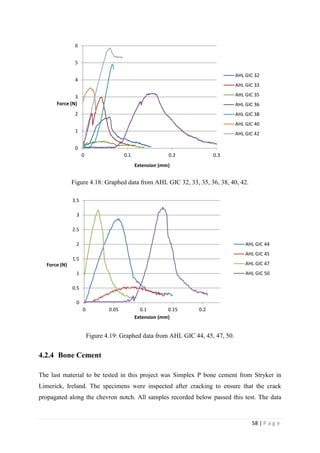
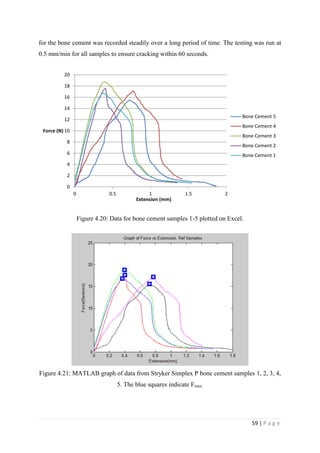
This document summarizes a study that tested the fracture toughness of dental cements modified with nanoparticles. Three materials were tested: Fuji IX dental cement, Advanced Healthcare Ltd (AHL) glass-ionomer cement, and Stryker Simplex P bone cement. Chevron notch fracture toughness testing was performed to determine the average fracture toughness values for each material. The values obtained were: Fuji IX - 0.35 ± 0.1 MPa√m, AHL GIC - 0.33 ± 0.11 MPa√m, Stryker Simplex P - 1.61 ± 0.1 MPa√m. The study aimed to establish a consistent testing method to accurately measure the fracture
![UCD School of Mechanical and Materials Engineering
Report Submission Form
MEEN 30120: Mechanical Engineering Project
Student Name: Killian Victory
Student Number: 11411368
Report Title: Mechanical Testing of Nano-Modified Dental Cements
Plagiarism
Plagiarism is a serious academic offence and is comprehensively dealt with on UCD’s Registry website [UCD
2010a, UCD 2010b]. It is a student’s responsibility to be familiar with the University’s policy on plagiarism. All
students are encouraged, if in doubt, to seek guidance from an academic member of staff on this issue. The UCD
policy document on plagiarism states that “the University understands plagiarism to be the inclusion of another
person’s writings or ideas or works, in any formally presented work (including essays, theses, projects,
laboratory reports, examinations, oral, poster or slide presentations) which form part of the assessment
requirements for a module or programme of study, without due acknowledgement either wholly or in part of the
original source of the material through appropriate citation. Plagiarism is a form of academic dishonesty, where
ideas are presented falsely, either implicitly or explicitly, as being the original work of the author. While
plagiarism may be easy to commit unintentionally, it is defined by the act not the intention. The University
advocates a developmental approach to plagiarism and encourages students to adopt good academic practice by
maintaining academic integrity in the presentation of all academic work” [UCD 2010a, UCD 2010b].
[UCD 2010a] Plagiarism Policy and Procedures - UCD Registry.
www.ucd.ie/registry/academicsecretariat/plag_pol_proc.pdf
[UCD 2010b] A Briefing for Students on Academic Integrity and Plagiarism.
www.ucd.ie/registry/academicsecretariat/plag_brief.pdf
Declaration of Authorship
I declare that all material in this submission is my own work except where there is clear acknowledgement and
appropriate reference to the work of others.
Signature: Killian Victory Date: 02/04/2015](https://image.slidesharecdn.com/01687e7e-04d6-47cb-9214-a3a531e83da3-160224002608/85/11411368_Victory_Killian-2-320.jpg)

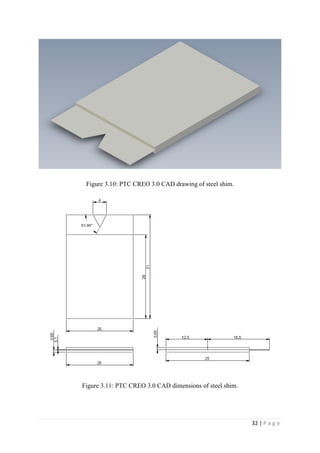
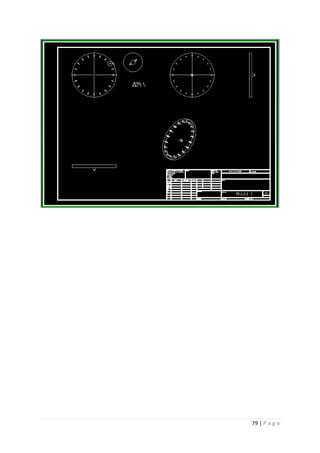
![Figure 3.10: PTC CREO 3.0 CAD drawing of steel shim. Page 32
Figure 3.11: PTC CREO 3.0 CAD dimensions of steel shim. Page 32
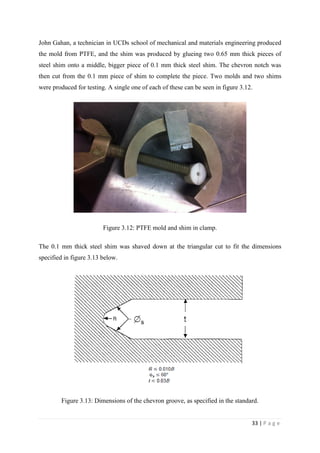
Figure 3.12: PTFE mold and shim in clamp Page 33
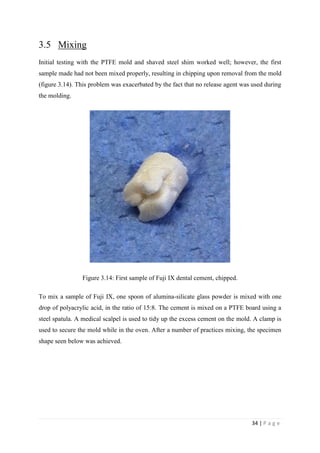
Figure 3.13: Dimensions of the chevron groove, as specified in the
standard. Page 33
Figure 3.14: First sample of Fuji IX dental cement, chipped. Page 34
Figure 3.15: Molded sample of Fuji IX dental cement. Page 35
Figure 3.15: Schematic of a sample attached to the Tinius Olsen
Hounsfield H50KS screw drive materials testing machine with rigs as
outlined in the chevron notch fracture toughness testing standard [8]. Page 35
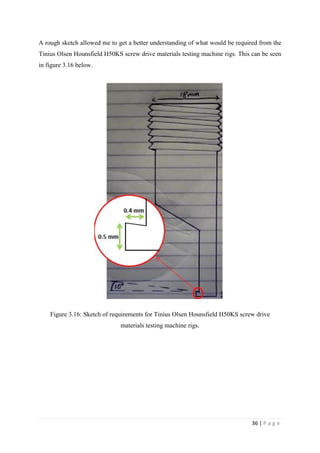
Figure 3.16: Sketch of requirements for Tinius Olsen Hounsfield H50KS
screw drive materials testing machine rigs. Page 36
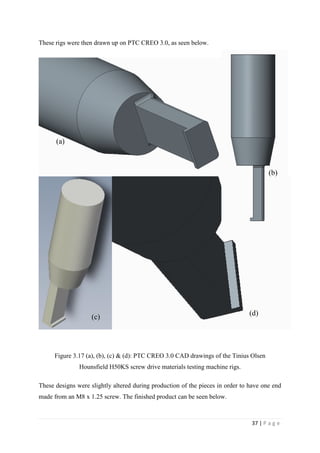
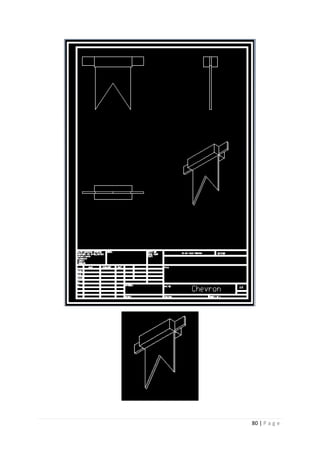
Figure 3.17 (a), (b), (c) & (d): PTC CREO 3.0 CAD drawings of the
Tinius Olsen Hounsfield H50KS screw drive materials testing machine
rigs. Page 37
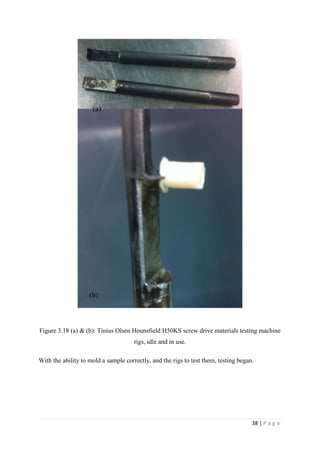
Figure 3.18 (a) & (b): Tinius Olsen Hounsfield H50KS screw drive
materials testing machine rigs, idle and in use.
Page 38
Figure 3.19: Gallenkamp vacuum oven. Page 39
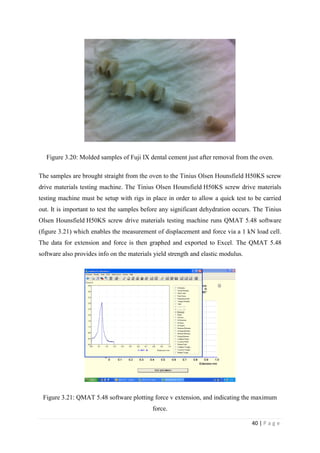
Figure 3.20: Molded samples of Fuji IX dental cement just after removal
from the oven. Page 40
Figure 3.21: QMAT 5.48 software plotting force v extension, and
indicating the maximum force.
Page 40
Figures 3.22: Tinius Olsen Hounsfield H50KS screw drive materials
testing machine with rigs in place.
Page 41
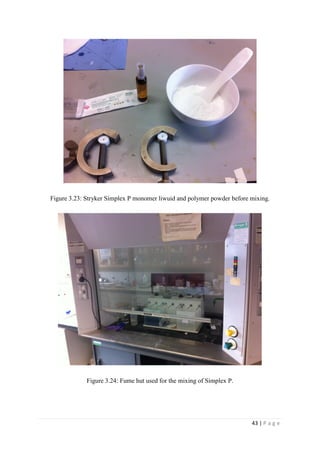
Figure 3.23: Stryker Simplex P monomer liwuid and polymer powder
before mixing.
Page 43
Figure 3.24: Fume hut used for the mixing of Simplex P. Page 43
Figure 3.25: Stryker Simplex P during mixing, known as the doughing Page 44](https://image.slidesharecdn.com/01687e7e-04d6-47cb-9214-a3a531e83da3-160224002608/85/11411368_Victory_Killian-8-320.jpg)
![1 | P a g e
Introduction Chapter 1
1.1 Introduction, context, motivation
Human teeth have evolved over millions of years to give us a strong set of teeth that will last
a lifetime. Very recently, in terms of human existence, longer life and sugar rich diets have
begun to destroy our teeth. Evolution would allow for our teeth to adapt and become resistant
to this decay, however, we are destroying our teeth quicker than evolution can take effect and
adapt to save them. This increase in decay in modern times has greatly increased our need for
a greater care for our teeth, and major advancements have been made in the field of dentistry
as a result.
“The past half century has seen the meaning of oral health evolve from a narrow focus on
teeth and gingiva to the recognition that the mouth is the center of vital tissues and functions
that are critical to total health and well-being across the life span”. [1]
These advancements in dentistry have been made a necessity by the effects of longer life and
sugar rich diets. The use of restorative materials in dentistry is an example of the great
advancements that have been made in the 20th century. A fitting example of the
advancements made in the dental industry is the Atraumatic Restorative Treatment (ART).
ART is a relatively inexpensive non-sophisticated, tooth conservative technique that offers
the opportunity for restorative work in remote areas without electricity. [2]
It has been shown
to be a very effective treatment, demonstrating a very high acceptance rate by children, and
has also resulted in the retention of many teeth that otherwise would have been extracted. [3]
Unfortunately, these great advancements are not yet available to all peoples around the globe.
For this to be possible, specialist dental materials that are cheap, easy to use, and have good
working and mechanical properties must become abundantly available. This leaves us
mandated to research dental materials seeking the most suitable ones for widespread use.
Glass polyalkenoate cements, or glass ionomer cements (GICs), are the most common
material used in the ART approach. [4]
They are used because they are relatively simple to
prepare, chemically bond to enamel and dentine, and release fluoride which has been shown
to help reduce further tooth decay. They are also known to exhibit a low coefficient of
thermal expansion and acceptable aesthetic quality. [5]
GICs may also release calcium and
phosphate ions, they have a thin film thickness (<25μm) making them suitable for](https://image.slidesharecdn.com/01687e7e-04d6-47cb-9214-a3a531e83da3-160224002608/85/11411368_Victory_Killian-12-320.jpg)
![2 | P a g e
cementation and luting. GICs set within 10 minutes which is very beneficial in dentistry.
However, they exhibit relatively poor fracture toughness. To form GICs, polyacrylic acid
(PAA) is dissolved in water and mixed with ion leachable alumino-silicate glass powder.
Figure 1.1: PAA solution and alumina-silicate glass powder before mixing.
1.2 Research Question / Research Hypothesis / Overall
project aim
A GIC that exhibits a better fracture toughness is widely sought after. The effect of adding
nanoparticles to GICs is needed to improve the effective lifetime of a number of dental
applications, including ART. These include restorative purposes e.g. fillings, luting cements
which are used to bind prosthetics to teeth, orthodontic cements, and fissure sealants which
cap teeth to prevent further decay. Research was undertaken by Ph.D. student Kevin Roche to
investigate the effects of adding nanoparticles of fluorhydroxyapatite (FHA) to the glass
ionomer cement in order to change the mechanical properties of the cement. [6]
Kevin
performed many different tests on his samples; however, his testing of fracture toughness was
suggested to be excluded due to a number of difficulties that arose. These difficulties include:
“The indentation method being unsuitable as porosity and surface dehydration interfered with
crack formation. The chevron notch method was slightly better but requires careful, time-](https://image.slidesharecdn.com/01687e7e-04d6-47cb-9214-a3a531e83da3-160224002608/85/11411368_Victory_Killian-13-320.jpg)
![3 | P a g e
consuming preparation and a large number of tests, so is not suitable for preliminary tests.” [6]
The aim of this project is to properly carry out the testing of the fracture toughness of Kevin
Roche’s nano-modified GICs.
1.3 Project Objectives and Overall Methodology
1.3.1 Objective
To develop a testing method for evaluating the plane-strain chevron notch fracture toughness
of nano-modified dental cements, specifically FHA GICs, and to evaluate the accuracy of
said testing method by testing a number of different GICs, as well as testing Stryker Simplex
P bone cement, and comparing the resulting fracture toughness values with the industry
standard for those materials.
1.3.2 Methodology
Firstly, I had to ascertain any specific requirements needed to carry out the testing.
Cylindrical samples of 4 mm diameter and 6 mm length are to be molded and cut according
to ASTM E-1304 [8]
. Certain materials were organised for testing: Perspex, bone cement, and
GICs. A decision has to be made over whether the samples will be molded with the chevron
notch in them, or molded as cylinders and then cut to the specific dimensions. Rigs have to be
built to allow for cutting, molding, and testing. These rigs are to be attached to the T200 saw,
and the Tinius Olsen Hounsfield H50KS screw drive materials testing machine. Special saws
are required in order to make the cuts. They were ordered from UKAM Industrial Superhard
Tools, in Valencia, California, USA. Two saws are needed to make three cuts if the chevron
notch can’t be molded into the sample. Regardless of approach, the samples must be kept
wet, and at 37°C throughout molding, cutting, storing, and testing. One type of fracture
toughness testing will be undertaken, measuring KIVM; ‘plane-strain chevron notch fracture
toughness relating to extension resistance with respect to a slowly advancing steady-state
crack, based on the maximum force observed before cracking.[8]
Resulting data is graphed
and analysed, including an ANOVA analysis.](https://image.slidesharecdn.com/01687e7e-04d6-47cb-9214-a3a531e83da3-160224002608/85/11411368_Victory_Killian-14-320.jpg)
![4 | P a g e
Technical Foundations & Literature
Review Chapter 2
2.1 Tooth Decay and Restorative Dental Materials
A human beings mouth is slightly acidic by nature, with an average pH value of between 5.6
and 7.9. The critical pH with regard to dental erosion is 5.6, meaning when the pH level
drops below this tooth decay occurs. When sugary foods are eaten, they mix with the bacteria
in your mouth to form acid. This acid acts to break down the enamel of teeth. The main
bacterium that produces acid is streptococcus mutans, and the acid this produces is the
biggest culprit in tooth decay. Each time you have a sugary snack or meal, the pH level in
your mouth drops. Depending on the food, it drops to a pH of between 3.8 and 6.5. The pH
level in your mouth will begin to rise after eating; however, it normally takes at least 30
minutes to recover to normal levels. This can be significant, as if a snack (even a polo mint
counts as a sugary snack) is eaten before the pH level recovers, the pH level will remain low,
and this will inevitably lead to a greater risk of tooth decay. [9]
For reasons like this, it is very
important to use materials with a high caries resistance (resistance to decay) in dentistry.
Glass ionomer cements have this high caries resistance thanks to their capacity to reabsorb
fluoride from the oral environment and release it at a later stage. [10]
Glass ionomer cements are filling materials based on the reaction of silicate glass powder and
polyalkenoic acid. The multi-applicable tooth-coloured materials were introduced in 1972 for
use as restorative materials for anterior teeth. They are particularly suitable for the job as
they, they are relatively simple to prepare, chemically bond to enamel and dentine (dentine is
located below the enamel of a tooth and may become exposed through tooth decay, seen in
figure 2.1), and release fluoride which has been shown to help reduce further tooth decay.
They are also known to exhibit a low coefficient of thermal expansion and acceptable
aesthetic quality. [5]
GICs may also release calcium and phosphate ions, they have a thin film
thickness (<25μm) making them suitable for cementation and luting. GICs set within 10
minutes which is very beneficial in dentistry. However, they exhibit relatively poor fracture
toughness.
When a tooth is damaged, it requires a number of things to help itself repair. It uses Ca2+
ions
to repair the crystalline lattice of the enamel. It uses fluoride ions to reduce the risk of further](https://image.slidesharecdn.com/01687e7e-04d6-47cb-9214-a3a531e83da3-160224002608/85/11411368_Victory_Killian-15-320.jpg)
![5 | P a g e
tooth decay by preventing bacterial growth around the edges, and it uses phosphate to treat
insipient dental decay by remineralisation. A high frequency of sugar attacks results in a net
loss of Ca2+
ions. This leads to a breakdown of the hydroxyapatite particles in the enamel.
This breakdown results in de-calcination where firstly a white spot appears, which then
slowly fades to a brown spot and then a black one.
Figure 2.1: Cross-section of a tooth. From [6]
Dental caries involves an imbalance of the interactions between the tooth and the covering
microbial film, leading to demineralisation and degradation of the tooth, and the formation of
caries lesions [13]
. Bacteria destroy the enamel by mixing with sugar to produce an acid, and
lead to a decrease in the pH, eroding the tooth. Ions in the saliva help to repair the decay
damage. The net rate of mineral loss or gain is dependent on the balance between these two
processes [14]
. If mineral loss is dominant or the caries lesion has grown too large, then some
restorative dental work must be undertaken. This typically involves cleaning the lesion and
replacing lost enamel or dentine with a restorative material (figure 2.2).
The ideal qualities looked for in filling materials are as follows: [9]
Aesthetic
Biocomposite
Bonds well to teeth
Releases fluoride
GICs have all of these qualities making them ideal for a large range of dental applications, as
previously mentioned.](https://image.slidesharecdn.com/01687e7e-04d6-47cb-9214-a3a531e83da3-160224002608/85/11411368_Victory_Killian-16-320.jpg)
![6 | P a g e
Figure 2.2: GICs as a filling material, before and after. From [38]
2.1.1 Fluoride
Fluoride is hugely beneficial when present in restorative dental materials. It improves the
working characteristics of the cement. It lowers the fusion temperature, increases the strength
of the cement when set, and it enhances translucency. The absorption of fluoride from GIC
into dental plaque is impressive. After 28 days, plaque, accumulated around GIC restorations
in enamel blocks carried by patients using removable intraoral appliances, contained over six
times more fluoride than similar restorations with composite resin. [18]
Figure 2.3: Fluoride ion. From [39]
2.2 Glass Ionomer Cements
GICs are extremely simple to use, simply scraping out the cavity with hand tools is the only
preparation required. They must be mixed from hot gum to cold gum, and be put in place
before hardening begins. They usually set within 10 minutes. After this, continual cross-
linking for the next 24 hours allows for increased hardness. Hardening slows after the first
day, but doesn’t come to a complete stop until several months after input. Unfortunately,
glass ionomer cements often exhibit poor fracture toughness. They lack the necessary
strength, toughness, and wear resistance to survive in a load-bearing environment. This limits
their uses to smaller cavities or fissures. Hence, the aim of current research is to improve the](https://image.slidesharecdn.com/01687e7e-04d6-47cb-9214-a3a531e83da3-160224002608/85/11411368_Victory_Killian-17-320.jpg)
![7 | P a g e
working and mechanical properties of GICs. This will in turn allow applications of ART to
extend around the globe.
A theoretical solution to this problem can be found by looking at tooth enamel. Enamel is a
nanocomposite, consisting of millions of tiny ceramic crystals of HA surrounded by organic
material. The hydroxyapatite forms in a flattened hexagonal shape and the enamel apatite
structures form a prismatic structure (figure 2.4). Acid etch technique using acid primers used
to make surface of enamel more amenable. [10]
Figure 2.4: Prismatic enamel structure. From [40]
It can be seen that enamel also has a hierarchical structure, placing the nanocrystals in large
groups, resulting in organised micro-scale prisms. The structure of enamel exceeds all of the
dental materials used today in hardness, toughness, and chemical stability.
It has been hypothesized that incorporating a similar structure into GICs may help them to
replicate some of the strong mechanical properties exhibited by enamel, making them much
more effective in the dental field. The challenge for us is to find ways to control the growth
and assembly of biomimetic nanoparticles in GICs. [6]
Working on the nanoscale presents
many challenges, and these will have to be overcome to succeed in producing glass ionomer
cement with good mechanical properties.
The GIC material to be tested was investigated in a thesis by Kevin Roche. [6]
Fluorhydroxyapatite nanoparticles were used to reinforce the glass ionomer cement.
Specifically, FHA nanoparticles were added to hand-mixed glass-ionomer cements suitable](https://image.slidesharecdn.com/01687e7e-04d6-47cb-9214-a3a531e83da3-160224002608/85/11411368_Victory_Killian-18-320.jpg)
![8 | P a g e
for use in ART with the hope that they might improve the mechanical. Three different aspects
of this topic were emphasised: fluoride substitution in fluorhydroxyapatite nanoparticles;
modification of these nanoparticles for improved mixing with glass ionomer cements; and the
effect of nanoparticles on the working and mechanical properties of the cements. [6]
As previously mentioned, to form GICs, an aqueous polyalkenoic acid, polyacrylic acid
(PAA), is dissolved in water and mixed with ion leachable alumino-silicate glass powder.
Conventional GICs were first introduced in 1972 by Wilson and Kent. When the powder and
liquid are mixed together, an acid-base reaction occurs to form the cement.
GICs can be either high viscosity or low viscosity, depending on the ratio of the glass powder
to the polyalkenoic acid. It has been reported that high viscosity GICs are more successful in
ART. The type of application predetermines the viscosity of the cement, which can be
adjusted by varying the particle size, particle distribution and the powder:liquid ratio.
The use of GICs is often limited in clinics due to its relatively inferior mechanical properties
and sensitivity to initial desiccation and moisture. [20]
2.2.1 Alumino-Silicate Glass
Glass is a non-crystalline material typically containing silicon. In the case of GICs, they also
contain a significant level of alumina. A polymer that comprises repeat units of both
electrically neutral repeating units and a fraction of ionized units covalently bonded to the
polymer backbone as pendant moieties is called an ionomer. [15]
GICs consist of a mix of the
two.
GICs are usually split up into 5 different categories:
1 Conventional glass ionomer cements
2 Metal-reinforced glass ionomer cements (addition of silver-amalgam alloy powder to
conventional materials increased the physical strength of the cement and provided
radiodensity)
3 Hybrid ionomer cements (combine an acid-base reaction of the traditional glass ionomer
with a self-cure amine-peroxide polymerization reaction)
4 Resin modified glass ionomer cements (conventional glass ionomer cements with
addition of HEMA and photoinitiators)](https://image.slidesharecdn.com/01687e7e-04d6-47cb-9214-a3a531e83da3-160224002608/85/11411368_Victory_Killian-19-320.jpg)
![9 | P a g e
5 Tri-cure glass ionomer cements (incorporate a chemical curing tertiary amine-peroxide
reaction to polymerize the methacrylate double bonds along with the photo-initiation and
acid-base ionic reaction)
The resin-modified glass ionomer cement has shown advantageous mechanical and adhesive
properties compared with conventional GICs [21]
. However, the biological effects and
cytotoxicity of this type of material remain to be clarified [22, 23]
. The resin-modified glass
ionomer cements generally have a much lower release of fluoride than the conventional glass
ionomer materials. Some types have also demonstrated significant water absorption. [16]
Metal-reinforced glass ionomer cements fall short on the aesthetic quality and therefore are
considered old fashioned. The addition of calcium oxide, phosphorous pentoxide, silicon
dioxide and aluminium oxide yields diametral tensile strengths and flexural strengths
between 2 and 4.5 times higher than unmodified GICs. [29]
A typical composition of the alumina-silicate glass in conventional GICs is shown in Table
2.1. However, it should be noted that compositions can vary significantly.
Component Weight %
SiO2 28.9
Al2O3 14.2
ALF3 11
CaF2 12.8
NaF 12.8
AlPO4 24.2
Table 2.1: The standard glass composition used in glass-ionomer cements. From [11]
The glass powder used was supplied by Advanced Healthcare in Kent in the United
Kingdom. It must be acid soluble to be used in producing GIC. The raw materials are fused
together to form a uniform amorphous solid by heating them to temperatures between 1100
°C and 1500 °C. A high amount of alumina in the glass increases its reactivity with the liquid.](https://image.slidesharecdn.com/01687e7e-04d6-47cb-9214-a3a531e83da3-160224002608/85/11411368_Victory_Killian-20-320.jpg)
![10 | P a g e
The intended size of the glass particles ranges from 15 µm to 50 µm. The maximum particle
size is 15 µm for luting agents and 50 µm for restorative cements.
William Carty et al. [12]
investigated the different amounts of alumina that can be dissolved in
silicate glasses incorporating the glass formation boundary. Chemical impurities in the oxide
ceramics typically segregate to the grain boundary, and it is thought that the grain boundary
chemistry is a result of the glass forming boundary. They investigated the effect glass growth
had on the impurities. They found that the amount of alumina that can be dissolved in the
glass is temperature dependent. As temperatures increase, the potential amount of alumina in
the glass increases. If the glass composition exceeds the glass forming boundary, conditions
are then favourable for growth. Crystal growth improves the strength and toughness of the
glass, depending on the amount of alumina present.
2.2.2 Polyacrylic Acid
Polyacrylic acid (figure 2.5) incorporates all synthetic high molecular weight polymers of
acrylic acid. The PAA is dissolved in water before being mixed with the glass. A number of
different polyacrylic acids with different molecular weights were available for use, including:
E5, E7, E9, and E11. This is an important factor in the choice of polyacrylic acid as an
increase in the molecular weight (or concentration) of polyacrylic acid will lead to an
increase in the strength of the set cement. However, choosing a high molecular weight
polyacrylic acid also has some downsides; it will increase viscosity which makes handling
and manipulation more difficult. Fracture toughness and toughness increase with both PAA
molar mass and concentration. [17]
A suitable PAA will increase reactivity, decrease viscosity
and reduce the tendency for gelation (solidification). Tartaric acid is often included in the
PAA mixture as it can help to control the setting time (it increases hardening speed).
Polyacrylic acid is hygroscopic, brittle and colourless in nature with a glass transition
temperature of nearly 106 °C. At temperatures above 200 °C to 250 °C, it loses water and
becomes an insoluble cross-linked polymer anhydride. Solubility of dried PAA in water
increases with rise in temperatures. Concentrated solutions of PAA in water are thixotropic in
nature.](https://image.slidesharecdn.com/01687e7e-04d6-47cb-9214-a3a531e83da3-160224002608/85/11411368_Victory_Killian-21-320.jpg)
![11 | P a g e
Figure 2.5: Chemical structure for polyacrylic acid. From [41]
2.2.3 The setting reaction
An acid-base reaction occurs during setting. It occurs between the acidic polyelectrolyte and
the alumina-silicate glass. The hydrolysis of Si-O-Al bonds is considered the first step in the
reaction, releasing cations which then cross-link the polyacid (figure 2.6). The polyacid
attacks the glass particles to release cations and Fluoride ions, leaving only a salt gel matrix.
During the initial setting in the first 3 hours calcium ions react with polycarboxylate chains.
Figure 2.6: Hydrolysis of Si-O-Al bond. From [11]](https://image.slidesharecdn.com/01687e7e-04d6-47cb-9214-a3a531e83da3-160224002608/85/11411368_Victory_Killian-22-320.jpg)
![12 | P a g e
Figure 2.7: Glass-ionomer cement setting reaction. From [6]
For 48 hours, the trivalent aluminium ions react, decomposing 20 % - 30 % of the glass by
proton attack. The fluoride and phosphate ions are insoluble salts and complexes. The sodium
ions produce a silica gel. When the cement is fully set the structure is a composite of glass
particles surrounded by silica gel in a matrix of poly-anions which are cross-linked by ionic
bridges. There are small particles of silica gel containing fluorite crystallites within this
matrix. It is during this process that the GIC can chemically bond to enamel and dentine. This
bonding is attributed to the phosphate and Ca2+
ions, and is more successful on a clean
surface. Acid etching is used to ensure the required cleanliness without removing too much of
the calcium ions. In the reaction, the aluminium ions replace the Ca2+
ions, and some sodium
ions may replace the hydrogen ions of carboxylic groups. The remaining ions are uniformly
dispersed.
The setting reaction can be split into three phases – dissolution, gelation, and hardening.
Dissolution consists of when the powder and liquid are mixed, the acid attacks the silica gel,
the glass loses its Al, Ca, Na, and F ions, and the acid releases its H ions, which diffuse to the
glass. Gelation consists of the divalent Ca ions reacting with carboxyl groups of the acid.
Finally, hardening consists of the trivalent Al ions crosslinking the polymer. As the reaction
‘matures’ the cross linked phase becomes hydrated due to the water in the mixture. The
amount of water in the mixture is very important as it initially serves as the reaction medium,
and then it slowly hydrates the cross linked agents. This is crucial in achieving a stable gel
structure.](https://image.slidesharecdn.com/01687e7e-04d6-47cb-9214-a3a531e83da3-160224002608/85/11411368_Victory_Killian-23-320.jpg)
![13 | P a g e
2.2.4 Sources of error in GIC applications
The following manipulative considerations for GIC must be satisfied to avoid errors, i.e. to
avoid a short retention life:
Clean and dry tooth surface
Excess cement must be removed at the appropriate time
The consistency of the cement (poorly mixed results in an incomplete coating) to
allow for a complete coating of the surface irregularities
Allow for natural gelation and hardening without disturbance
Protection of the restoration surface must be ensured to prevent cracking or
dissolution.
2.2.5 Properties
The setting time is less than ten minutes. [9]
Complete setting takes less than 24 hours.
When used as luting cement the chemistry is altered so that the setting time is less
than four minutes.
The film thickness of GICs is roughly 15-25 µm (similar to that of zinc phosphate
cement).
GICs are reasonably aesthetically pleasing, as they are tooth coloured, and can be
produced in different shades. Resin-modified GICs have increased translucency,
although they usually suffer on the surface finish, and discolouration has been
observed after polishing.
A strong bond is achieved between the cement and the dental hard tissues is realised
through an ionic exchange at the boundary. Polyalkenoate chains enter the molecular
surface of dental apatite, replacing phosphate ions. Calcium ions are displaced equally
with the phosphate ions so as to maintain electrical equilibrium. This leads to the
development of an ion-enriched layer of cement that is firmly attached to the tooth.
[19]
The shear bond strength of conventional glass ionomer cements to conditioned
enamel and dentin is relatively low, varying from 3 to 7 MPa. This is essentially a
measurement of the tensile strength of the cement.
The coefficient of thermal expansion in GICs is close to that of dental hard tissues
resulting in good margin adaptation.](https://image.slidesharecdn.com/01687e7e-04d6-47cb-9214-a3a531e83da3-160224002608/85/11411368_Victory_Killian-24-320.jpg)
![15 | P a g e
2.3 Atraumatic Restorative Treatment
Atraumatic Restorative Treatment is a method of caries management that was primarily
developed for use in 3rd
World countries around the globe. It is a relatively inexpensive non-
sophisticated, tooth conservative technique that offers the opportunity for restorative work in
remote areas without electricity. [2]
In these regions, there are few dental facilities and the
populations need for them is high. It is well recognized by the World Health Organization.
The technique is simple, handheld instruments are used to break through the enamel and
remove all of the caries possible. After that, the cavity is filled using a high-viscosity GIC.
This results in increased strength under functional loads. Restoring carious teeth in third
world countries is an important objective, ART is the most suitable method for achieving this,
and glass ionomer cements are the material of choice. They are particularly suited to 3rd
world work as they have shown remarkable success when used in restorative dental work for
children. GICs are suited to a restoration in the primary dentition because of their ability to
release fluoride and to adhere to dental hard tissues. Also, because, they only require a short
time to fill the cavity, glass ionomer cements present an additional advantage when treating
young children.
2.4 Hydroxyapatite nanoparticles
Hydroxyapatite (HA) is a naturally occurring mineral form of calcium apatite. HA is part of
the complex apatite group, and it is the hydroxyl endmember. The OH- ion can be replaced
by fluoride or chloride, producing fluorapatite or chlorapatite. Pure hydroxylapatite powder is
white in colour. Biomimetics is the imitation of elements of nature in human applications.
HA (figure 2.8) is classed as a biomimetic nanoparticle thanks to its excellent bioactivity (it
has the same basic building blocks as enamel), and this makes it very suitable for use in ART.](https://image.slidesharecdn.com/01687e7e-04d6-47cb-9214-a3a531e83da3-160224002608/85/11411368_Victory_Killian-26-320.jpg)
![16 | P a g e
Figure 2.8: Hydroxyapatite nanoparticles. From [7]
Hydroxyapatite can be synthesized following the reaction equation below:
10 Ca(OH)2 + 6 H3PO4 → Ca10(PO4) 6(OH)2 + 18H2O
Ulrich Lochbauer [28]
carried out some work on reactive fibre reinforced glass ionomer
cements in May 2010, after which he recommended the inclusion of HA. His work included
the addition of silver-tin alloy particles into the GIC matrix to increase strength and
toughness. He noted an increase in fracture toughness but a decrease in fluoride release. He
suggested the addition of hydroxyapatite to increase bonding strength.
Yap et al. evaluated hydroxyapatite-ionomer hybrid cements that were heated at 800°C for 4
hours. The hydroxyapatite cements showed significant hardness over regular GICs. However,
the heating effects were material dependent and had some positive and some negative effects
[30]
.
The addition of HA into GIC enhances and hastens the rate of development of the cement’s
fracture toughness, maintains long-term bond strength to dentin and does not impede
sustained fluoride release. [32]
Hydroxyapatite (HA) plays an important role in orthopedics and dentistry due to its excellent
bioactivity. Its remarkably similar nature to enamel helps with osseointegration. However,
thermal decomposition and poor resistance to corrosion in an acid environment have](https://image.slidesharecdn.com/01687e7e-04d6-47cb-9214-a3a531e83da3-160224002608/85/11411368_Victory_Killian-27-320.jpg)
![17 | P a g e
restricted HA’s applications. It has been suggested that fluorhydroxyapatite would result in a
more stable setting.
2.4.1 Fluorhydroxyapatite
Fluorhydroxyapatite was added to the GIC to improve the working mechanical properties
(figure 2.9). Novel XRD1
and FTIRS2
methods of measuring fluoride substitution were used
to measure the amount of fluoride present in the nanoparticles [6]
. These were found to be
more accurate and more practical than more commonly used bulk chemical methods, such as
the F-electrode, which cannot distinguish apatite fluoride from other fluoride containing
phases, such as calcium difluoride. XRD and FTIRS also provide structural information that
is as critical to the biochemical properties of the particles as the fluoride content.
Figure 2.9: TEM showing synthesized fluorhydroxyapatite nanoparticles with highly
agglomerated nanorods. From [6]
1
X-ray diffraction is an analytical technique used primarily for the identification of
compounds through the interaction of a monochromatic x-ray beam and the crystalline
specimen. In this technique crystalline atoms cause a beam of incident X-rays to diffract off a
specimen into many specific directions. By measuring the angles and intensities of these
diffracted beams in the chamber, a crystallographer can ascertain information about the
crystal structure of an unknown substance.
2
Fourier transform infrared spectroscopy is a technique which is used to obtain an infrared
spectrum of absorption, emission, photoconductivity or Raman scattering of a solid, liquid or
gas. An FTIR spectrometer simultaneously collects high spectral resolution data over a wide
spectral range.](https://image.slidesharecdn.com/01687e7e-04d6-47cb-9214-a3a531e83da3-160224002608/85/11411368_Victory_Killian-28-320.jpg)
![18 | P a g e
A ‘biomimetic’ route was also studied where FHA was precipitated via octacalcium
phosphate as an intermediate phase, in a manner more similar to natural tooth enamel. The
highly elongated blade-like particles produced by this route closely resemble natural enamel
crystals and are well suited to forming highly aligned nanostructures.
Chen Y and Miao X [24]
tested several fluorhydroxyapatite ceramics with the generic
chemical formula Ca10(PO4)6(OH)(2-2x)F2x, where x = 0.0, 0.2, 0.4, 0.6, 0.8, & 1.0.
X > 0.4 showed much improved thermal stability and a greater resistance to corrosion. These
results were indicated via thermogravimetric analysis, and corrosion testing using a 2.5 wt. %
citric acid solution. It was also noted that the fluorine addition into the HA matrix slowed the
densification of the FHA ceramics.
Behroozibakhsh et al. undertook an experiment to determine the effect of nano-
fluorohydroxyapatite on defected enamel and remineralization process. The evaluation of
remineralized samples by AFM and SEM images showed the demineralized enamel surfaces
were covered with synthetic powders after 7 days. This indicated that fluorhydroxyapatite
nano-particles may contribute to the repair of demineralized enamel with overlaying on
defective areas and can be used as an enamel remineralizing agent. [25]](https://image.slidesharecdn.com/01687e7e-04d6-47cb-9214-a3a531e83da3-160224002608/85/11411368_Victory_Killian-29-320.jpg)
![19 | P a g e
2.5 Bone Cement
Bone cement will also be used in this project, as a further step to validate the accuracy of the
method used. Bone cement has been used since the middle of the 20th
century to relatively
successfully secure artificial joints. Bone cement plays the important role of an elastic zone
when filling the free space between the prosthesis and the bone. This is necessary because the
human hip is acted on by approximately up to 1 kN.
Bone cement is made up of 2 Main Components:
• Polymer (powder)
• Monomer (liquid)
These two components are made up of a blend of ingredients which give each type of bone
cement its unique characteristics.
Simplex P Bone Cement Polymer Ingredients
• 75% Methyl Methacrylate Styrene Copolymer
• 15% Polymethylmethacrylate
• 10% Barium Sulfate
PMMA began its uses clinically in the 1940s in plastic surgery. Comprehensive clinical tests
of the compatibility of bone cements with the body were conducted before their use in
surgery. The excellent tissue compatibility and biomimetics of PMMA allowed bone cements
to osseointegrate well and therefore bone cement is suitable for use within the human body.
Nowadays, bone cement is considered a reliable anchorage material with its ease of use in
clinical practice and particularly because of its proven long survival rate with cemented-in
prostheses.
While mixing, the bone cement viscosity changes over time from a runny liquid into a dough-
like state that can be safely applied and then finally hardens into solid hardened material. The
set time can vary depending on which cement is in use. During the exothermic free-radical
polymerization process, the cement heats up. This polymerization heat reaches temperatures
of around 82-86 °C in the body [44]
. This temperature is superior to the critical level for the
protein denaturation in the body. The cause of the low polymerization temperature in the](https://image.slidesharecdn.com/01687e7e-04d6-47cb-9214-a3a531e83da3-160224002608/85/11411368_Victory_Killian-30-320.jpg)
![20 | P a g e
body is the relatively thin cement coating, which should not exceed 5 mm, and the
temperature dissipation via the large prosthesis surface and the flow of blood.
Gentamycin, when used in combination with tobramycin, in bone cement, shows a
synergistic effect, with a 68% greater elution of tobramycin (P = 0.024), and 103% greater
elution of vancomycin from the bone cement (P = 0.007), compared to controls containing
only one antibiotic [44]
.
Fracture of the poly(methyl methacrylate) bone cement mantle may lead to the loosening and
ultimate failure of cemented total joint prostheses. The addition of certain fibers to the bone
cement increases fracture resistance and may reduce, if not eliminate, in vivo fracturing.
Titanium has been noted as one of these fibers. Topoleski and Ducheyne [47]
found that
scanning electron microscopy revealed important toughening mechanisms such as
fiber/matrix debonding, local fracture path alteration, and ductile fiber deformation and
fracture when titanium fibers were added at a 5 % content. However, fiber fracture was
observed supplying evidence that the critical fiber length was exceeded.
2.6 Fracture Toughness
In engineering structures, particularly heat-treated steels, cracks are likely to arise from weld
defects, inclusions, surface damage, etc. and it is necessary to design structures with the
knowledge that cracks are already present and capable of propagation at stresses below the
macroscopic yield stress as measured in a tensile test. [26]
Fracture toughness is a measurement of a material’s ability to resist catastrophic failure and is
a better indicator of clinical strength than average stress-based tests [27]
. It describes the
ability of a material containing a crack to resist fracture, and is one of the most important
properties of any material for many design applications. It is an important factor in choosing
dental materials as low fracture toughness can result in the failure of a treatment, especially in
an acidic load-bearing environment. A fracture toughness parameter is now being employed
to measure the tendency of cracks of given dimensions to propagate under particular stress
conditions. The general procedure in measuring the fracture toughness parameter is to
introduce a crack of suitable size into a specimen of suitable dimension and geometry. The
specimen is then loaded slowly and the crack extension measured up until the critical](https://image.slidesharecdn.com/01687e7e-04d6-47cb-9214-a3a531e83da3-160224002608/85/11411368_Victory_Killian-31-320.jpg)
![21 | P a g e
condition. The linear-elastic fracture toughness of a material is determined from the stress
intensity factor at which a thin crack in the material begins to grow.
A number of types of fracture toughness testing are available to be undertaken, measuring KIV
(plane-strain chevron notch fracture toughness relating to extension resistance with respect to
a slowly advancing steady-state3
crack), KIVj (relating to extension resistance with respect to
sporadically advancing crack), and KIVM (based on the maximum force observed before
cracking i.e. no loading-unloading cycles are required) [8]
. Due to the fact that the Tinius
Olsen Hounsfield H50KS screw drive materials testing machine is not able to run loading-
unloading cycles, only KIVM is viable.
Mitchell et al. [31]
evaluated the fracture toughness of glass ionomer luting cements and
determined whether or not the method of mixing GICs influenced the value obtained. The
resin modified cements showed the highest fracture toughness, and the capsulated cements
were more likely to resist clinical failure than the hand-mixed cements. Kevin Roche [6]
spent
some time collaborating with Mitchell et al. in Belfast; “Some synthesis and testing of glass
ionomer cements was carried out at Queen’s University Belfast with Dr Christina Mitchell
and Dr Nicholas Dunne.”
Kevin concluded that the dispersed nanoparticles are “unlikely to lead to any significant
improvement in hand-mixed GICs for ART, as the requirements for good mixing properties
are constantly in competition with the requirements for good mechanical properties.”[6]
It is
required that the nanoparticles be homogeneously mixed throughout the matrix, which is very
difficult with hand-mixed GICs and can often lead to poorer working properties. Kevin
achieved good mechanical properties evident through compressive strength tests using the
Tinius Olsen Hounsfield H50KS screw drive materials testing machine, and Vickers hardness
and indentation fracture toughness testing using a Vickers Indenter. He attempted to carry out
some plane-strain chevron notch fracture toughness testing as well but discovered that his
results were insufficient due to a number of difficulties encountered regarding the working
conditions of the GICs, which slowed down the testing. “The indentation method being
unsuitable as porosity and surface dehydration interfered with crack formation. The chevron
3
Defined as, a crack that has advanced slowly until the crack-tip plastic zone size and crack-
tip sharpness no longer change with further crack extension. Although crack-tip conditions
can be a function of crack velocity, the steady-state crack-tip conditions for metals have
appeared to be independent of the crack velocity within the range attained by the loading
rates specified in this test method.](https://image.slidesharecdn.com/01687e7e-04d6-47cb-9214-a3a531e83da3-160224002608/85/11411368_Victory_Killian-32-320.jpg)
![22 | P a g e
notch method was slightly better but requires careful, time-consuming preparation and a large
number of tests, so is not suitable for preliminary tests.” [6] This project will attempt to
overcome any difficulties that arose due to poor working conditions and comprehensively
investigate the chevron notch fracture toughness of the glass-ionomer cements.
2.6.1 Chevron Notch Fracture Toughness
The method undertaken in this project covers the determination of planestrain (chevron-
notch) fracture toughnesses, KIv or KIvM, of metallic materials. Fracture toughness by this
method is relative to a slowly advancing steady state crack initiated at a chevron-shaped
notch, and propagating in a chevron-shaped ligament. This test method uses either chevron-
notched rod specimens of circular cross section, or chevron-notched bar specimens of square
or rectangular cross section. [8]
The fracture toughness was calculated by the following formula:
𝐾𝐼𝑣𝑀 =
(𝐹 𝑚𝑎𝑥)(𝑌∗𝑚)
(𝐵)(√ 𝑊)
(eq. 1)
Fmax was extracted for the graphed data for each sample.
Y*m4
for the chevron notch used is 29.21. This value is specified in the standard for chevron
notch fracture toughness testing [8]
. It is specific to a chevron notched rod specimen with a
width to length ratio of 1.45. The value of 29.21 was derived from the following: Y* =
exp[C0 + C1 r + C2 r2
+ C3 r3
+ C4 r4
], where C0 = 5.052, C1 = −9.488, C2 = 19.78, C3 =
−18.48, and C4 = 6.921. These values were extrapolated from equations in [42]
. Y* is the
dimensionless stress intensity factor for a crack, and Y*m is the minimum value of this and
indicates the critical crack length.
B is the diameter of the chevron notched rod, and W is the length.
4
Defined as, a dimensionless parameter that relates the applied force and specimen geometry
to the resulting crack-tip stress-intensity factor in a chevron-notch specimen test.](https://image.slidesharecdn.com/01687e7e-04d6-47cb-9214-a3a531e83da3-160224002608/85/11411368_Victory_Killian-33-320.jpg)
![23 | P a g e
2.6.1.1 Specimen Dimensions
The dimensions of the specimen must meet the following specifications, seen in figure 2.10
below. The cross sectional area of the short rod chevron notched specimen is 1.256637x10⁻⁵
m2
.
Figure 2.10: Sample Dimensions as set out in the standard. From [8]
2.6.1.2 Cracking
Deviation of the crack from the intended fracture plane can result from one or more of the
following:
(a) Inexact centering of the chevron slots (the intended crack plane) in the specimen,
(b) Strong residual stresses in the test specimen,
(c) Strong anisotropy in toughness, in which the toughness in the intended crack plane
is substantially larger than the toughness in another crack orientation, or
(d) Coarse grained or heterogeneous material.](https://image.slidesharecdn.com/01687e7e-04d6-47cb-9214-a3a531e83da3-160224002608/85/11411368_Victory_Killian-34-320.jpg)
![24 | P a g e
Experimental Method & Design Chapter 3
3.1 Subject Understanding
Firstly, I had to obtain a significant understanding of the subject matter. I achieved this by
studying two comprehensive standards on the matter of plane strain fracture toughness;
Metallic Materials – Determination of Plane-Strain Fracture Toughness (ISO 12737:2010)
[33]
, and the Standard Test Method for Plane-Strain (Chevron-Notch) Fracture Toughness of
Metallic Materials, E 1304 -97. [8]
I was able to read a number of papers on the subject matter
including Kevin Roche’s Biomimetic Nanostructures in Dental Cements [6]
. Richard Van
Noort’s Introduction to Dental Materials [10]
was also used to achieve a greater understanding
of glass-ionomer cements. I proceeded to ascertain information about the required dimensions
of the samples, and the required testing processes from the latter sample; ASTM E-1304 [8]
.
3.2 Dimensions and Materials
The dimensions of the samples, following the specifics from figure 2.9, have been laid out as
follows:
Rod diameter (B) 4 mm
Rod length (W) 6 mm
Grip groove width (T) 1.4 mm
Grip groove depth (S) 0.6 mm
Distance to load line (x) 0.4 mm
Chevron Notch Thickness (t) 0.12 mm
Distance to chevron tip (a0) 1.925 mm
Angle of chevron tip (θ) 52.8°
Table 3.1: Dimensions of Chevron Notch Sample](https://image.slidesharecdn.com/01687e7e-04d6-47cb-9214-a3a531e83da3-160224002608/85/11411368_Victory_Killian-35-320.jpg)
![25 | P a g e
Figure 3.1 (a) & 3.1 (b): Chevron notched specimens.
Certain materials were sourced for the initial testing: Persex, bone cement, and glass-ionomer
cement. A small Perspex rod of a 4 mm diameter was purchased online. The glass-ionomer
cement was received from Kevin Roche [6]
. There were a number of samples available, such
as radiopaque posterior Fuji IX (initially received from Dr Christina Mitchell [31]
), and AHfil
(initially received from Advanced Healthcare Ltd. In Kent, UK), and the Stryker Simplex P
bone cement was received from Dr Kenneth Stanton of UCD, Ireland.
3.3 Cutting
There was a simple cylindrical mold (made from polytetrafluoroethylene) of height 6 mm,
and diameter 4 mm available. Therefore, a suitable method of shaping the samples to the
desired specifications (according to ASTM E-1304 [8]
) was required. A few different methods
of cutting the sample were considered; circular saw cutting, CNC cutting, and laser cutting.
Electrode sparking was also considered as an option. Ultimately circular saw cutting was
opted for out of ease of use. Regardless of approach, the samples must be kept wet, and at
37°C throughout molding, cutting, storing, and testing. This is an attempt to control the
working properties of the GIC, in order to minimize the difficulties encountered.
After molding, three separate cuts must be made to the sample in order to form the chevron
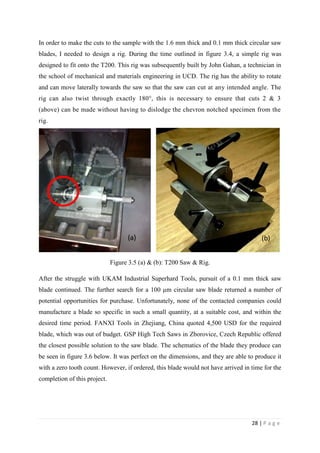
notched specimen. The first cut (the grip groove cut) is to be made by a blade of 1.6 mm in
thickness, and the second and third cuts (the diagonal chevron notch cuts) are to be made by a
blade of 100 μm in thickness. See figure 3.2 for the area of cutting. A T200 circular saw
cutter located in UCD’s school of mechanical and materials engineering was to be used for
the cuts.
(a) (b)](https://image.slidesharecdn.com/01687e7e-04d6-47cb-9214-a3a531e83da3-160224002608/85/11411368_Victory_Killian-36-320.jpg)
![29 | P a g e
Figure 3.6: Schematic of saw blade on offer from GSP High Tech Saws in Zborovice, Czech
Republic.
3.4 Molding
After failing to secure the required saw blade, it was decided to re-evaluate the method of
cutting the specimen. CNC cutting, laser cutting, and electrode sparking were all considered
too expensive. Therefore, it was left to consider making the sample with the grooves molded
into it. This would be beneficial as it would eradicate the need for cutting, and cutting can
contribute to failure in samples with poor working conditions, i.e. the FHA GIC’s tested by
Kevin Roche [6]
. The issue with this method was how to get the cement sample out of the
mold without damaging a mold or breaking the specimen. This is particularly difficult with
the chevron groove down the middle of the specimen being 100 μm thick. It was
hypothesised to mold the 100 μm cut into the specimen with paper, and burn it out after
setting. This was ruled out however, due to the fact that the cement must be kept at 37 °C and
in a 100 % humid environment during the molding and testing. It was further hypothesised to](https://image.slidesharecdn.com/01687e7e-04d6-47cb-9214-a3a531e83da3-160224002608/85/11411368_Victory_Killian-40-320.jpg)
![35 | P a g e
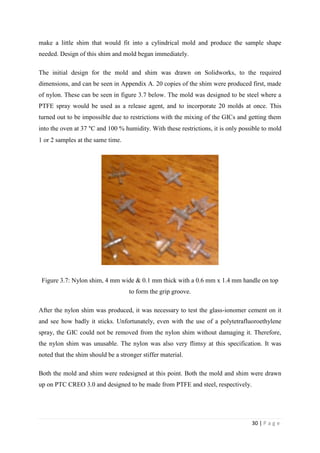
Figure 3.15: Molded sample of Fuji IX dental cement.
3.6 Hounsfield Rigs
In order to correctly test these samples, I was required to design a rig that would fit onto the
Tinius Olsen Hounsfield H50KS screw drive materials testing machine and hook into the grip
groove that had been molded into the samples. The Tinius Olsen Hounsfield H50KS screw
drive materials testing machine will then pull the specimen apart.
Figure 3.15: Schematic of a sample attached to the Tinius Olsen Hounsfield H50KS screw
drive materials testing machine with rigs as outlined in the chevron notch fracture toughness
testing standard [8]
.](https://image.slidesharecdn.com/01687e7e-04d6-47cb-9214-a3a531e83da3-160224002608/85/11411368_Victory_Killian-46-320.jpg)
![39 | P a g e
3.7 Testing
One spoon of alumina-silicate glass powder is mixed with one drop of the polyacrylic acid, in
the ratio of 15:8. The mixing phase of GICs should ideally be completed in 45 seconds [28]
.
The sample cement is immediately put into the mold, and then the shim, which is covered in
a release agent5
, is pushed into the cement mixture, taking its place in the mold. The mold is
clamped, and immediately put into an oven (figure 3.19) at 37 °C and 100 % humidity.
Figure 3.19: Gallenkamp vacuum oven.
Through the experimental testing, it was realised that the best possible time to remove the
sample from the mold is right at the end of the samples setting time (7-10 minutes). The
further the sample is into its hardening phase, i.e. the longer the sample is left in the mold, the
harder it is to remove from the mold without cracking. It was also found that removing the
specimen from the mold after 7-10 minutes as opposed to one hour was more beneficial in the
effort to ensure the sample was safely removed from the mold than including extra amounts
of either a PTFE or silicone release agent. After the 7-10 minutes in the mold, the sample is
removed from the mold and immediately put back into the oven at 37 °C and 100 % humidity
on a wet towel. The sample is then left in the oven for roughly another 23 hours and 50
minutes. Using this method, it is possible to make two samples every 15-20 minutes,
including time for cleaning the mixing equipment.
5
Initially a PTFE spray was used as the release agent. However, after 23 samples had been tested, a switch was
made to a silicone spray. This silicone spray worked better than the original PTFE spray.](https://image.slidesharecdn.com/01687e7e-04d6-47cb-9214-a3a531e83da3-160224002608/85/11411368_Victory_Killian-50-320.jpg)
![41 | P a g e
All of the tests for the Fuji IX and the AHL GIC are carried out at a speed of 1 mm/min. The
tests on the Stryker Simplex P are carried out at 5 mm/min. This is to ensure that cracking
occurs between 15 seconds and 60 seconds into the test time. The environment for testing is
in air at atmospheric pressure, and room temperature (≈ 25 ° C).
Figures 3.22: Tinius Olsen Hounsfield H50KS screw drive materials testing machine with
rigs in place.
The specimens are inspected by hand after testing to ensure that all validity tests have been
passed. It is very important to check that the chevron notch was positioned correctly and that
the crack propagated along the chevron notch.
KIVM (plane-strain chevron notch fracture toughness relating to extension resistance with
respect to a slowly advancing steady-state crack based on the maximum force observed
before cracking) can then be calculated for the material by using eq. 1.
𝐾𝐼𝑣𝑀 =
(𝐹 𝑚𝑎𝑥)(𝑌∗𝑚)
(𝐵)(√ 𝑊)
(eq. 1)
This method allows the fracture toughness of a brittle material to be measured with a very
small amount of material and without the need for a pre-crack. [34]
Therefore it is well suited
to the testing of GICs. If the crack is not a slowly advancing steady state crack initiated at the](https://image.slidesharecdn.com/01687e7e-04d6-47cb-9214-a3a531e83da3-160224002608/85/11411368_Victory_Killian-52-320.jpg)
![42 | P a g e
chevron notch, then an unloading/reloading cycle would be necessary to accurately determine
the fracture toughness.
3.7.2 Bone Cement
There is no difference in testing bone cement on the Tinius Olsen Hounsfield H50KS screw
drive materials testing machine. There is however, a difference in the way the cement is
mixed. The bone cement tested for this project is Simplex P from Stryker in Limerick,
Ireland. It is made up of the following, in the form of a polymer (powder) and a monomer
(liquid), as seen in figure 3.23:
• 75% Methyl Methacrylate Styrene Copolymer
• 15% Polymethylmethacrylate
• 10% Barium Sulfate
The monomer is toxic until it is mixed into the polymer, therefore, mixing must be done in a
vacuum fume hut (figure 3.24) under great care6
. After the mixture has reached its doughing
phase (figure 3.25), it is no longer toxic. For each ml of the monomer, you must add 2 grams
of the polymer. Once the mixture is doughy (after about a minute), it should be taken out and
placed into the mold. After this step, the method is similar to the dental cement. However, the
bone cements setting time is longer than the dental cements. It needs to be left in the mold for
greater than 20 minutes so that it can be removed with deformation. Also the bone cement is
left to set at ambient temperature, it does not go in the oven.
6
Ayatollahi, and Karimzadeh [46]
found that their fracture toughness results indicated that the
vacuum-mixed cement has significantly higher fracture toughness compared with the hand-
mixed ones.](https://image.slidesharecdn.com/01687e7e-04d6-47cb-9214-a3a531e83da3-160224002608/85/11411368_Victory_Killian-53-320.jpg)
![44 | P a g e
Figure 3.25: Stryker Simplex P during mixing, known as the doughing phase.
3.8 Scanning Electron Microscopy
A scanning electron microscope (SEM) scans a focused electron beam over a surface to
create an image. The electrons in the beam interact with the sample, producing various
signals that can be used to obtain information about the surface topography and composition.
[36]](https://image.slidesharecdn.com/01687e7e-04d6-47cb-9214-a3a531e83da3-160224002608/85/11411368_Victory_Killian-55-320.jpg)
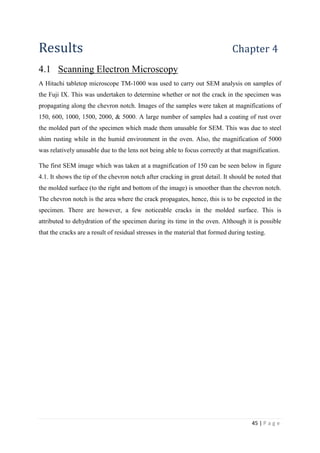
![46 | P a g e
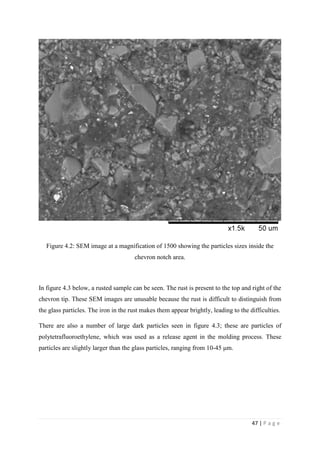
Figure 4.1: SEM image at a magnification of 150 showing the tip of the chevron notch.
The magnification of 1500 shows the particle sizes within the sample in great detail.
Backscattered electrons are sensitive to the atomic mass of the nuclei they scatter
from.[37]
As a result, elements with a heavier atomic mass, which backscatter more
efficiently, appear brighter than lighter elements in a backscattered electron image. The glass
particles contain Calcium which has an atomic mass of 40.078 atomic mass units, hence, the
glass particles appear bright in SEM. Due to this and to the fact that the lighter shaped
particles are sharp edged, it is concluded that the lighter particles are the alumina-silicate
glass particles inside the Fuji IX. These glass particles are seen to range from 10 μm up to 40
μm in diameter. This is just slightly smaller than the expected 15-50 μm diameters](https://image.slidesharecdn.com/01687e7e-04d6-47cb-9214-a3a531e83da3-160224002608/85/11411368_Victory_Killian-57-320.jpg)
![67 | P a g e
Discussions and Conclusions Chapter 5
5.1 Results
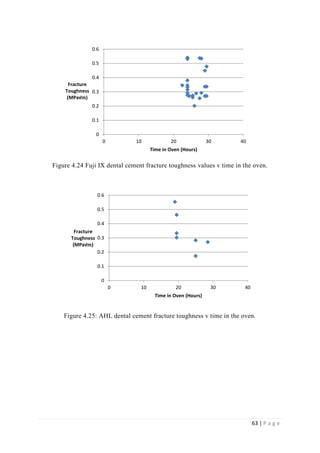
The average KIvM value recorded for Fuji IX GC was 0.35 ± 0.1 Mpa√ 𝒎. The average
KIvM value recorded for AHL GIC was 0.33 ± 0.11 Mpa√ 𝒎.
Ulrich Lochbauer [28]
found that the fracture toughness value for glass-ionomer cement
was between 0.1 and 0.6 MPa√ 𝑚.
Ilie et al. [51]
found KIc values for GICs to be on average 0.45 Mpa√ 𝑚.
Bagheri et al. [25]
found KIc values for Fuji IX to be 0.34 Mpa√ 𝑚 after 48 hours, and
values for KIc for Fuji IX GC to be 0.44 Mpa√ 𝑚 after 48 hours. As the results seen in this
project were slightly lower than this, but also tested after 24 hours, not 48, there is a
strong correlation between the industries standards results and the Fuji IX GC results.
Mitchell et al. [31]
found the value of fracture toughness for Fuji I to be 0.34 Mpa√ 𝑚 and
Fuji Cap I to be 0.37 Mpa√ 𝑚. These are very similar products to Fuji IX, again showing
that the obtained results are accurate.
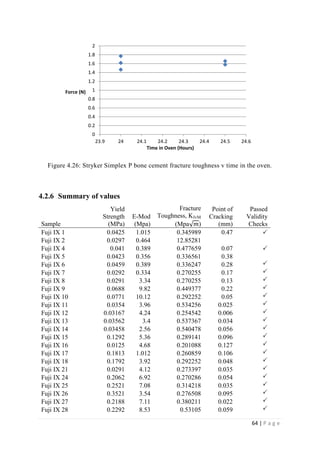
The average KIvM value recorded for Stryker Simplex P was 1.61 ± 0.1 Mpa√ 𝒎.
Ayatollahi and Karimzadeh [46]
found that the fracture toughness value for bone cement,
although by the nano-indentation test, to be between 2.1 and 2.9 MPa√ 𝑚.
Lewis et al. [48]
found that the respective values for the fracture toughness of three
different groups; 4-N,N dimethyl p-toluidine, 4-N,N dimethylaminobenzyl oleate, 4-N,N
dimethylaminobenzyl laurate, were 1.94 ± 0.05, 2.06 ± 0.09, and 2.00 ± 0.07 MPa√ 𝑚
respectively.
K. Brown [49]
wrote that the PMMA bone cement specimens he tested were all between
1.25 – 1.38 MPa√ 𝑚.
Most notably, Webb and Spencer [50]
measured the mean fracture toughness (KIc) of
Stryker Simplex P to be 1.52 – 2.02 MPa√ 𝑚.
This indicates that obtaining an average fracture toughness value for Stryker Simplex P
of 1.61 ± 0.1 MPa√ 𝑚 is well within the industry standard range of values.](https://image.slidesharecdn.com/01687e7e-04d6-47cb-9214-a3a531e83da3-160224002608/85/11411368_Victory_Killian-78-320.jpg)
![68 | P a g e
Overall, the accuracy of the plain strain short rod chevron notch fracture toughness testing
method implemented throughout this project is apparent.
5.2 Sources of error in testing
There are certain errors caused in the testing of the samples and the recording of the results in
this project.
KIvM lacks a validity check for excess plasticity or residual stresses that would invalidate
the use of the underlying elastic crack stress analysis.
Dehydration of the sample may have occurred in the Gallenkamp vacuum oven, as it is
an old model, it may fail to keep the correct heat and humidity. Dehydration may also
occur upon removal from the oven, if the specimen is left too long before testing.
There may be residual stresses experienced in the samples from their removal from the
molds. The fracture toughness results obtained by G. Lewis using the chevron notch short
rod specimens were, on average, 14 and 16% higher than those obtained using the single
edged notch three point and rectangular compact tension types, respectively. These
differences are accounted for in terms of differences in four aspects of the specimen
configuration namely, residual stress effects, loading rate, material inhomogeneity, and the
nature of the test [45]
.
The moulding is a very manual process, and issues can arise from no parallax, or slips.
The test results may be skewed by the samples not fitting perfectly onto the Hounsfield
machine rigs.
5.3 Future Work
There is a lot of potential in developing new modified materials for use in the dental or
medical industries. For this reason, it is important to continue developing the testing methods
for these materials, especially fracture toughness testing. Fracture toughness is a property
which describes the ability of a material containing a crack to resist fracture. This is very](https://image.slidesharecdn.com/01687e7e-04d6-47cb-9214-a3a531e83da3-160224002608/85/11411368_Victory_Killian-79-320.jpg)
![70 | P a g e
References
[1] U.S. Department of Health and Human Services (2000) ‘Oral Health in America: A
Report of the Surgeon General’. Rockville, Maryland: National Institute of Dental and
Craniofacial Research, National Institutes for Health. Available at:
http://www.nidcr.nih.gov/DataStatistics/SurgeonGeneral/Report/ExecutiveSummary.htm
[Accessed 28 October 2014]
[2] Frencken, J., Pilot, T., Van Amerongen, E., Phantumvanit, P., Songpaisan, Y. (1997)
Manual for the Atraumatic Restorative Treatment Approach to Control Dental Caries, 3rd
Edition. Groningen, Netherlands: WHO Collaborating Centre for Oral Health Services
Research.
[3] Smales, R.J., Yip, H.K. (2000) ‘The atraumatic restorative treatment (ART) approach for
primary teeth: review of literature’, Journal of Pediatric Dentistry, Volume 22, Issue 4, pp.
294-298.
[4] Smales, R.J., Yip, H.K. (2002) ‘Glass ionomer cements used as fissure sealants with the
atraumatic restorative treatment (ART) approach: review of literature’, International Dental
Journal, Volume 53, Issue 2, pp. 67-70.
[5] Naasan, M.A., Watson, T.F. (1998) ‘Conventional glass ionomers as posterior
restorations’, American Journal of Dentistry, Volume 11, Issue 1, pp. 36-45.
[6] Roche, K. (2014) Biomimetic nanostructures in dental cements. Published PHD Thesis.
School of Mechanical and Materials Engineering, University College Dublin.
[7] Berger, M. (2007) Nano Hydroxyapatite. Available at: http://what-is-
nanotechnology.com/11Nano-Hydroxyapatite-Ca10(PO4)6(OH)2.htm [Accessed on March
10 2015]
[8] ASTM International (2002) E 1304-97. ‘Standard Test Method for Plane-Strain
(Chevron-Notch) Fracture Toughness of Metallic Materials’. 100 Barr Harbor Drive, PO Box
C700, West Conshohocken, PA 19428-2959, United States.](https://image.slidesharecdn.com/01687e7e-04d6-47cb-9214-a3a531e83da3-160224002608/85/11411368_Victory_Killian-81-320.jpg)
![71 | P a g e
[9] Cotter, E. (2014) Effect of sugary foods on tooth decay [Personal lecture] Clyde Court
Dental Facility. 19 September.
[10] Van Noort, R., (2007) Introduction to Dental Materials. Third Edition. Department of
Restorative Dentistry, University of Sheffield, Sheffield, UK. Mosby: Elsevier.
[11] Griffin, S. G., Hill, R. G. (1999) ‘Influence of glass composition on the properties of
glass polyalkenoate cements. Part I: Influence of aluminium to silicon ratio’, Biomaterials,
Volume 20, Issue 17, pp. 1579-1586.
[12] DeCarlo, K., Lam, T., Carty, W. (2009) ‘Dissolution of Alumina in Silicate Glasses and
the Glass Formation Boundary’. In: Bordia, R.K., Olevsky, E.A. eds. Advances in Sintering
Science and Technology: Ceramic Transactions. Hoboken, NJ, USA. John Wiley & Sons.
[13] Pitts, N. B., Stamm, J.W. (2004) ‘International Consensus Workshop on Caries Clinical
Trials (ICW-CCT) - Final Consensus Statements: Agreeing Where the Evidence Leads’,
Journal of Dental Research, Volume 83, pp. 125-128.
[14] Bertassoni, L.E., Habelitz, S., Kinney J. H., and Marshall S.J. (2009) ‘Biomechanical
perspective on the remineralization of dentin’, Caries Research, Volume 43, Issue 1, pp. 70-
77.
[15] Amazon Technologies (2013) Polyelectrolyte Available at:
http://www.snipview.com/q/Polyelectrolyte [Accessed 15 November 2014]
[16] Anstice, H.M., and Nicholson, J.W. (1992) ‘Studies on the structure of light cured glass-
ionomer cements’, Journal of Materials Science, Volume 3, Issue 6, pp. 447-451.
[17] Fennel, B., Hill, R.G. (2001) ‘The influence of poly(acrylic acid) molar mass and
concentration on the properties of polyalkenoate cements Part III Fracture toughness and
toughness’, Journal of Materials Science, Volume 36, Issue 21, pp. 5185-5192.
[18] Mickenautsch, S., Mount, G., Yengopal, V. (2011) ‘Therapeutic effect of glass-
ionomers: an overview of evidence’, Australian Dental Journal, Volume 56, Issue 1, pp. 10-
15.](https://image.slidesharecdn.com/01687e7e-04d6-47cb-9214-a3a531e83da3-160224002608/85/11411368_Victory_Killian-82-320.jpg)
![72 | P a g e
[19] Cho, S.Y., Cheng, A.C. (1999) ‘A Review of Glass Ionomer Restorations in the Primary
Dentition’, Journal of the Canadian Dental Association, Volume 65, Issue 9, pp. 491-495.
[20] Mount, G.J. (1999) ‘Glass ionomers: a review of their current status’, Operative
Dentistry, Volume 24, Issue 2, pp. 115-124.
[21] Mitra, S.B. (1991) ‘Adhesion to dentin and physical properties of light cured glass-
ionomer liner/base’, Journal of Dental Research, Volume 70, Issue 1, pp. 72-44.
[22] Geurtsen, W., Spahl, W., Leyhausen, G. (1998) ‘Residual monomer/additive release and
variability in cytotoxicity of light-curing glass ionomer cements and compomers’, Journal of
Dental Research; Volume 77 Issue 12, pp. 2012–2019.
[23] Stanislawski, L., Daniau, X., Lautie, A., Goldberg, M. (1999) ‘Factors responsible for
pulp cell toxicity induced by resin-modified glass ionomer cements’, Journal of Biomedical
Materials Research Part A, Volume 48, pp. 277–288.
[24] Chen, Y., Miao, X. (2005) ‘Thermal and chemical stability of fluorhydroxyapatite
ceramics with different fluorine contents’, Biomaterials, Volume 26, pp. 1205-1210.
[25] Behroozibakhsh, M.,Shafiei, F., Hooshmand, T.,Moztarzadeh, F.,Tahriri, M., Bagheri
Gorgani, H. (2014) ‘Effect of a synthetic nanocrystalline-fluorohydroxyapatite on the eroded
enamel lesions’, Dental Materials, Volume 30, pp. 117-118.
[26] Smallman, R.E., and Ngan, A.H.W. (2007) Physical Metallurgy and Advanced
Materials. Seventh Edition. London, Elsevier – Butterworth-Heinemann.
[27] Miyazaki, M., Moore, B.K., Onose, H. (1996) ‘Effect of surface coatings on flexural
properties of glass ionomers’, European Journal of Oral Sciences, Volume 104, Issue 5-6,
pp. 600-604.
[28] Lochbauer, U. (2010) ‘Dental Glass Ionomer Cements as Permanent Filling Materials? -
Properties, Limitations and Future Trends’, Materials, Volume 3, Issue 1, pp. 76-96.
[29] Kobayashi, M., Kon, M., Miyai, K., Asaoka, K. (2000) ‘Strengthening of glass-ionomer
cement by compounding short fibres with CaO-P2O5-SiO2-Al2O3 glass’, Biomaterials,
Volume 21, Issue 20, pp. 2051–2058.](https://image.slidesharecdn.com/01687e7e-04d6-47cb-9214-a3a531e83da3-160224002608/85/11411368_Victory_Killian-83-320.jpg)
![73 | P a g e
[30] Yap, A.U., Pek, Y.S., Kumar, R.A., Cheang, P., Khor, K.A. (2002) ‘Experimental
studies on a new bioactive material: HA Ionomer cements’, Biomaterials, Volume 23, Issue
3, pp. 955-962.
[31] Mitchell, C.A., Douglas, W.H., Cheng, W.S. (1999) ‘Fracture toughness of
conventional, resin-modified glass-ionomer and composite luting cements’, Dental Materials,
Volume 15, Issue 1, pp. 7-13.
[32] Milanita, E. L., Kenji, A., Mizuho, N. (2003) ‘Toughness, bonding and fluoride-release
properties of hydroxyapatite-added glass ionomer cement’, Biomaterials, Volume 24, Issue
21, pp. 3787-3794.
[33] Standards Policy and Strategy Committee (2011) BS EN ISO 12737:2010. BSI Standards
Publication. Metallic Materials – Determination of Plane-Strain Fracture Toughness.
Avenue Marnix 17, B-1000 Brussels.
[34] Anderson, T. L. (2005) Fracture Mechanics: Fundamentals and Applications. Third
Edition. Florida, United States: Taylor & Francis Group.
[35] Dorozhkin, S. V. (2007) ‘Calcium orthophosphates’, Journal of Materials Science, 42,
pp. 1061-1095.
[36] NanoScience Instruments, Inc. (2015) Products | Scanning Electron Microscopy -
Technology Overview. Available at:
http://www.nanoscience.com/products/sem/technology-overview/ [Accessed 19 January
2015]
[37] Anderson Materials Evaluation, Inc. (2007) SEM Illustrative Example: Secondary
Electron and Backscatter Electron Images. Available at:
http://www.andersonmaterials.com/sem/sem-secondary-backscatter-images.html [Accessed
21 January 2015]
[38] Contreras, X., Tayag, E., Finn, M. (2014) ‘How to Treat a Broken Tooth’, Medics Index,
15 September 2013. Available at: http://medicsindex.ning.com/profiles/blogs/how-to-treat-a-
broken-tooth-edited-by-whoze-ximena-contreras-edit [Accessed February 28 2015]](https://image.slidesharecdn.com/01687e7e-04d6-47cb-9214-a3a531e83da3-160224002608/85/11411368_Victory_Killian-84-320.jpg)
![74 | P a g e
[39] Vanderlely, R. (2014) Fluorine Facts: The Element. Available at: http://www.green-
planet-solar-energy.com/fluorine-facts.html [Accessed March 5 2015]
[40] Gedela, S. (2015) SEM image of an enamel surface etched for 15 s with 37% H3PO4.
Available at: http://omicsonline.org/Dentistryimages/2161-1122-1-104-g002.html [Accessed
March 10 2015]
[41] Wikipedia (2009) Chemical structure for polyacrylic acid. Available at:
http://en.wikipedia.org/wiki/File:Polyacrylic_acid.png#filehistory [Accessed March 10 2015]
[42] Shannon, J. L., Jr., Bubsey, R. T., Pierce, W. S. (1986) ‘Closed-Form Expressions for
Crack Mouth Displacements and Stress-Intensity Factors for Chevron-Notched Short Bar
and Short Rod Specimens Based on Experimental Compliance Measurements’, NASA Lewis
Research Center, NASA TM 83796.
[43] Lewis, G., Xu, J., Dunne, N., Daly, C., Orr, J. (2007) ‘Evaluation of an accelerated aging
medium for acrylic bone cement based on analysis of nanoindentation measurements on
laboratory-prepared and retrieved specimens’, Journal of Biomedical Materials Research
Part B: Applied Biomaterials, Volume 81B, Issue 2, pp. 544-550.
[44] Vaishya, R., Chauhan, M., Vaish, A. (2013) ‘Bone cement’ Journal of Clinical
Orthopaedics and Trauma, Volume 4, Issue 4, pp. 157-163.
[45] Lewis, G. (1999) ‘Apparent fracture toughness of acrylic bone cement: effect of test
specimen configuration and sterilization method’, Biomaterials, Volume 20, Issue 1, pp. 69-
78.
[46] Ayatollahi, M., Karimzadeh, A. (2012) ‘Determination of fracture toughness of bone
cement by nano-indentation test’, International Journal of Fracture, Volume 175, pp. 193-
198.
[47] Topoleski, L., Ducheyne, P. (1992) ‘The fracture toughness of titanium-fiber-reinforced
bone cement’, Journal of Biomedical Materials Research, Volume 26, Issue 12, pp. 1599-
1617.](https://image.slidesharecdn.com/01687e7e-04d6-47cb-9214-a3a531e83da3-160224002608/85/11411368_Victory_Killian-85-320.jpg)
![75 | P a g e
[48] Deb, S., Lewis, G., Janna, S., Vazquez, B.,San Roman, J. (2003) ‘Fatigue and fracture
toughness of acrylic bone cements modified with long-chain amine activators’, Journal of
Biomedical Materials Research Part A, Volume 67A, Issue 2, pp. 571–577.
[49] Brown, K. (1992) Chevron-notch Fracture Test Experience: Metals and Non-metals.
100 Barr Harbor Drive, PO Box C700, West Conshohocken, PA 19428-2959, United States:
ASTM.
[50] Webb, J., Spencer, R. (2007) ‘The role of polymethylmethacrylate bone cement in
modern orthopaedic surgery’, The Journal of Bone & Joint Surgery, Volume 89B, Issue 7,
pp. 851-857.
[51] Ilie, N., Valceanu, A., Hickel, R. (2012) ‘Fracture toughness of dental restorative
materials’, Clinical Oral Investigations, Volume 16, Issue 2, pp. 489-498.](https://image.slidesharecdn.com/01687e7e-04d6-47cb-9214-a3a531e83da3-160224002608/85/11411368_Victory_Killian-86-320.jpg)
![81 | P a g e
Appendix B
CleanUp.m
function [Data]=CleanUp(Data)
for count=2:length(Data)
if abs(Data(count,2)-Data(count-1,2)) > max(Data(:,2))*0.1
Data(count+1:length(Data),:)=[];
break
end
end
DataAnalysis.m
function [Data, AvgSlope, AvgIntercept]=DataAnalysis(string)
Limits=[300 400];
Data=csvread(string,2,1);
Slopes=zeros(Limits(2)-Limits(1), 1);
Intercept=zeros(Limits(2)-Limits(1), 1);
BondLength=0.13;
Data(:,1)=Data(:,1)-Data(1,1);
for count=Limits(1):Limits(2)-1
Slopes(count+1-Limits(1))=(Data(count+1,2)-
Data(Limits(1),2))/(Data(count+1,1)-Data(Limits(1),1));
Intercept(count+1-Limits(1))=Data(count+1,2)-Slopes(count+1-
Limits(1))*Data(count+1,1);](https://image.slidesharecdn.com/01687e7e-04d6-47cb-9214-a3a531e83da3-160224002608/85/11411368_Victory_Killian-92-320.jpg)
![82 | P a g e
end
AvgSlope=sum(Slopes)/length(Slopes);
AvgIntercept=Data(Limits(1), 2)-Data(Limits(1), 1)*AvgSlope;
Data(:,2)=Data(:,2)-AvgIntercept;
DataCombine.m
function [DataAll] = DataCombine(Data1, Data2,Data3,Data4,Data5)
DataAll = [Data1;Data2;Data3;Data4;Data5];
DataAll = sortrows(DataAll,1);
end
DataLinear.m
function [YP]=DataLinear(Data, Slope, Start)
numcon=0; CR=100;
for count=Start:length(Data)
slopeCompliance = (Data(count,1))*(Slope);
nonLin = Data(count,2) - slopeCompliance;
err=Data(count,2).*0.05;](https://image.slidesharecdn.com/01687e7e-04d6-47cb-9214-a3a531e83da3-160224002608/85/11411368_Victory_Killian-93-320.jpg)
![83 | P a g e
if abs(nonLin) > err
numcon=numcon+1;
if numcon == CR
hold on
plot(Data(count-CR,1), Data(count-CR,2),'go', 'MarkerSize',
10,'LineWidth',3 )
YP=[Data(count-CR,1) Data(count-CR,2)];
hold off
break
end
else
numcon=0;
end
end
DataLinear2.m
function [YP]=DataLinear2(Data, Slope, Start, Intercept)
numcon=0; CR=100;
for count=Start:length(Data)
slopeCompliance = (Data(count,1))*(Slope);
nonLin = Data(count,2) - slopeCompliance + Intercept;
err=Data(count,2).*0.05;
if abs(nonLin) > err](https://image.slidesharecdn.com/01687e7e-04d6-47cb-9214-a3a531e83da3-160224002608/85/11411368_Victory_Killian-94-320.jpg)
![84 | P a g e
numcon=numcon+1;
if numcon == CR
hold on
plot(Data(count-CR,1), Data(count-CR,2),'bo', 'MarkerSize',
10,'LineWidth',3 )
YP=[Data(count-CR,1) Data(count-CR,2)];
hold off
break
end
else
numcon=0;
end
end
DataPeaks.m
function [UTS]=DataPeaks(Data)
[pks,locs]=findpeaks(Data(:,2), 'SORTSTR', 'descend', 'NPEAKS', 1);
hold on, plot(Data(locs,1), pks, 'rs','MarkerSize', 10, 'LineWidth', 3),
hold off
UTS=[Data(locs,1) pks];
DataPeaks2.m
function [UTS]=DataPeaks2(Data)](https://image.slidesharecdn.com/01687e7e-04d6-47cb-9214-a3a531e83da3-160224002608/85/11411368_Victory_Killian-95-320.jpg)
![85 | P a g e
[pks,locs]=findpeaks(Data(:,2), 'SORTSTR', 'descend', 'NPEAKS', 1);
hold on, plot(Data(locs,1), pks, 'bs','MarkerSize', 10, 'LineWidth', 3),
hold off
UTS=[Data(locs,1) pks];
DataPlotting.m
function []=DataPlotting (lim1,lim2,knlim)
clc
close all
%%Input lines for the .csv files where the raw data is located,
%%DataAnalysis outputs the slope, intercept and the raw data of the force
%%vs extension part of the .csv. It also moves the data so that the
%%intercept of the linear region is at 0.
[Data1, Slope1, Intercept1]=DataAnalysis('Results/BC1.csv');
[Data2, Slope2, Intercept2]=DataAnalysis('Results/BC2.csv');
[Data3, Slope3, Intercept3]=DataAnalysis('Results/BC3.csv');
[Data4, Slope4, Intercept4]=DataAnalysis('Results/BC4.csv');
[Data5, Slope5, Intercept5]=DataAnalysis('Results/BC5.csv');
%%Filtering the data to the appropriate dimensions, removes the messy
%%region at the end of the data
Data1=CleanUp(Data1);
Data2=CleanUp(Data2);
Data3=CleanUp(Data3);
Data4=CleanUp(Data4);
Data5=CleanUp(Data5);
%%Ranges for the data averages
range1 = 0:0.04:lim1;](https://image.slidesharecdn.com/01687e7e-04d6-47cb-9214-a3a531e83da3-160224002608/85/11411368_Victory_Killian-96-320.jpg)
![86 | P a g e
range2 = 0:0.04:lim2;
%%Concatenating the data for similar failure modes (brittle or plastic-
like)
DataAll1 = [Data2;Data4;Data5];
DataAll1 = sortrows(DataAll1,1);
DataAll2 = [Data1;Data2];
DataAll2 = sortrows(DataAll2,1);
%%Fitting a line to the concatenated data for comparison to other batches
(reference only!)
[linefit1,errors1] = polyfit(DataAll1(:,1),DataAll1(:,2),10);
[linefit2,errors2] = polyfit(DataAll2(:,1),DataAll2(:,2),10);
%%Plots the average for each failure mode, along with the error lines
[linefit1,Delta1] = polyval(linefit1,range1,errors1);
figure(8), plot(range1,linefit1,'k')
hold on
figure(8), plot(range1,linefit1+(1.5*Delta1),'r')
figure(8), plot(range1,linefit1-(1.5*Delta1),'r')
[linefit2,Delta2] = polyval(linefit2,range2,errors2);
figure(7), plot(range2,linefit2,'k')
hold on
figure(7), plot(range2,linefit2+(1.5*Delta2),'r')
figure(7), plot(range2,linefit2-(1.5*Delta2),'r')
lineData1 = [range1; linefit1]';
lineData2 = [range2; linefit2]';
%%Plotting all of the batch on separate graphs for individual analysis, not
%%needed in main analysis
figure(1), plot(Data1(:,1), Data1(:,2))
figure(2), plot(Data2(:,1), Data2(:,2), 'r')
figure(3), plot(Data3(:,1), Data3(:,2), 'g')
figure(4), plot(Data4(:,1), Data4(:,2), 'm')
figure(5), plot(Data5(:,1), Data5(:,2), 'k')](https://image.slidesharecdn.com/01687e7e-04d6-47cb-9214-a3a531e83da3-160224002608/85/11411368_Victory_Killian-97-320.jpg)
![87 | P a g e
%%Plotting the data on a single graph, for comparison between samples in
%%the batch
figure(6), plot(Data1(:,1), Data1(:,2)),
hold on
plot(Data2(:,1), Data2(:,2), 'r')
plot(Data3(:,1), Data3(:,2), 'g')
plot(Data4(:,1), Data4(:,2), 'm')
plot(Data5(:,1), Data5(:,2), 'k')
% DataLinear(Data1, Slope1, 300);
DataPeaks2(Data1);
% DataLinear(Data2, Slope2, 300);
DataPeaks2(Data2);
% DataLinear(Data3, Slope3, 300);
DataPeaks2(Data3);
% DataLinear(Data4, Slope4, 300);
DataPeaks2(Data4);
% DataLinear(Data5, Slope5, 300);
DataPeaks2(Data5);
xlabel('Extension(mm)');
ylabel('Force(Newtons)');
title('Graph of Force vs Extension, Ref Samples');
axis ([-inf, lim2, 0, knlim])
export_fig 1.All_Ref_Samples_ref.png -m2 -q100
hold off
%%Plotting the first and second failure points of the samples on each
individual graph, not needed in main analysis
%
figure(2), [~,lineSlope1,linercept1] = DataRef(lineData1);
DataLinear2(lineData1,lineSlope1,400,linercept1);
DataPeaks2(lineData1);](https://image.slidesharecdn.com/01687e7e-04d6-47cb-9214-a3a531e83da3-160224002608/85/11411368_Victory_Killian-98-320.jpg)
![88 | P a g e
xlabel('Extension(mm)');
ylabel('Force(Newtons)');
title('Force vs Extension, Failure Mode 1');
axis ([-inf, lim1, 0, knlim])
export_fig 1.Fail_Mode_2_ref.png -m3 -q100
hold on
% print('Fail_Mode_2, Reference Batch','-dpng','-r0')
figure(1), [~,lineSlope2,linercept2] = DataRef(lineData2);
DataLinear2(lineData2,lineSlope2,400,linercept2);
DataPeaks2(lineData2);
xlabel('Extension(mm)');
ylabel('Force(Newtons)');
title('Force vs Extension, Failure Mode 2');
axis ([-inf, lim2, 0, knlim])
export_fig 1.Fail_Mode_1_ref.png -m3 -q100
% print('Fail_Mode_1, Reference Batch','-dpng','-r0')
hold on
hold on
DataPlottingNonRef.m
function []=DataPlottingNonRef (lim1,lim2,knlim)
clc
% lim1=3;
% lim2=6;
DataPlotting(lim1,lim2,knlim);
%%Input lines for the .csv files where the raw data is located,
%%DataAnalysis outputs the slope, intercept and the raw data of the force
%%vs extension part of the .csv. It also moves the data so that the](https://image.slidesharecdn.com/01687e7e-04d6-47cb-9214-a3a531e83da3-160224002608/85/11411368_Victory_Killian-99-320.jpg)
![89 | P a g e
%%intercept of the linear region is at 0.
[Data1, Slope1, Intercept1]=DataAnalysis('Results/BC1.csv');
[Data2, Slope2, Intercept2]=DataAnalysis('Results/BC2.csv');
[Data3, Slope3, Intercept3]=DataAnalysis('Results/BC3.csv');
[Data4, Slope4, Intercept4]=DataAnalysis('Results/BC4.csv');
[Data5, Slope5, Intercept5]=DataAnalysis('Results/BC5.csv');
%%Filtering the data to the appropriate dimensions, removes the messy
%%region at the end of the data
Data1=CleanUp(Data1);
Data2=CleanUp(Data2);
Data3=CleanUp(Data3);
Data4=CleanUp(Data4);
Data5=CleanUp(Data5);
% %%Ranges for the data averages
% range1 = 0:0.004:3;
% range2 = 0:0.004:8;
% %%Concatenating the data for similar failure modes (brittle or plastic-
like)
% DataAll1 = [Data1;Data2;Data4];
% DataAll1 = sortrows(DataAll1,1);
%
% DataAll2 = [Data3;Data5];
% DataAll2 = sortrows(DataAll2,1);
% %%Fitting a line to the concatenated data for comparison to other batches
(reference only!)
% [linefit1,errors1] = polyfit(DataAll1(:,1),DataAll1(:,2),10);
% [linefit2,errors2] = polyfit(DataAll2(:,1),DataAll2(:,2),10);
% %%Plots the average for each failure mode, along with the error lines
% [linefit1,Delta1] = polyval(linefit1,range1,errors1);
% figure(7), plot(range1,linefit1,'k')
% hold on
% figure(7), plot(range1,linefit1+Delta1,'r','LineWidth',5)
% figure(7), plot(range1,linefit1-Delta1,'r','LineWidth',5)
%
% [linefit2,Delta2] = polyval(linefit2,range2,errors2);](https://image.slidesharecdn.com/01687e7e-04d6-47cb-9214-a3a531e83da3-160224002608/85/11411368_Victory_Killian-100-320.jpg)
![90 | P a g e
% figure(8), plot(range2,linefit2,'k')
% hold on
% figure(8), plot(range2,linefit2+Delta2,'r')
% figure(8), plot(range2,linefit2-Delta2,'r')
%
% lineData1 = [range1; linefit1]';
% lineData2 = [range2; linefit2]';
%%Plotting all of the batch on separate graphs for individual analysis, not
%%needed in main analysis
% figure(1), plot(Data1(:,1), Data1(:,2),'LineWidth',2)
% figure(2), plot(Data2(:,1), Data2(:,2), 'r','LineWidth',2)
% figure(3), plot(Data3(:,1), Data3(:,2), 'g','LineWidth',2)
% figure(4), plot(Data4(:,1), Data4(:,2), 'm','LineWidth',2)
% figure(5), plot(Data5(:,1), Data5(:,2), 'k','LineWidth',2)
%%Plotting the data on a single graph for each failure mode, for comparison
between samples in
%%the batch
hold on
figure(2), plot(Data1(:,1), Data1(:,2),'k', 'LineWidth',2)
hold on
plot(Data2(:,1), Data2(:,2), 'r','LineWidth',2)
% plot(Data3(:,1), Data3(:,2), 'g','LineWidth',2)
% plot(Data4(:,1), Data4(:,2), 'm','LineWidth',2)
% plot(Data5(:,1), Data5(:,2), 'k','LineWidth',2)
hold on
figure(1),
% plot(Data1(:,1), Data1(:,2), 'LineWidth',2)
hold on
% plot(Data2(:,1), Data2(:,2), 'r','LineWidth',2)
plot(Data3(:,1), Data3(:,2), 'g','LineWidth',2)
plot(Data4(:,1), Data4(:,2), 'm','LineWidth',2)](https://image.slidesharecdn.com/01687e7e-04d6-47cb-9214-a3a531e83da3-160224002608/85/11411368_Victory_Killian-101-320.jpg)
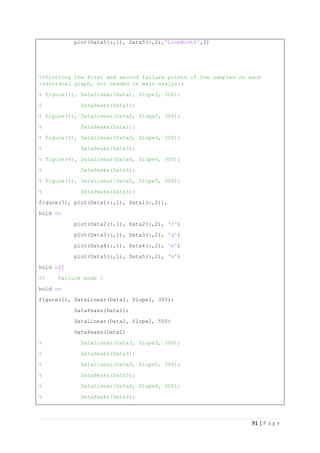
![92 | P a g e
% xlabel('Extension(mm)');
% ylabel('Force(Newtons)');
% title('Graph of Force vs Extension, Failure Mode 1');
% axis ([-inf, lim1, 0, 120000])
% set(gcf, 'color', 'none');
% set(gca, 'color', 'none');
legend('Reference Batch','Std Deviation','Location','southeast')
export_fig 2.Fail_Mode_1.png -m3 -q100
%% Failure mode 2
hold on
figure(1),
% DataLinear(Data1, Slope1, 200);
% DataPeaks(Data1);
% DataLinear(Data2, Slope2, 700);
% DataPeaks(Data2);
DataLinear(Data3, Slope3, 300);
DataPeaks(Data3);
DataLinear(Data5, Slope5, 300);
DataPeaks(Data5);
DataLinear(Data4, Slope4, 300);
DataPeaks(Data4);
% xlabel('Extension(mm)');
% ylabel('Force(Newtons)');
% title('Graph of Force vs Extension, Failure Mode 2');
% axis ([-inf, lim2, 0, 120000])
% set(gcf, 'color', 'none');
% set(gca, 'color', 'none');
legend('Reference Batch','Std Deviation','Location','southeast')
export_fig 2.Fail_Mode_2.png -m3 -q100
%%
% figure(7), [~,lineSlope1,linercept1] = DataRef(lineData1);](https://image.slidesharecdn.com/01687e7e-04d6-47cb-9214-a3a531e83da3-160224002608/85/11411368_Victory_Killian-103-320.jpg)
![93 | P a g e
% DataLinear2(lineData1,lineSlope1,400,linercept1);
% DataPeaks(lineData1);
% hold off
%
% figure(8), [~,lineSlope2,linercept2] = DataRef(lineData2);
% DataLinear2(lineData2,lineSlope2,400,linercept2);
% DataPeaks(lineData2);
% hold off
hold off
DataRef.m
function [Data, AvgSlope, AvgIntercept]=DataRef(Data)
Limits=[300 400];
Slopes=zeros(Limits(2)-Limits(1), 1);
Intercept=zeros(Limits(2)-Limits(1), 1);
BondLength=0.13;
Data(:,1)=Data(:,1)-Data(1,1);
for count=Limits(1):Limits(2)-1
Slopes(count+1-Limits(1))=(Data(count+1,2)-
Data(Limits(1),2))/(Data(count+1,1)-Data(Limits(1),1));
Intercept(count+1-Limits(1))=Data(count+1,2)-Slopes(count+1-
Limits(1))*Data(count+1,1);
end
AvgSlope=sum(Slopes)/length(Slopes);](https://image.slidesharecdn.com/01687e7e-04d6-47cb-9214-a3a531e83da3-160224002608/85/11411368_Victory_Killian-104-320.jpg)

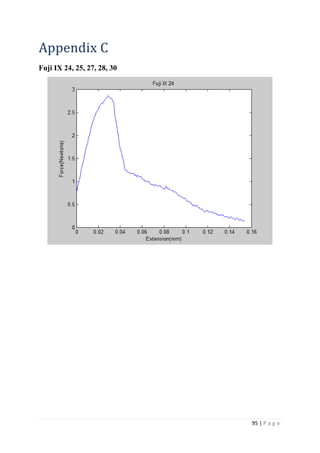
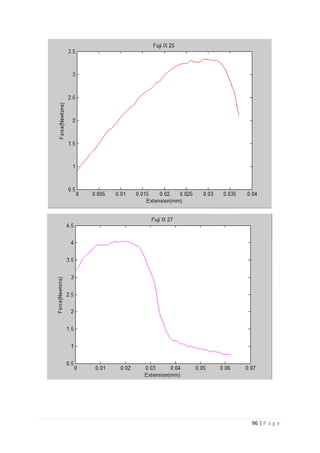
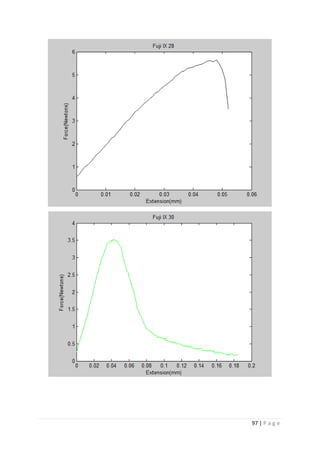
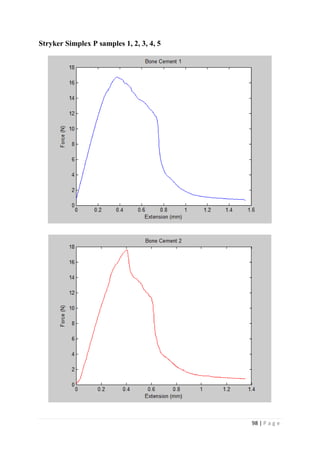
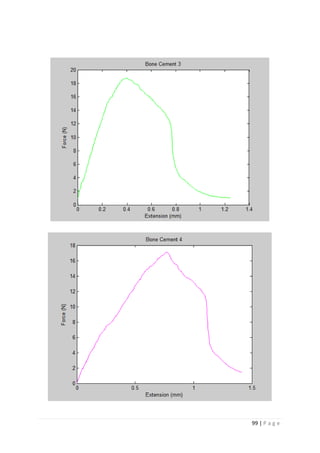
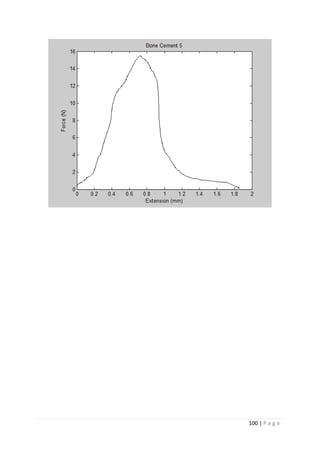
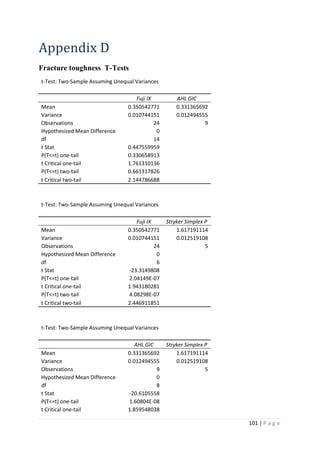
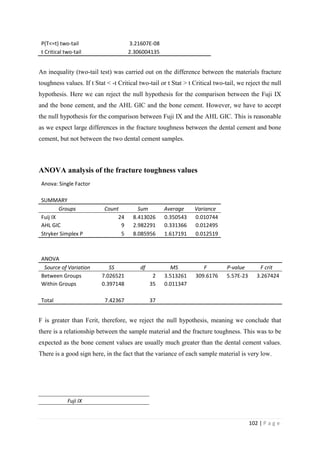
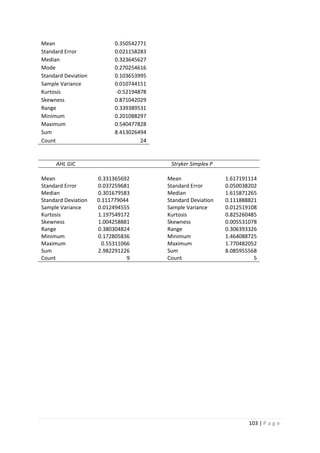


![Recent advances in direct tooth coloured restoration [autosaved]](https://cdn.slidesharecdn.com/ss_thumbnails/recentadvancesindirecttoothcolouredrestorationautosaved-210612091304-thumbnail.jpg?width=640&height=640&fit=bounds)
