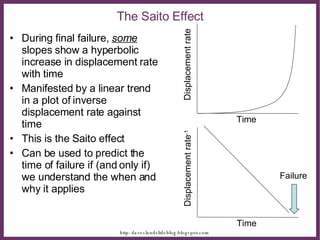
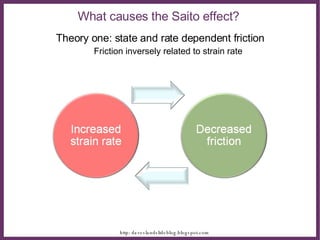
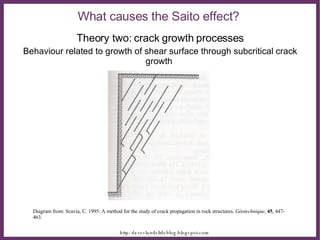
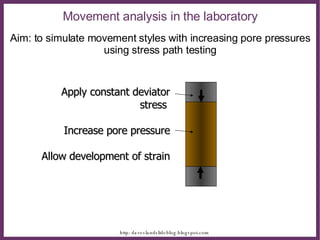
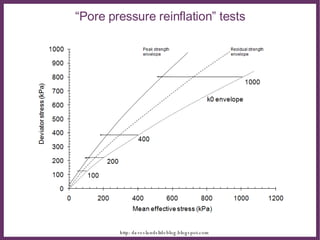
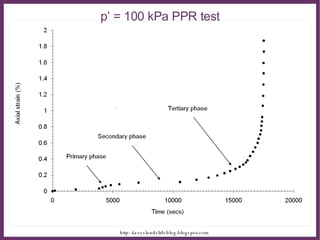
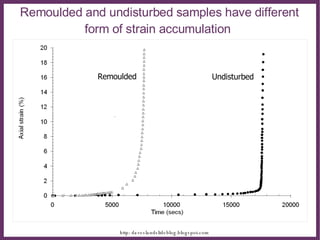
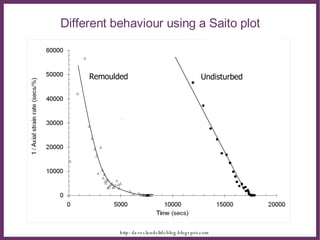
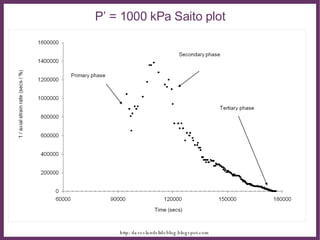
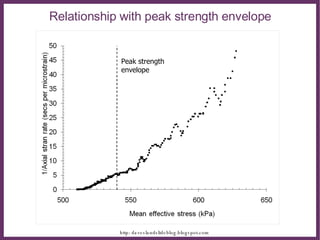
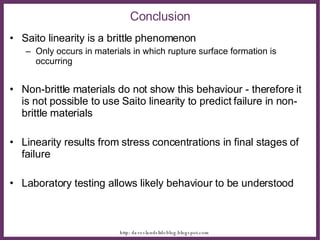
Temporal prediction in landslides – understanding the Saito effect David Petley Durham University, United Kingdom  Derek Petley Warwick University, United Kingdom Robert Allison Sussex University, United Kingdom
Worldwide fatal landslides - 2007 Large fatal landslides occur mainly in less developed countries Prediction may be a key tool to reduce their impact
The Saito Effect During final failure,  some  slopes show a hyperbolic increase in displacement rate with time Manifested by a linear trend in a plot of inverse displacement rate against time This is the Saito effect  Can be used to predict the time of failure if (and only if) we understand the when and why it applies Time Displacement rate Time Displacement rate -1 Failure
Theory one: state and rate dependent friction Friction inversely related to strain rate What causes the Saito effect?
Theory two: crack growth processes Behaviour related to growth of shear surface through subcritical crack growth  What causes the Saito effect?  Diagram from: Scavia, C. 1995. A method for the study of crack propagation in rock structures.  Géotechnique ,  45 , 447-463.
Movement analysis in the laboratory Aim: to simulate movement styles with increasing pore pressures using stress path testing Apply constant deviator stress  Increase pore pressure Allow development of strain
Black Ven landslide, United Kingdom
Conventional drained testing of undisturbed Foxmould
“ Pore pressure reinflation” tests
p’ = 100 kPa PPR test
Remoulded and undisturbed samples have different form of strain accumulation  Remoulded Undisturbed
Different behaviour using a Saito plot Remoulded Undisturbed
P’ = 1000 kPa Saito plot
Relationship with peak strength envelope Peak strength  envelope
Saito linearity is a brittle phenomenon Only occurs in materials in which rupture surface formation is occurring Non-brittle materials do not show this behaviour - therefore it is not possible to use Saito linearity to predict failure in non-brittle materials Linearity results from stress concentrations in final stages of failure Laboratory testing allows likely behaviour to be understood Conclusion

08 06 Xian Saito Talk 2003v

  • 1.
    Temporal prediction inlandslides – understanding the Saito effect David Petley Durham University, United Kingdom Derek Petley Warwick University, United Kingdom Robert Allison Sussex University, United Kingdom
  • 2.
    Worldwide fatal landslides- 2007 Large fatal landslides occur mainly in less developed countries Prediction may be a key tool to reduce their impact
  • 3.
    The Saito EffectDuring final failure, some slopes show a hyperbolic increase in displacement rate with time Manifested by a linear trend in a plot of inverse displacement rate against time This is the Saito effect Can be used to predict the time of failure if (and only if) we understand the when and why it applies Time Displacement rate Time Displacement rate -1 Failure
  • 4.
    Theory one: stateand rate dependent friction Friction inversely related to strain rate What causes the Saito effect?
  • 5.
    Theory two: crackgrowth processes Behaviour related to growth of shear surface through subcritical crack growth What causes the Saito effect? Diagram from: Scavia, C. 1995. A method for the study of crack propagation in rock structures. Géotechnique , 45 , 447-463.
  • 6.
    Movement analysis inthe laboratory Aim: to simulate movement styles with increasing pore pressures using stress path testing Apply constant deviator stress Increase pore pressure Allow development of strain
  • 7.
    Black Ven landslide,United Kingdom
  • 8.
    Conventional drained testingof undisturbed Foxmould
  • 9.
    “ Pore pressurereinflation” tests
  • 10.
    p’ = 100kPa PPR test
  • 11.
    Remoulded and undisturbedsamples have different form of strain accumulation Remoulded Undisturbed
  • 12.
    Different behaviour usinga Saito plot Remoulded Undisturbed
  • 13.
    P’ = 1000kPa Saito plot
  • 14.
    Relationship with peakstrength envelope Peak strength envelope
  • 15.
    Saito linearity isa brittle phenomenon Only occurs in materials in which rupture surface formation is occurring Non-brittle materials do not show this behaviour - therefore it is not possible to use Saito linearity to predict failure in non-brittle materials Linearity results from stress concentrations in final stages of failure Laboratory testing allows likely behaviour to be understood Conclusion