SlideShare a Scribd company logo
1 of 46
Download to read offline
Legislative Audit Division
State of Montana
Report to the Legislature
June 2006 Performance Audit
The Collection and Use of
Graduate and Dropout Data
Office of Public Instruction
This performance audit provides the Legislature information about the
collection and use of graduate and dropout data. To ensure data is
consistent among schools for reporting and decision-making, this report
makes recommendations for implementing controls as well as a means to
utilize the data. A written response from the Office of Public Instruction is
included at the end of the report.
Direct comments/inquiries to:
Legislative Audit Division
Room 160, State Capitol
PO Box 201705
06P-11 Helena MT 59620-1705
Help eliminate fraud, waste, and abuse in state government. Call the Fraud Hotline at
1-800-222-4446 statewide or 444-4446 in Helena.
PERFORMANCE AUDITS
Performance audits conducted by the Legislative Audit Division are designed to assess state
government operations. From the audit work, a determination is made as to whether agencies and
programs are accomplishing their purposes, and whether they can do so with greater efficiency
and economy. The audit work is conducted in accordance with audit standards set forth by the
United States Government Accountability Office.
Members of the performance audit staff hold degrees in disciplines appropriate to the audit
process. Areas of expertise include business and public administration, mathematics, statistics,
economics, political science, criminal justice, computer science, education, and biology.
Performance audits are performed at the request of the Legislative Audit Committee which is a
bicameral and bipartisan standing committee of the Montana Legislature. The committee consists
of six members of the Senate and six members of the House of Representatives.
MEMBERS OF THE LEGISLATIVE AUDIT COMMITTEE
Senator Joe Balyeat, Vice Chair Representative Dee Brown
Senator John Brueggeman Representative Hal Jacobson
Senator Jim Elliott Representative Christine Kaufmann
Senator Dan Harrington Representative Scott Mendenhall
Senator Lynda Moss Representative John Musgrove, Chair
Senator Corey Stapleton Representative Janna Taylor
LEGISLATIVE AUDIT DIVISION
Scott A. Seacat, Legislative Auditor Deputy Legislative Auditors:
Tori Hunthausen, James Gillett
Chief Deputy Legislative Auditor Jim Pellegrini
Room 160, State Capitol Building, PO Box 201705, Helena, MT 59620-1705
Phone (406) 444-3122 FAX (406) 444-9784 E-Mail lad@mt.gov
June 2006
The Legislative Audit Committee
of the Montana State Legislature:
This performance audit provides the Legislature information about the collection and use of graduation and
dropout data. To ensure data is consistent among schools for reporting and decision-making, this report
makes recommendations for implementing controls as well as a means to utilize the data. A written response
from the Office of Public Instruction is included at the end of the report.
We wish to express our appreciation to the Office of Public Instruction staff and local schools for
their cooperation and assistance during the audit.
Respectfully submitted,
/s/ Scott A. Seacat
Scott A. Seacat
Legislative Auditor
Legislative Audit Division
Performance Audit
The Collection and Use of
Graduate and Dropout Data
Office of Public Instruction
Members of the audit staff involved in this audit were Bridget Butler and
Angie Grove.
Table of Contents
List of Figures and Tables ........................................................................ii
Elected, Appointed and Administrative Officials....................................iii
Report Summary....................................................................................S-1
Chapter I – Introduction and Background............................................................................................... 1
Introduction............................................................................................... 1
Audit Scope and Objectives ................................................................ 1
Background............................................................................................... 2
State Requirements.............................................................................. 2
Federal Requirements.......................................................................... 2
Calculations of Graduate Data............................................................. 3
Calculations of Dropout Data.............................................................. 5
National Attention ............................................................................... 7
Report Organization.................................................................................. 8
Chapter II – OPI Guidelines...................................................................................................................... 9
OPI Guidelines for Reporting................................................................... 9
School Visits........................................................................................... 10
Data Verification ............................................................................... 11
Examples of Inconsistency ................................................................ 11
Guidelines Not Fully Utilized............................................................ 12
A Quality Assurance System Needed................................................ 12
Conclusion......................................................................................... 13
Documentation Needed for District Approved GEDs and Home
School Students ...................................................................................... 13
Home School Students....................................................................... 13
District Approved GED Recipients ................................................... 14
Chapter III - OPI's Plan For Improving Data Collection and Accuracy ............................................ 15
Initial Planning........................................................................................ 15
Resources Appropriated .................................................................... 15
Current Stage of Implementation............................................................ 15
The New System................................................................................ 16
Majority of States Have a Statewide Information Management
System..................................................................................................... 17
Impacts of the New System .................................................................... 18
Human Element Still Exists............................................................... 18
Chapter IV – Use of Data ......................................................................................................................... 19
Data is Integral to Decision-Making....................................................... 19
National Use of Data for Economic Analysis.................................... 19
Stakeholders' Use of Data.................................................................. 20
Accessibility and Use of Data................................................................. 21
Conclusion......................................................................................... 22
Appendix – A............................................................................................................................................A-1
Agency Response......................................................................................................................................B-1
Page i
List of Figures and Tables
Page ii
Figures
Figure 1 Economic Benefits of Education in Montana................................... 20
Tables
Table 1 National Methods for Calculating Graduation Rates ......................... 4
Table 2 Methods for Calculating Dropout Rates............................................. 6
Table 3 Student Status Definitions................................................................ 10
Elected, Appointed and Administrative Officials
Page iii
Office of Public Instruction Linda McCulloch, Superintendent
Dennis “Bud” Williams, Deputy Superintendent
Nancy Coopersmith, Assistant Superintendent
Madalyn Quinlan, Chief of Staff
Donna O’Neill, Division Administrator,
Measurement and Accountability Division
Page iv
Report Summary
The Legislative Audit Committee prioritized a performance audit of
Montana high school graduate and dropout rates to examine the
requirements associated with the calculations and their use. The
overall intent was to determine the effect and cause of any deviations
from established requirements. The scope of this audit focused on
three main activities: the current process of compiling data on
graduate and dropout students, how the implementation of a new
student information management system affects the process, and how
graduate and dropout data is used.
Background Although supervision and control of schools is dispersed among
different entities, the Superintendent of Public Instruction
administers the majority of services to students and teachers in over
400 school districts, as well as compiles data from schools. Based
on both state and federal requirements, the Office of Public
Instruction (OPI)’s Division of Measurement and Accountability
obtains data on student graduate and dropout numbers in the annual
data collection, which schools/districts submit each fall.
Federal Requirements The federal No Child Left Behind Act (NCLB) (PL 107-110),
enacted in 2002, holds states and the schools under their jurisdictions
accountable for student performance. While student achievement
must be the principal indicator of performance under NCLB,
statewide accountability systems are also required to incorporate one
additional academic outcome. At the secondary level, this “other
academic indicator” is required by NCLB to be the high school
graduate rate. States are required to set goals for themselves, and
then each school and district is to meet these goals through various
performance indicators.
Calculations of Graduate
Data
Although NCLB requires states to submit graduate data, it does not
mandate how it is collected or calculated. The National Center for
Education Statistics (NCES) suggests states use a Leaver-Based
Graduation Rate. This definition follows groups of students
throughout their four years of high school to calculate a graduation
rate. Montana, along with 31 other states, currently uses this
definition.
Page S-1
Report Summary
NCLB does not require states to directly report dropout rates.
However, the annual number of dropouts is needed to calculate the
graduation rate submitted annually to the federal government.
Montana collects dropout data from schools for local and state
analysis as well. An annual dropout rate is used in Montana. This
rate is established by dividing the annual enrollment by the number
of dropouts in a given year. The NCES recommends this method for
calculating dropout rates. It produces the lowest rate of any method
since it is only a snapshot of one year.
Calculations of Dropout
Data
School Visits To assure accuracy and consistency between schools, OPI has
established the Montana High School Completer and Dropout Data
Collection Handbook. This handbook instructs schools on how to
collect/input data to OPI for graduates and dropouts, as well as
provides information on calculating dropout and graduation rates.
To determine if these guidelines are followed we visited 14 schools
around the state to observe and interview school personnel on how
they use the OPI handbook and apply student status coding
procedures. We compared OPI data to documentation maintained by
the schools on the number of reported student graduates, dropouts
and completers. In all 14 schools visited, 100 percent of the data
reviewed at the schools was consistent to that reported by OPI.
Examples of Inconsistency We found inconsistencies in the manner in which status codes were
applied to students. During our visits we inquired how a student
would be coded in different scenarios; what constitutes a graduate,
completer, and dropout. The responses we received indicated
schools have different interpretations on how and when to apply OPI
student status codes as defined in guidelines. In 9 out of 14 schools
visited, we found inconsistencies in the application of student status
codes. For example, some schools categorize a student passing a
General Education Development (GED) test as a completer,
regardless of the administering entity. OPI, in accordance with
NCLB, requires students to pass a GED test through a program
administered by the school district in order to be coded as a
completer. In most Montana districts, this is usually done through an
alternative school within the district. A student who passes a GED
Page S-2
Report Summary
test through another entity other than the school district should be
coded a dropout, according to OPI guidelines.
Quality Assurance System
Needed
The National Center for Educational Accountability suggests, in
addition to establishing a statewide coding system for student status,
it is important to provide training on how those codes should be
applied. OPI does not provide on-site technical assistance for
Montana schools. There are no on-site visits to assist applicable
school personnel in interpreting coding requirements or
communicating guideline changes/updates.
Documentation Needed
for District Approved
GEDs and Home School
Students
There are some limitations to OPI guidelines. OPI guidelines do not
require verification of home school students and GED test recipients
from the district. Although OPI’s handbook states a home-schooled
student or a GED test recipient within the district is not a dropout,
audit work showed variation on the level of confirmation schools
require for a student in these categories. In order for data to be
accurate, OPI must be able to distinguish between students who drop
out, get a GED, or who transfer to another school or home school
situation. Montana school districts already require documentation of
transcripts for students transferring among other public schools; the
same standard could apply to the documentation of home schooling
or the entity that issued a GED test to a student.
OPI's Plan For Improving
Data Collection and
Accuracy
OPI began exploring the creation of a comprehensive educational
reporting system in 2003. The goal was to develop an infrastructure
for the educational community to gather school data via the Internet,
manage the secure storage of the data, and make the data accessible
to decision makers throughout the educational community. In 2004,
OPI contracted with an independent consultant to survey schools on
the data currently collected and the systems they use to manage data,
as well as write a concept and implementation plan for a student
record system. One of the most important findings of the
consultant’s survey was that the majority of respondent districts were
more than ready to see OPI move forward and initiate data
improvements.
Page S-3
Report Summary
Resources Appropriated In 2005, OPI requested funds to implement the student information
management system. The legislature appropriated $2.8 million for
the purpose of a new statewide K-12 education data system and
approved four full time staff. Most recently, OPI assembled an
evaluation team. They met on regular occasions, discussing and
conducting research on similar systems and, eventually, discussing
the request for proposal (RFP) for the creation and implementation
of the new system.
The New System According to planning documents, the RFP, and interviews with OPI
personnel, the new system will have three main components:
Student information, including student identifier and data
elements,
Special education data,
An electronic data warehouse.
OPI will begin initial implementation in the fall of 2006 by assigning
a student identifier to each student enrolled in public school, K-12.
OPI will still collect data on the number of graduates and dropouts,
but with the student identification component it will be possible to
roll up the data and look at overall numbers or drill down to see the
status of one particular student.
Human Element Still
Exists
The implementation of the new student information system will
improve OPI’s current data collection and compilation system in
various ways, but individuals will still decide on which status code to
enter for a student. If individuals are not using student status codes
consistently among schools, the new student information system will
not provide comparable data.
Data is Integral to
Decision-Making
Educational stakeholders in Montana agree graduate and dropout
data is an integral piece of information, specifically at the state level.
They consider it to be an important tool in efficient decision-making
and public reporting. Educational stakeholders believe the public
has a right to know the number of students graduating and have
access to that data. During audit work, one stakeholder discussed the
importance of looking at the bigger picture and the economic
Page S-4
Report Summary
impacts of education. The importance of paying attention to students
who are at risk of dropping out was highlighted. The number of
individuals in prison and on social welfare without a degree is high.
Stakeholders indicated the expense on the back end of “at-risk” kids
is much more than if efforts would focus on the problem while they
are in school.
Accessibility and Use of
Data
The OPI Division of Measurement and Accountability, which
collects, compiles, and analyzes graduate and dropout data, shares
data with various programs within OPI and presents annually to the
Board of Public Education. Some annual reports are posted to OPI’s
website as well. Audit work found no formal plan for educational
stakeholders and the public to access and analyze data stored in the
new system. The RFP does request the system have an interactive
querying tool to enable data driven decision-making by state-level
education staff and policy makers. Section 10.55.603, ARM, states
the assessment of educational programs and their effectiveness
should be examined through assessment results as well as graduate
and dropout numbers. In order to examine graduate and dropout
numbers for program effectiveness, statewide data needs to be
accessible. A more comprehensive system that provides various
means to access data would be more effective.
Page S-5
Chapter I – Introduction and Background
Introduction The Legislative Audit Committee prioritized a performance audit of
Montana high school graduate and dropout rates to examine the
requirements associated with the calculations and their use. The
overall intent was to determine the effect and cause of any deviations
from established requirements. For the 2004-2005 school year, the
Office of Public Instruction (OPI) reported an 84.8 percent
graduation rate and a 3.4 percent dropout rate. Audit work shows
inconsistent procedures are used to categorize students at schools.
Audit Scope and Objectives The scope of this audit focused on three main activities: the current
process of compiling data on graduate and dropout students, how the
implementation of a new student information management system
affects the process, and how graduate and dropout data is used.
Audit scope concentrated on graduate and dropout numbers in
Montana high schools (grades 9-12) for the school year 2004-2005.
Based on this scope, we established four main objectives:
1. Determine if guidelines and definitions provided by OPI are
designed to create consistent, accurate data on high school
graduates and dropouts.
2. Determine if schools follow guidelines and definitions for
reporting graduates and dropouts in a consistent manner.
3. Determine if the new student information management system
will provide comparable and uniform information on graduates
and dropouts among Montana public schools.
4. Determine if data on high school graduates and dropouts is used
by educational stakeholders for the purpose of making informed
decisions.
These objectives were addressed through the following
methodologies:
Review of national educational policy centers’ literature on
graduate and dropout data.
Review of state and federal laws applicable to the collection of
graduate and dropout numbers.
Review of legislative/agency documents and work completed to
date on the new student information system.
Page 1
Chapter I – Introduction and Background
Visits to 14 high schools to interview school personnel, observe
data collection, and verify aggregate data from OPI.
Review of other states’ student information systems.
Interviews with educational stakeholders (education associations,
schools, and Board of Public Education) on the use and
importance of graduate and dropout data.
Background State law separates responsibilities of the public school system
among three entities. The Montana Constitution provides the Board
of Public Education (BPE) with responsibility for long range
planning, and coordination and evaluation of policies and programs
of the public school system. Article X, Section 8, of the Montana
Constitution vests the supervision and control of the schools in each
district to an elected local board of trustees. Section 20-3-106,
MCA, provides the Superintendent of Public Instruction with general
supervision of public schools and districts of the state. Although
supervision and control of schools is dispersed among different
entities, the Superintendent of Public Instruction, administers the
majority of services to students and teachers in over 400 school
districts, as well as compiles data from schools. Based on both state
and federal requirements, OPI’s Division of Measurement and
Accountability obtains data on student dropout and graduate
numbers in the annual data collection (ADC), which schools/districts
submit each fall.
State Requirements Section 10-55-603, ARM, established by the BPE, requires schools
to “examine program effectiveness through graduation and dropout
rates…” As a means to implement this rule, schools construct a five-
year Comprehensive Education Plan which outlines goals for
continuous educational improvements. Each district reports on its
progress toward these goals annually in the ADC.
Federal Requirements The federal No Child Left Behind Act (NCLB) (PL 107-110),
enacted in 2002, holds states and the schools under their jurisdictions
accountable for student performance. While student achievement
must be the principal indicator of performance under NCLB,
statewide accountability systems are also required to incorporate one
additional academic outcome. At the secondary level, this “other
Page 2
Chapter I – Introduction and Background
academic indicator” is required by NCLB to be the high school
graduation rate. States are required to set goals for themselves, and
then each school and district is to meet these goals through various
performance indicators. If a school does not meet the set graduation
rate requirement, the district can incur fiscal sanctions under NCLB.
Title I of NCLB provides funds to help improve instruction in high
poverty schools and ensure poor and minority students have the same
opportunity as other students to meet academic standards. Schools
that consistently fail to meet these NCLB accountability
requirements may be required to use Title I monies to fund
supplemental education services, pay transportation costs for a
student to attend another school within their district, and/or develop a
restructuring plan.
Calculations of Graduate
Data
Although NCLB requires states to submit graduate data, it does not
mandate how it is collected or calculated. The National Center for
Education Statistics (NCES) suggests states use a Leaver-Based
Graduation Rate. This definition follows groups of students
throughout their four years of high school to calculate a graduation
rate. Montana, along with 31 other states, currently uses this
definition. Other common graduation rates used nationally are
detailed in Table 1.
Page 3
Chapter I – Introduction and Background
Table 1
National Methods for Calculating Graduation Rates
Rate Methodology Considerations
Leaver-Based
Graduation Rate
Calculated by dividing number of high
school diploma recipients by number
of students known to leave school by
dropping out, graduating or otherwise
completing high school.
Requires dropout data
from four consecutive
academic years, as well
as number of graduates
for the latest year
Relies on accuracy of
dropout data
Does not use enrollment
Enrollment-Based
Cumulative Promotion
Index
This method assumes graduation is a
process of three grade-to-grade
transitions (9 to 10, 10 to 11, and
11 to 12). Each transition is calculated
as a probability by dividing the
enrollment of the later year by the
enrollment of the previous year. These
separate probabilities are then
multiplied to produce the probability
that a student will graduate.
Requires enrollment data
from two consecutive
academic years, as well
as number of graduates
for the latest year
Requires calculation of
district-level rates to
determine the state rate
Does not use dropout
data
Enrollment-Based
Cohort Graduation Rate
Calculated by dividing the number of
students who receive a regular high
school diploma by the number of
students enrolled in ninth grade four
years earlier.
Requires enrollment data
from five consecutive
academic years, as well
as number of graduates
for the latest year
Requires census
population data
Does not use dropout
data
Source: Data compiled by Standard and Poor’s School Evaluation Services.
Page 4
Chapter I – Introduction and Background
Calculations of Dropout
Data
NCLB does not require states to directly report dropout rates.
However, the annual number of dropouts is needed to calculate the
graduation rate submitted annually to the federal government.
Montana collects dropout data from schools for local and state
analysis as well. An annual dropout rate is used in Montana. This
rate is established by dividing the number of dropouts by the number
enrolled in a given year. The NCES recommends this method for
calculating dropout rates. It produces the lowest rate of any method
since it is only a snapshot of one year.
There are three main methods used by states to calculate dropout
rates.
Page 5
Chapter I – Introduction and Background
Table 2
Methods for Calculating Dropout Rates
Annual Dropout Rate Longitudinal Dropout Rate Attrition Rate
Description Measures the percentage of
students who drop out of
school during one year.
Measures the percentage of
students from a class of 9th
graders who drop out before
completing high school.
Estimates the percentage of
students from a class of 9th
graders not enrolled in
grade 12 four years later
for whatever reason.
Calculation Divide the number of
students who drop out
during a school year by the
total number enrolled that
year.
Divide the number of students
who drop out by the end of
grade 12, by the total number of
students in the original 9th
grade
class. Students who transfer in
or out over the years are added
or subtracted.
Subtract grade 12
enrollment from grade 9
enrollment four years prior
then divide by the grade 9
enrollment.
Advantages • Measures annual
performance
• Requires only one
year of data
• Can be calculated for
any school or district
with students in any
of the grades covered
• Can be disaggregated
• More consistent with the
publics’ understanding of
a dropout rate
• Districts have more time
to encourage dropouts to
return to school before
being held accountable
• Provides a simple
measure of school
leavers when
aggregate enrollment
numbers are all that
is available
Disadvantages • Produces the lowest
rate of any method
• May not correspond
to the public’s
understanding of a
dropout rate
• Requires multiple years
of data
• Does not produce a
dropout rate by grade
• Program improvements
may not be reflected for
several years
• Produces the highest
rate of any method
• Does not distinguish
attrition resulting
from dropping out
from that resulting
from transfers,
retentions, death, etc.
School example
(Grades 9-12)
2.2% 8.5% 36.6%
Source: Compiled by the Legislative Audit Division.
The table defines and discusses the advantages and disadvantages of
each rate. The bottom row of the table depicts a dropout rate for the
same school, same year, for each calculation. It shows the
differences produced among the methods.
Page 6
Chapter I – Introduction and Background
Recent national studies comparing state graduation rates found
different methods produce different results and in some cases the
disparities can be quite large. More specifically, national research
suggests that approaches for calculating graduation rates based on
dropout data produce inflated graduation estimates compared with
other methods. This is due to the reliance on the accuracy of dropout
data, and not using enrollment data as a basis but rather diploma
recipients. Currently, state accountability plans submitted for
NCLB, use graduation rates that incorporate dropout data in more
than half of all states (including Montana). Changes and
improvements in Montana’s methods are discussed in Chapters III
and IV.
National Attention The calculation of graduation and dropout rates has received national
attention due to the high standards set by NCLB’s accountability
requirements. Through audit work, various states have discovered
inaccuracies in their calculation of graduates and dropouts. The
following illustrates some examples:
A Texas audit of 16 Houston schools found that more than half
of the 5,500 students who left in the 2000-2001 school year
should have been declared dropouts, but were not. That year,
Houston schools reported that only 1.5 percent of its students
dropped out.
A 2001 Michigan audit of the educational accountability
program found the education department did not have an
effective process for gathering data, and that calculations used
for graduate and dropout rates were not in accordance with state
statutes.
The national attention on misreporting of graduate and dropout
numbers spurred educational policy groups, including a National
Governors Association Task Force, to recommend the creation and
establishment of better systems and methods of collecting, analyzing,
and reporting graduate and dropout data, which includes looking at
longitudinal data for both groups. The difficult part of this task is
accurately accounting for students who do not finish, and
distinguishing between those who should be counted as dropouts and
those who should not. In order to calculate precise graduation rates,
Page 7
Chapter I – Introduction and Background
states need integrated information systems that can tell if a student
who stopped attending one high school shows up in another school.
Report Organization The next chapter will outline how OPI currently collects and guides
schools on graduate and dropout data. Chapter III details OPI’s
current plans for improving data collection, and the last chapter
discusses the importance of using dropout and graduate data for
decision-making.
Page 8
Chapter II – OPI Guidelines
Page 9
OPI Guidelines for
Reporting
The Office of Public Instruction (OPI) is required to submit Montana
graduation rates annually to the federal government for No Child
Left Behind (NCLB) requirements. To assure accuracy and
consistency between schools, OPI has established the Montana High
School Completer and Dropout Data Collection Handbook. These
guidelines were developed in the early 1990’s, and are continually
updated, taking language directly from the National Center on
Education Statistics. These guidelines outline definitions for
dropouts, graduates, completers, and no shows. This handbook
instructs schools how to collect/input data to OPI for graduates and
dropouts, as well as provides information on calculating dropout and
graduation rates. OPI personnel calculate these percentages. Listed
in the following table are brief definitions for the six OPI-defined
categories of Montana student status.
Chapter II – OPI Guidelines
Table 3
Student Status Definitions
Student Status Definition
Graduate A student who completed the high school graduation
requirements of a school district in four years or less,
or had a special education plan allowing more than four
years to graduate.
Completer A student who passes a GED test through a program
administered by the school district and/or a student
who takes more than the standard number of years (4)
to receive a high school diploma.
No Show A student who was enrolled in school the previous
year, but as of the fall collection date, the student has
not shown up to school. The student should be counted
as a dropout the following year if a transfer status is not
confirmed.
Dropout A student who was enrolled the previous year but quit
school at some point and is not currently enrolled.
Transfer A student who exits from one school to enroll in
another.
Home School A student who has left the public school system to be
taught at home and is registered with the county
superintendent as a home schooler.
Source: Compiled by the Legislative Audit Division from agency records.
In defining student status, the handbook provides a different example
and perspective to illustrate each definition. According to the
National Center for Educational Accountability (NCEA), one of ten
essential elements in collecting quality data is having accurate
student level dropout and graduate data. In an effort to do this,
NCEA suggests establishing a statewide coding system for the
various reasons students leave a school and clear guidelines on how
those codes should be applied. OPI has established such a system for
Montana.
School Visits To determine if these guidelines are followed, we visited 14 schools
around the state to observe and interview school personnel on how
they use the OPI handbook and apply status coding procedures. The
Page 10
Chapter II – OPI Guidelines
schools were chosen based on their average enrollment and dropout
rate. Averages for both enrollment and dropout rates were calculated
using three years of data (2001-2004). We divided Montana high
schools into four groups – high, medium, low and zero percent
dropout rates. Within the four groups, we chose schools based on
enrollment size and dropout rate. A small, medium and large
enrollment school was chosen within each of the four dropout
groups.
Data Verification We compared OPI data to documentation maintained by the schools
on the number of reported student graduates, dropouts and
completers. In all 14 schools visited, 100 percent of the data
reviewed at the schools was consistent to that reported by OPI. Our
review confirmed that the data in school information systems
matched data input into OPI’s system.
Examples of Inconsistency We found inconsistencies in the manner in which status codes were
applied to students. During our visits we inquired how a student
would be coded in different scenarios; what constitutes a graduate,
completer, and dropout. The responses we received indicated
schools have different interpretations on how and when to apply OPI
defined status codes. In 9 out of 14 schools visited, we found
inconsistencies in the application of student status codes. For
example, some schools categorize a student passing a General
Education Development (GED) test as a completer, regardless of the
administering entity. OPI guidelines, in accordance with NCLB,
require students to pass a GED test through a program administered
by the school district in order to be coded as a completer. In most
Montana districts, this is usually done through an alternative school
within the district. A student who passes a GED test through another
entity other than the school district should be coded a dropout,
according to OPI guidelines.
Another example is a student that attends Job Corps. Depending on
the school, this type of student is coded in various ways; dropout,
graduate, and completer. Job Corps is an education and vocational
training program administered by the U.S. Department of Labor that
Page 11
Chapter II – OPI Guidelines
serves young people ages 16 through 24. At Job Corps, students
enroll to learn a trade, earn a high school diploma/GED, and get help
finding a job. OPI’s guidelines are unclear in defining a status code
for Job Corps students or when those students should be coded as a
dropout versus a completer.
Another variation found in schools was how a “no show” student is
coded. A “no show” student is one who was enrolled either from
eighth grade or in the previous year; however, when school begins in
the fall, this student does not show up. Some schools are reporting
this student as a dropout in the Annual Data Collection (ADC) the
same year, while others are waiting until the following school year to
report, in hopes of receiving more information on whether the
student is a dropout or transfer. OPI guidelines allow a school to
wait until the following year to report a “no show.” Our visits also
found a school that only reports dropouts as those students who drop
out of the twelfth grade, rather than grades 9-12, as required.
Although ethnicity has no effect on dropout or graduation numbers,
we found a school that coded students as White, non-Hispanic, even
when that was not the student’s ethnicity.
Guidelines Not Fully Utilized Although OPI’s dropout and graduate handbook provides detailed
guidelines for student status codes, schools are using the guidelines
on a limited basis. As part of our audit work, we interviewed
officials responsible for tracking student status and reporting it to
OPI. The staff person responsible for these duties varied by school
and included either the secretary, principal, or data specialist.
During interviews we asked if these officials found the handbook
useful. Three of the 14 schools we visited found OPI guidelines for
graduates and dropouts to be very useful. Eight schools use the
guidelines to some degree and the other three do not use the
guidelines at all. Therefore, a majority (11 of 14) of the schools are
using the guidelines on a limited basis or not at all.
A Quality Assurance System
Needed
NCEA suggests, in addition to establishing a statewide coding
system for student status, it is important to provide training on how
those codes should be applied. They also recommend each state
Page 12
Chapter II – OPI Guidelines
have a system for occasionally spot-checking the accuracy of data in
cases that are not flagged by statistical checks. Currently, OPI has
not developed this level of quality assurance. For example, OPI does
not provide on-site technical assistance for Montana schools to assist
applicable school personnel in interpreting coding requirements or
communicating guideline changes/updates.
Conclusion OPI’s Montana High School Completer and Dropout Data
Collection Handbook is an effort to create consistent and accurate
data among schools. The handbook provides clear, detailed
guidelines. However, when establishing policy (handbook) the
issuing entity has a responsibility to ensure it is communicated and
followed by the intended recipients (schools). Additional assurance
could be provided through OPI staff conducting on-site audits of
status code application, as well as providing technical assistance.
Off-site assurances could include building on existing statistical
checks in the database, as well as randomly calling to verify a
student who has recently changed status.
Recommendation #1
We recommend the Office of Public Instruction establish a
quality assurance system that includes:
A. On-site technical assistance training on status code
procedures and requirements.
B. Random verification of student status coding and data
submitted.
Documentation Needed
for District Approved
GEDs and Home School
Students
There are some limitations to OPI guidelines. OPI guidelines do not
require verification of home school students and GED test recipients
from the district. Although OPI’s handbook states a home-schooled
student or a GED test recipient within the district is not a dropout,
audit work showed variation on the level of confirmation schools
require for a student in these categories.
Home School Students Home school students in Montana are required to register with the
County Superintendent of Schools. Some of our sample schools
Page 13
Chapter II – OPI Guidelines
verify the student’s registration with the County Superintendent
while other schools do not. OPI guidelines do not require schools to
verify home school registration. During interviews with school
personnel, concerns of schools misclassifying a student as a
homeschooler arose. School personnel stated some other schools
may be coding a dropout as a home school student in order to not
negatively affect their school’s graduation and dropout rates. By not
accurately coding a dropout, schools inflate their graduation rate and
decrease their dropout rate.
District Approved GED
Recipients
The level of confirmation varies on students who pass the GED test
as well. As mentioned earlier, we found schools did not confirm
whether a GED test was taken through a district-administered
program. Audit work found some schools categorize a student
completing a GED, even if outside the district (not district
administered), as a completer. In one example a student passed a
GED test through a private program after dropping out of school.
School personnel became aware of the student’s GED achievement,
and therefore coded the student’s status as a completer instead of a
dropout. OPI requires students to receive a GED from a
district-administered program, which is usually an alternative school
within the district, in order to be counted as a completer. This
requirement is consistent with NCLB law.
In order for data to be accurate, OPI must be able to distinguish
between students who drop out, get a GED, or who transfer to
another school or home school situation. Montana school districts
already require documentation of transcripts for students transferring
among public schools; the same standard could apply to
documentation of home schooling or the entity issuing a GED test to
a student.
Recommendation #2
We recommend OPI incorporate into its guidelines that schools
verify and document home school registration and GED test
information.
Page 14
Chapter III - OPI's Plan For Improving Data
Collection and Accuracy
Page 15
Initial Planning The Office of Public Information began exploring the creation of a
comprehensive educational reporting system in 2003. The goal was
to develop an infrastructure for the educational community to gather
school data via the Internet, manage the secure storage of the data,
and make the data accessible to decision makers throughout the
educational community. In 2004, OPI contracted with an
independent consultant to survey schools on the data currently
collected and the systems they use to manage the data, as well as
write a concept and implementation plan for a student information
system.
One important finding of the consultant’s survey was the majority of
respondent districts were more than ready to see OPI move forward
and initiate data improvements. Many districts indicated they were
already collecting student level data and could provide such data to
OPI in many of the areas surveyed. In the concept and
implementation plan, the consultant emphasized the need for OPI to
provide leadership, coordination and support for a statewide student
information system. The plan states a comprehensive reporting
system should be the primary source of educational information.
The consultant’s work provided OPI with the feedback necessary to
move forward on implementing the student information system.
Resources Appropriated In 2005, OPI requested for funds to implement a student information
system. The legislature appropriated $2.8 million for the purpose of
a new statewide K-12 system and approved four full-time staff. The
request for proposal (RFP) for the system went out with a cost
estimate of $2 million, which leaves $800,000 for the new positions
over the 2007 biennium. Positions being hired for this project are:
database administrator, project manager, student records manager,
and data resource administrator.
Current Stage of
Implementation
Most recently, OPI assembled an evaluation team which was
comprised of eight OPI staff members, as well as two school staff
members with knowledge about information technology and special
Chapter III - OPI's Plan For Improving Data Collection and Accuracy
education. They met on regular occasions, discussing and
conducting research on similar systems for the creation and
implementation of the new system. Research consisted of important
components to consider such as:
An audit system to assess data quality, validity, and
reliability.
A unique identifier for each student in the system.
Interoperability.
Privacy protection.
The New System OPI is currently in the process of contracting with a vendor to
develop the new system. According to planning documents, the
RFP, and interviews with OPI personnel, the new system will have
three main components:
Student information; including student identifier and data
elements,
Special education data,
An electronic data warehouse.
The student identification component will provide a unique identifier
for each student entering the Montana public education system. This
number will remain the student’s identifier until he/she exits the
system. As well, it will provide information on each student such as
gender, grade, etc. Currently, there is no way to track students
throughout the public education system because OPI collects
aggregate numbers, not information to identify or track an individual
student through the education system.
The second main component will provide information on the
statewide system for special education students. All documents
pertinent to the student will be accessed electronically through the
student’s identification number.
The third component of the new system will be an electronic data
warehouse where all student/school level data will be stored
annually. This data will be updated periodically as student
Page 16
Chapter III - OPI's Plan For Improving Data Collection and Accuracy
information changes. Information can be accessed to conduct trend
analysis by district or state personnel.
OPI will begin initial implementation in the fall of 2006 by assigning
a student identifier to each student enrolled in public schools, K-12.
OPI will still collect data on the number of graduates and dropouts,
but with the student identification component it will be possible to
roll up the data and look at overall numbers or drill down to see the
status of one particular student.
Majority of States Have a
Statewide Information
Management System
A student identifier and data warehouse system similar to what
Montana is implementing exists in over half of the states. Thirty-two
states and the District of Columbia already have such a system in
place. Sixteen states, including Montana are currently developing a
system. Only two states have not yet looked at developing such a
system.
The National Center for Educational Accountability (NCEA)
recommends states institute a longitudinal data system which
matches individual student records over time, from pre-kindergarten
through twelfth grade and into post-secondary education. NCEA
states,
“That when states collect the most relevant data and are able
to examine longitudinally, they can answer the questions
that are at the core of educational effectiveness. States are
spending hundreds of millions of dollars to improve student
achievement. But without quality data, they are essentially
flying blind.”
Other states have various components to their statewide student
information management systems; for example, teacher information,
fiscal or budget information, and post-secondary information.
Although OPI documents and interviews suggest a desire for these
additional components, at this point, there is only funding allocated
to implement the three components previously mentioned.
Page 17
Chapter III - OPI's Plan For Improving Data Collection and Accuracy
Impacts of the New
System
The most obvious benefit from the graduate and dropout perspective
is the ability to track or follow students within Montana public
schools. Currently, one student could be coded as a dropout from
two schools in the same year. If a student attends two schools and
drops from both within one year, duplications in student coding
occur. If a student transfers to another school, but the receiving
school never requests transcripts, the student may be coded as a
dropout rather than a transfer. The new system will help address
these problems. No longer will OPI’s data be just disaggregated
numbers; with the new system there will be a higher level of detail
available. For example, stakeholders will be able to correlate certain
factors such as the number of dropouts to students in advanced
placement or special education classes statewide. Because there will
be a data warehouse component to the system, longitudinal data or
trend analysis will be possible. In addition, stakeholders believe a
longitudinal rate for dropouts would be a better representation of the
dropout rate for Montana.
The implementation of the new student information system will
improve OPI’s current data collection and compilation system in
various ways, but individuals will still decide on which status code to
enter for a student. If individuals are not using student status codes
consistently among schools, the new student information system will
not provide comparable data. The importance of this was stressed in
Chapter II and addressed in Recommendation 1.
The issue was also raised in various interviews with stakeholders.
The subject of consistent, accurate data came up repeatedly.
Stakeholders do not believe all schools are defining a dropout in the
same manner. Our school visits reaffirm this statement. Consistency
in the application of student status codes is essential to assure the
validity and accuracy of the data.
Page 18
Human Element Still Exists
Conclusion: The statewide student information system will
assist in providing quality, uniform data on graduates and
dropouts. However, OPI’s data collection system will still
largely depend on the consistent application of student status
codes by school personnel.
Chapter IV – Use of Data
Data is Integral to
Decision-Making
Educational stakeholders in Montana agree graduate and dropout
data is an integral piece of information, specifically at the state level.
They consider it to be an important tool in efficient decision-making
and public reporting. Educational stakeholders believe the public
has a right to know the number of students graduating and have
access to that data. During audit work, one stakeholder discussed the
importance of looking at the bigger picture and the economic
impacts of education. The importance of paying attention to students
who are at risk of dropping out was highlighted. The number of
individuals in prison and on social welfare without a degree is high.
The expense on the back end of “at-risk” kids is much more than if
efforts would focus on the problem while they are in school.
National Use of Data for
Economic Analysis
The National Center for Education Statistics, in conjunction with the
U.S. Department of Commerce, confirms the importance of tracking
these areas, by stating, “Dropouts from high school are more likely
to be unemployed and earn less when they are employed than those
who complete high school.” Research presented to the New Mexico
Business Roundtable for Educational Excellence by the Office of
Education Accountability estimates a lifetime loss of tax revenues,
from males ages 25-34 years who did not complete high school, to be
approximately $944 billion, with cost increases to public welfare and
crime at $24 billion.
Montana decision-makers could use similar approaches to look at the
effects of dropouts on Montana’s economy. The following chart
depicts one method of calculating the economic impacts of a high
school diploma in Montana.
Page 19
Chapter IV – Use of Data
Figure 1
Economic Benefits of Education in Montana
Annual Increase in Earnings by Educational Level
$0
$5,000,000
$10,000,000
$15,000,000
$20,000,000
$25,000,000
$30,000,000
$35,000,000
High School
Diploma
Some
Postsecondary
Eductaion
Bachelor's
Degree
Source: Data compiled by Alliance for Excellent Education, 2005.
The increased earnings in the above chart were calculated using
graduate rate data from the National Center for Education Statistics
and the Manhattan Institute for Policy Research and a formula from
the U.S. Department of Commerce. The availability of better
graduate and dropout data provides a better means to analyze
economic costs and benefits of education.
Stakeholders' Use of Data At the local level, schools use graduate and dropout data to assess the
performance of their individual school and district. Administrators
review the data collected on the number of graduates and dropouts in
order to discern the bigger picture of the school’s performance. One
educational stakeholder stated, “dropout and graduate data is just one
indicator of school performance, but a foundational one so the
district and state know where to put their resources.” A
superintendent of a large district in the state developed dropout
prevention programs and started an alternative high school because
the data for his district showed high numbers of dropouts. Because
Page 20
Chapter IV – Use of Data
graduation and dropout rates are performance indicators for schools,
stakeholders indicated they would like to see a more consistent
depiction of the rates.
Accessibility and Use of
Data
The OPI Division of Measurement and Accountability at the Office
of Public Instruction collects, compiles, and analyzes graduate and
dropout data, shares data with various programs within OPI and
presents annually to the Board of Public Education. Upon request,
the division also provides data to educational stakeholders in the
state and researchers from around the nation. Some annual reports
are posted to OPI’s website, as well. Audit work found no formal
plan for educational stakeholders and the public to access and
analyze data stored in the new system. The RFP does request the
system have an interactive querying tool to enable data driven
decision-making by state-level education staff and policy makers.
In the OPI concept and implementation plan for the new statewide
student information system the term “information democracy” is
used. Information democracy means everyone (with appropriate
security) can access data in the data warehouse component of the
system (i.e., it is an open system). Different stakeholders in the
educational community need different types of access to data. For
example, members of the general public often need summary or
“canned reports” from the data warehouse, whereas some researchers
or legislators may need to conduct a series of ‘ad hoc’ queries. In
such a system, less experienced data users must have reports
regularly pushed to them via the Internet and those groups that have
the capability for greater analysis may have permission to pull more
selective data at any time from the data warehouse.
Section 10.55.603, ARM, states the assessment of educational
programs and their effectiveness should be examined through
assessment results as well as graduate and dropout numbers. In
order to examine graduate and dropout numbers for program
effectiveness, statewide data needs to be accessible. A
comprehensive system that provides various means to access data
would be more effective.
Page 21
Chapter IV – Use of Data
Conclusion OPI is working to implement a $2 million statewide student
information system. The implementation of a new information
system would be an optimal time to establish a plan for data
accessibility and dissemination. An accessibility and distribution
plan would enable the state to effectively utilize the $2 million
information system to its full potential. The implementation of the
new system is the first step to providing quality data to educational
stakeholders. However, this data should be used and analyzed.
A plan for data distribution and accessibility is the next step in fully
utilizing the student information management system.
Recommendation #3
We recommend OPI establish a plan for accessing and
disseminating the data in the new student information system.
Page 22
Appendix A – Average Dropout Rate
By High School
Page A-1
School
3 Year Average
Dropout Rate
Absarokee High School 0.53%
Alberton High School 1.33%
Anaconda High School 3.62%
Arlee High School 2.64%
Augusta High School 0.00%
Bainville High School 0.00%
Baker High School 0.37%
Beaverhead Co High School 2.63%
Belfry High School 3.23%
Belgrade High School 4.28%
Belt High School 1.33%
Big Sandy High School 1.33%
Big Sky High School 3.16%
Bigfork High School 2.56%
Billings Sr High School 4.67%
Billings West High School 3.02%
Blgs Central Catholic H S 0.40%
Blue Sky High School 0.00%
Box Elder High School 12.32%
Bozeman High School 3.22%
Brady High School 3.09%
Bridger High School 1.00%
Broadview High School 0.74%
Broadwater High School 3.00%
Brockton High School 3.35%
Browning High School 7.25%
Butte Central High School 0.22%
Butte High School 5.58%
C M Russell High School 2.18%
Capital High School 3.32%
Carter County High School 0.99%
Cascade High School 3.24%
Centerville High School 1.79%
Charlo High School 2.54%
Chester High School 1.12%
Chinook High School 2.77%
Choteau High School 0.40%
Circle High School 1.19%
Colstrip High School 2.09%
Columbia Falls High Schl 4.29%
Appendix A – Average Dropout Rate by High School
School
3 Year Average
Dropout Rate
Columbus High School 1.70%
Conrad High School 3.14%
Corvallis High School 3.98%
Culbertson High School 0.47%
Custer Co District High 4.15%
Custer High School 1.10%
Cut Bank High School 4.01%
Darby High School 5.50%
Dawson High School 2.13%
Denton High School 1.24%
Dodson High School 0.00%
Drummond High School 0.00%
Dutton High School 0.00%
Eagle High School 0.00%
Ennis High School 0.00%
Fairfield High School 0.00%
Fairview High School 3.45%
Fergus High School 3.03%
Flathead High School 7.47%
Flaxville High School 0.00%
Florence-Carlton HS 0.85%
Forsyth High School 3.25%
Fort Benton High School 1.16%
Frazer High School 7.52%
Frenchtown High School 2.84%
Froid High School 0.00%
Fromberg High School 2.33%
Gardiner High School 2.13%
Garfield Co Dist HS 0.96%
Geraldine High School 0.75%
Geyser High School 0.00%
Glasgow High School 2.58%
Granite High School 4.33%
Grass Range High School 0.64%
Great Falls Cent Cath HS 0.66%
Great Falls High School 3.10%
Hamilton High School 3.42%
Hardin High School 5.74%
Harlem High School 6.10%
Harlowton High School 1.25%
Harrison High School 0.00%
Havre High School 3.95%
Appendix A – Average Dropout Rate by High School
Page A-3
School
3 Year Average
Dropout Rate
Hays-Lodge Pole High Sch 11.56%
Heart Butte High School 12.68%
Helena High School 5.43%
Hellgate High School 5.10%
Highwood High School 0.82%
Hinsdale High School 0.00%
Hobson High School 0.00%
Hot Springs High School 0.86%
Huntley Project High Schl 0.88%
Hysham High School 1.27%
Jefferson High School 2.44%
Joliet High School 1.12%
Joplin-Inverness HS 0.00%
Judith Gap High School 0.00%
Kalispell Jr High School 9th 1.62%
K-G High School 0.00%
Lambert High School 0.00%
Lame Deer High School 10.88%
Laurel High School 3.57%
Lavina High School 0.00%
Libby High School 4.21%
Lima High School 0.00%
Lincoln Co High School 2.58%
Lincoln High School 3.33%
Lodge Grass High School 18.71%
Loyola-Sacred Heart H S 0.16%
Lustre Christian H S 0.00%
Malta High School 0.35%
Manhattan Christian H S 0.00%
Manhattan High School 0.96%
Medicine Lake High School 0.00%
Melstone High School 1.19%
Moore High School 1.05%
Mount Ellis Academy High 0.44%
MT Sch For Deaf & Blnd HS 0.00%
Nashua High School 0.00%
Northern Cheyenne Trib HS 8.46%
Noxon High School 1.67%
Opheim High School 0.00%
Outlook High School 0.00%
Park City High School 0.00%
Park High School 2.54%
Appendix A – Average Dropout Rate by High School
School
3 Year Average
Dropout Rate
Peerless High School 0.00%
Pine Hills School HS 0.00%
Plains High School 2.56%
Plenty Coups High School 11.06%
Plentywood High School 2.12%
Plevna High School 0.00%
Polson High School 6.93%
Poplar High School 10.17%
Powder River Co Dist High 0.23%
Powell County High School 6.86%
Power High School 2.50%
Rapelje High School 0.00%
Red Lodge High School 1.53%
Reedpoint High School 0.00%
Richey High School 0.00%
Riverside High School 0.00%
Roberts High School 0.00%
Rocky Boy High School 12.18%
Ronan High School 8.38%
Rosebud High School 1.15%
Roundup High School 4.11%
Roy High School 0.00%
Ryegate High School 2.78%
Saco High School 1.10%
Savage High School 1.56%
Scobey High School 0.30%
Seeley-Swan High School 2.56%
Sentinel High School 3.28%
Shelby High School 7.55%
Shepherd High School 3.19%
Sheridan High School 1.10%
Shields Valley High Schl 2.47%
Sidney High School 2.57%
Simms High School 3.53%
Skyview High School 1.96%
St Ignatius High School 4.94%
St Labre High School 2.52%
St Regis High School 1.00%
Stanford High School 1.19%
Stevensville High School 3.93%
Sunburst High School 1.49%
Superior High School 1.46%
Appendix A – Average Dropout Rate by High School
Page A-5
School
3 Year Average
Dropout Rate
Sweet Grass Co High Schl 2.38%
Terry High School 1.56%
Thompson Falls High Schl 2.14%
Three Forks High School 1.43%
Troy High School 1.27%
Turner High School 1.10%
Twin Bridges High School 0.46%
Two Eagle River High Schl 8.26%
Valier High School 0.44%
Victor High School 3.24%
West Yellowstone HS 6.82%
Westby High School 0.00%
White Sulphur Springs HS 3.80%
Whitefish High School 3.05%
Whitehall High School 3.39%
Whitewater High School 0.00%
Wibaux High School 0.99%
Willow Creek High School 0.00%
Winifred High School 0.72%
Winnett High School 0.00%
Wolf Point High School 5.68%
Agency Response
Page B-1
Page B-2
06P-11 use of graduation data

More Related Content

What's hot

The Register of Voters : - Where we are one week ahead of Election Day
The Register of Voters : - Where we are one week ahead of Election DayThe Register of Voters : - Where we are one week ahead of Election Day
The Register of Voters : - Where we are one week ahead of Election DayAfrica Centre For Open Governance
 
United States--2012 FDA Global Electoral Fairness Audit Report (Revised April...
United States--2012 FDA Global Electoral Fairness Audit Report (Revised April...United States--2012 FDA Global Electoral Fairness Audit Report (Revised April...
United States--2012 FDA Global Electoral Fairness Audit Report (Revised April...Foundation for Democratic Advancement
 
Our Money in Politics: Version 3.0
Our Money in Politics: Version 3.0Our Money in Politics: Version 3.0
Our Money in Politics: Version 3.0radaprogram
 
Mapping Report. State Electronic Information resourses
Mapping Report. State Electronic Information resoursesMapping Report. State Electronic Information resourses
Mapping Report. State Electronic Information resoursesRuslan Silvestrov
 
Mapping Report «State Electronic Information Resources. Status and Perspectives»
Mapping Report «State Electronic Information Resources. Status and Perspectives»Mapping Report «State Electronic Information Resources. Status and Perspectives»
Mapping Report «State Electronic Information Resources. Status and Perspectives»TAPAS_PROJECT
 
Zimbabwe 2018 biometric voters roll analysis - Pachedu
Zimbabwe 2018 biometric voters roll analysis - PacheduZimbabwe 2018 biometric voters roll analysis - Pachedu
Zimbabwe 2018 biometric voters roll analysis - PacheduPovo News
 
THE EFFECT OF COMPETENCE OF HUMAN RESOURCES, INFORMATION TECHNOLOGY AND ACCOU...
THE EFFECT OF COMPETENCE OF HUMAN RESOURCES, INFORMATION TECHNOLOGY AND ACCOU...THE EFFECT OF COMPETENCE OF HUMAN RESOURCES, INFORMATION TECHNOLOGY AND ACCOU...
THE EFFECT OF COMPETENCE OF HUMAN RESOURCES, INFORMATION TECHNOLOGY AND ACCOU...State Islamic University Alauddin Makassar
 
Democratic Republic of Congo--2011 FDA Global Electoral Audit Report
Democratic Republic of Congo--2011 FDA Global Electoral Audit Report Democratic Republic of Congo--2011 FDA Global Electoral Audit Report
Democratic Republic of Congo--2011 FDA Global Electoral Audit Report Foundation for Democratic Advancement
 
Municipal Administrative Data for Statistical Purposes
Municipal Administrative Data for Statistical PurposesMunicipal Administrative Data for Statistical Purposes
Municipal Administrative Data for Statistical Purposeswww.pablomoscoso.com
 

What's hot (20)

Spain--2011 FDA Global Electoral Fairness Audit Report
Spain--2011 FDA Global Electoral Fairness Audit ReportSpain--2011 FDA Global Electoral Fairness Audit Report
Spain--2011 FDA Global Electoral Fairness Audit Report
 
Election Day 2013 and its Aftermath
Election Day 2013 and its AftermathElection Day 2013 and its Aftermath
Election Day 2013 and its Aftermath
 
The Register of Voters : - Where we are one week ahead of Election Day
The Register of Voters : - Where we are one week ahead of Election DayThe Register of Voters : - Where we are one week ahead of Election Day
The Register of Voters : - Where we are one week ahead of Election Day
 
United States--2012 FDA Global Electoral Fairness Audit Report (Revised April...
United States--2012 FDA Global Electoral Fairness Audit Report (Revised April...United States--2012 FDA Global Electoral Fairness Audit Report (Revised April...
United States--2012 FDA Global Electoral Fairness Audit Report (Revised April...
 
France--2011 FDA Global Electoral Fairness Audit Report
France--2011 FDA Global Electoral Fairness Audit ReportFrance--2011 FDA Global Electoral Fairness Audit Report
France--2011 FDA Global Electoral Fairness Audit Report
 
Bolivia--2011 FDA Global Electoral Fairness Audit Report
Bolivia--2011 FDA Global Electoral Fairness Audit ReportBolivia--2011 FDA Global Electoral Fairness Audit Report
Bolivia--2011 FDA Global Electoral Fairness Audit Report
 
121098
121098121098
121098
 
Canada--2011 FDA Global Electoral Fairness Audit Report
Canada--2011 FDA Global Electoral Fairness Audit ReportCanada--2011 FDA Global Electoral Fairness Audit Report
Canada--2011 FDA Global Electoral Fairness Audit Report
 
Our Money in Politics: Version 3.0
Our Money in Politics: Version 3.0Our Money in Politics: Version 3.0
Our Money in Politics: Version 3.0
 
Mapping Report. State Electronic Information resourses
Mapping Report. State Electronic Information resoursesMapping Report. State Electronic Information resourses
Mapping Report. State Electronic Information resourses
 
Mapping Report «State Electronic Information Resources. Status and Perspectives»
Mapping Report «State Electronic Information Resources. Status and Perspectives»Mapping Report «State Electronic Information Resources. Status and Perspectives»
Mapping Report «State Electronic Information Resources. Status and Perspectives»
 
Zimbabwe 2018 biometric voters roll analysis - Pachedu
Zimbabwe 2018 biometric voters roll analysis - PacheduZimbabwe 2018 biometric voters roll analysis - Pachedu
Zimbabwe 2018 biometric voters roll analysis - Pachedu
 
FHWA-ICT-15-004
FHWA-ICT-15-004FHWA-ICT-15-004
FHWA-ICT-15-004
 
THE EFFECT OF COMPETENCE OF HUMAN RESOURCES, INFORMATION TECHNOLOGY AND ACCOU...
THE EFFECT OF COMPETENCE OF HUMAN RESOURCES, INFORMATION TECHNOLOGY AND ACCOU...THE EFFECT OF COMPETENCE OF HUMAN RESOURCES, INFORMATION TECHNOLOGY AND ACCOU...
THE EFFECT OF COMPETENCE OF HUMAN RESOURCES, INFORMATION TECHNOLOGY AND ACCOU...
 
2008 election in mongolia
2008 election in mongolia2008 election in mongolia
2008 election in mongolia
 
Newsletter of the CPLR No8 (May 2018)
Newsletter of the CPLR No8 (May 2018)Newsletter of the CPLR No8 (May 2018)
Newsletter of the CPLR No8 (May 2018)
 
FDA Public Forum on Alberta Democracy Reform
FDA Public Forum on Alberta Democracy ReformFDA Public Forum on Alberta Democracy Reform
FDA Public Forum on Alberta Democracy Reform
 
Democratic Republic of Congo--2011 FDA Global Electoral Audit Report
Democratic Republic of Congo--2011 FDA Global Electoral Audit Report Democratic Republic of Congo--2011 FDA Global Electoral Audit Report
Democratic Republic of Congo--2011 FDA Global Electoral Audit Report
 
ICRG - China
ICRG - ChinaICRG - China
ICRG - China
 
Municipal Administrative Data for Statistical Purposes
Municipal Administrative Data for Statistical PurposesMunicipal Administrative Data for Statistical Purposes
Municipal Administrative Data for Statistical Purposes
 

Viewers also liked

QAPCO best Employee_Taha_2014
QAPCO best Employee_Taha_2014QAPCO best Employee_Taha_2014
QAPCO best Employee_Taha_2014Mohamed Taha
 
3698 7525-1-pb
3698 7525-1-pb3698 7525-1-pb
3698 7525-1-pbjcrbsa
 
Simplicidade
SimplicidadeSimplicidade
Simplicidadeleletinha
 
DieDefa(onepager HGK)(2)
DieDefa(onepager HGK)(2)DieDefa(onepager HGK)(2)
DieDefa(onepager HGK)(2)Marina Malash
 
A4 Club Business Poster
A4 Club Business PosterA4 Club Business Poster
A4 Club Business PosterJordan Neville
 
Amit Adhikari- Risk Assessment Certificate
Amit Adhikari- Risk Assessment CertificateAmit Adhikari- Risk Assessment Certificate
Amit Adhikari- Risk Assessment CertificateAmit Adhikari
 
CV_Isaia Monathisa - Copy (2)
CV_Isaia Monathisa - Copy (2)CV_Isaia Monathisa - Copy (2)
CV_Isaia Monathisa - Copy (2)Isaia Monathisa
 
Carol cavalaris-muestra-de-arte-milespowerpoints.com aproveitarpara-mim
Carol cavalaris-muestra-de-arte-milespowerpoints.com aproveitarpara-mimCarol cavalaris-muestra-de-arte-milespowerpoints.com aproveitarpara-mim
Carol cavalaris-muestra-de-arte-milespowerpoints.com aproveitarpara-mimcarlos2627
 
Infographic: O poder do Facebook Brasil - Sept 2012
Infographic: O poder do Facebook Brasil - Sept 2012Infographic: O poder do Facebook Brasil - Sept 2012
Infographic: O poder do Facebook Brasil - Sept 2012Brian Crotty
 
Mas informacion del correo elect
Mas informacion del correo electMas informacion del correo elect
Mas informacion del correo electuned
 

Viewers also liked (20)

Imagenes graciosas
Imagenes graciosasImagenes graciosas
Imagenes graciosas
 
Aquecimento global
Aquecimento globalAquecimento global
Aquecimento global
 
QAPCO best Employee_Taha_2014
QAPCO best Employee_Taha_2014QAPCO best Employee_Taha_2014
QAPCO best Employee_Taha_2014
 
3698 7525-1-pb
3698 7525-1-pb3698 7525-1-pb
3698 7525-1-pb
 
JC's-AppreciationCertificate
JC's-AppreciationCertificateJC's-AppreciationCertificate
JC's-AppreciationCertificate
 
taba exp.
taba exp.taba exp.
taba exp.
 
Simplicidade
SimplicidadeSimplicidade
Simplicidade
 
DieDefa(onepager HGK)(2)
DieDefa(onepager HGK)(2)DieDefa(onepager HGK)(2)
DieDefa(onepager HGK)(2)
 
A4 Club Business Poster
A4 Club Business PosterA4 Club Business Poster
A4 Club Business Poster
 
SCAN BCTC
SCAN BCTCSCAN BCTC
SCAN BCTC
 
education certificate
education certificateeducation certificate
education certificate
 
Certificate Master
Certificate MasterCertificate Master
Certificate Master
 
Amit Adhikari- Risk Assessment Certificate
Amit Adhikari- Risk Assessment CertificateAmit Adhikari- Risk Assessment Certificate
Amit Adhikari- Risk Assessment Certificate
 
CV_Isaia Monathisa - Copy (2)
CV_Isaia Monathisa - Copy (2)CV_Isaia Monathisa - Copy (2)
CV_Isaia Monathisa - Copy (2)
 
Sillas seguridad
Sillas seguridadSillas seguridad
Sillas seguridad
 
Doc1
Doc1Doc1
Doc1
 
New Doc 17_1
New Doc 17_1New Doc 17_1
New Doc 17_1
 
Carol cavalaris-muestra-de-arte-milespowerpoints.com aproveitarpara-mim
Carol cavalaris-muestra-de-arte-milespowerpoints.com aproveitarpara-mimCarol cavalaris-muestra-de-arte-milespowerpoints.com aproveitarpara-mim
Carol cavalaris-muestra-de-arte-milespowerpoints.com aproveitarpara-mim
 
Infographic: O poder do Facebook Brasil - Sept 2012
Infographic: O poder do Facebook Brasil - Sept 2012Infographic: O poder do Facebook Brasil - Sept 2012
Infographic: O poder do Facebook Brasil - Sept 2012
 
Mas informacion del correo elect
Mas informacion del correo electMas informacion del correo elect
Mas informacion del correo elect
 

Similar to 06P-11 use of graduation data

Public Education Audit
Public Education AuditPublic Education Audit
Public Education AuditCharlie Fuller
 
The 2016 and 2017 Surveys of Consumer Payment Choice: Summary Results
The 2016 and 2017 Surveys of Consumer Payment Choice: Summary ResultsThe 2016 and 2017 Surveys of Consumer Payment Choice: Summary Results
The 2016 and 2017 Surveys of Consumer Payment Choice: Summary ResultsCoach Market
 
Educator Preparation Program Report
Educator Preparation Program ReportEducator Preparation Program Report
Educator Preparation Program ReportEducationNC
 
Quality assurance in official statistics
Quality assurance in official statisticsQuality assurance in official statistics
Quality assurance in official statisticsSrikalaChitti
 
DESASTER PLAN
DESASTER PLANDESASTER PLAN
DESASTER PLANomps
 
Examining the Implementation of Justice Reinvestment in Multnomah County
Examining the Implementation of Justice Reinvestment in Multnomah CountyExamining the Implementation of Justice Reinvestment in Multnomah County
Examining the Implementation of Justice Reinvestment in Multnomah CountyAmanda Lamb
 
The Statistical Data Set Taken From The 2012 General...
The Statistical Data Set Taken From The 2012 General...The Statistical Data Set Taken From The 2012 General...
The Statistical Data Set Taken From The 2012 General...Michelle Singh
 
Us census bureau
Us census bureauUs census bureau
Us census bureauaddiskeven
 
Georgia Annual state IT report 2016
Georgia Annual state IT report 2016Georgia Annual state IT report 2016
Georgia Annual state IT report 2016State of Georgia
 
IDTC Final Report
IDTC Final ReportIDTC Final Report
IDTC Final ReportJon Heining
 
An Analysis of the Adaptation of Electronic new Government Accounting System ...
An Analysis of the Adaptation of Electronic new Government Accounting System ...An Analysis of the Adaptation of Electronic new Government Accounting System ...
An Analysis of the Adaptation of Electronic new Government Accounting System ...IJAEMSJORNAL
 
Financial management modernization at the usda positively impacts mission
Financial management modernization at the usda positively impacts missionFinancial management modernization at the usda positively impacts mission
Financial management modernization at the usda positively impacts missioncathylums
 
ePollbook.Capstone.2015
ePollbook.Capstone.2015ePollbook.Capstone.2015
ePollbook.Capstone.2015Letian Zheng
 
1. Match the type of committee with a function or trait1. These .docx
1. Match the type of committee with a function or trait1. These .docx1. Match the type of committee with a function or trait1. These .docx
1. Match the type of committee with a function or trait1. These .docxjackiewalcutt
 
Pilot Study 2 on Processes for Determining the Accuracy of Credit Bureau Info...
Pilot Study 2 on Processes for Determining the Accuracy of Credit Bureau Info...Pilot Study 2 on Processes for Determining the Accuracy of Credit Bureau Info...
Pilot Study 2 on Processes for Determining the Accuracy of Credit Bureau Info...Luigi Wewege
 
10.11770899764004272195Jalandoni et al.Government Funding and.docx
10.11770899764004272195Jalandoni et al.Government Funding and.docx10.11770899764004272195Jalandoni et al.Government Funding and.docx
10.11770899764004272195Jalandoni et al.Government Funding and.docxhyacinthshackley2629
 
Fuller, Charlie_Performance Audit_Adult Felony Drug Courts
Fuller, Charlie_Performance Audit_Adult Felony Drug CourtsFuller, Charlie_Performance Audit_Adult Felony Drug Courts
Fuller, Charlie_Performance Audit_Adult Felony Drug CourtsCharlie Fuller
 
Data Quality Assessment Pilot Highlights Focus on Improving HMIS Data Quality...
Data Quality Assessment Pilot Highlights Focus on Improving HMIS Data Quality...Data Quality Assessment Pilot Highlights Focus on Improving HMIS Data Quality...
Data Quality Assessment Pilot Highlights Focus on Improving HMIS Data Quality...HFG Project
 

Similar to 06P-11 use of graduation data (20)

Public Education Audit
Public Education AuditPublic Education Audit
Public Education Audit
 
The 2016 and 2017 Surveys of Consumer Payment Choice: Summary Results
The 2016 and 2017 Surveys of Consumer Payment Choice: Summary ResultsThe 2016 and 2017 Surveys of Consumer Payment Choice: Summary Results
The 2016 and 2017 Surveys of Consumer Payment Choice: Summary Results
 
Educator Preparation Program Report
Educator Preparation Program ReportEducator Preparation Program Report
Educator Preparation Program Report
 
Quality assurance in official statistics
Quality assurance in official statisticsQuality assurance in official statistics
Quality assurance in official statistics
 
DESASTER PLAN
DESASTER PLANDESASTER PLAN
DESASTER PLAN
 
cornell-policy-review1
cornell-policy-review1cornell-policy-review1
cornell-policy-review1
 
Examining the Implementation of Justice Reinvestment in Multnomah County
Examining the Implementation of Justice Reinvestment in Multnomah CountyExamining the Implementation of Justice Reinvestment in Multnomah County
Examining the Implementation of Justice Reinvestment in Multnomah County
 
The Statistical Data Set Taken From The 2012 General...
The Statistical Data Set Taken From The 2012 General...The Statistical Data Set Taken From The 2012 General...
The Statistical Data Set Taken From The 2012 General...
 
Us census bureau
Us census bureauUs census bureau
Us census bureau
 
Georgia Annual state IT report 2016
Georgia Annual state IT report 2016Georgia Annual state IT report 2016
Georgia Annual state IT report 2016
 
IDTC Final Report
IDTC Final ReportIDTC Final Report
IDTC Final Report
 
An Analysis of the Adaptation of Electronic new Government Accounting System ...
An Analysis of the Adaptation of Electronic new Government Accounting System ...An Analysis of the Adaptation of Electronic new Government Accounting System ...
An Analysis of the Adaptation of Electronic new Government Accounting System ...
 
Financial management modernization at the usda positively impacts mission
Financial management modernization at the usda positively impacts missionFinancial management modernization at the usda positively impacts mission
Financial management modernization at the usda positively impacts mission
 
ePollbook.Capstone.2015
ePollbook.Capstone.2015ePollbook.Capstone.2015
ePollbook.Capstone.2015
 
1. Match the type of committee with a function or trait1. These .docx
1. Match the type of committee with a function or trait1. These .docx1. Match the type of committee with a function or trait1. These .docx
1. Match the type of committee with a function or trait1. These .docx
 
Pilot Study 2 on Processes for Determining the Accuracy of Credit Bureau Info...
Pilot Study 2 on Processes for Determining the Accuracy of Credit Bureau Info...Pilot Study 2 on Processes for Determining the Accuracy of Credit Bureau Info...
Pilot Study 2 on Processes for Determining the Accuracy of Credit Bureau Info...
 
10.11770899764004272195Jalandoni et al.Government Funding and.docx
10.11770899764004272195Jalandoni et al.Government Funding and.docx10.11770899764004272195Jalandoni et al.Government Funding and.docx
10.11770899764004272195Jalandoni et al.Government Funding and.docx
 
TAI: Trends in performance management
TAI: Trends in performance managementTAI: Trends in performance management
TAI: Trends in performance management
 
Fuller, Charlie_Performance Audit_Adult Felony Drug Courts
Fuller, Charlie_Performance Audit_Adult Felony Drug CourtsFuller, Charlie_Performance Audit_Adult Felony Drug Courts
Fuller, Charlie_Performance Audit_Adult Felony Drug Courts
 
Data Quality Assessment Pilot Highlights Focus on Improving HMIS Data Quality...
Data Quality Assessment Pilot Highlights Focus on Improving HMIS Data Quality...Data Quality Assessment Pilot Highlights Focus on Improving HMIS Data Quality...
Data Quality Assessment Pilot Highlights Focus on Improving HMIS Data Quality...
 

06P-11 use of graduation data

  • 1. Legislative Audit Division State of Montana Report to the Legislature June 2006 Performance Audit The Collection and Use of Graduate and Dropout Data Office of Public Instruction This performance audit provides the Legislature information about the collection and use of graduate and dropout data. To ensure data is consistent among schools for reporting and decision-making, this report makes recommendations for implementing controls as well as a means to utilize the data. A written response from the Office of Public Instruction is included at the end of the report. Direct comments/inquiries to: Legislative Audit Division Room 160, State Capitol PO Box 201705 06P-11 Helena MT 59620-1705 Help eliminate fraud, waste, and abuse in state government. Call the Fraud Hotline at 1-800-222-4446 statewide or 444-4446 in Helena.
  • 2. PERFORMANCE AUDITS Performance audits conducted by the Legislative Audit Division are designed to assess state government operations. From the audit work, a determination is made as to whether agencies and programs are accomplishing their purposes, and whether they can do so with greater efficiency and economy. The audit work is conducted in accordance with audit standards set forth by the United States Government Accountability Office. Members of the performance audit staff hold degrees in disciplines appropriate to the audit process. Areas of expertise include business and public administration, mathematics, statistics, economics, political science, criminal justice, computer science, education, and biology. Performance audits are performed at the request of the Legislative Audit Committee which is a bicameral and bipartisan standing committee of the Montana Legislature. The committee consists of six members of the Senate and six members of the House of Representatives. MEMBERS OF THE LEGISLATIVE AUDIT COMMITTEE Senator Joe Balyeat, Vice Chair Representative Dee Brown Senator John Brueggeman Representative Hal Jacobson Senator Jim Elliott Representative Christine Kaufmann Senator Dan Harrington Representative Scott Mendenhall Senator Lynda Moss Representative John Musgrove, Chair Senator Corey Stapleton Representative Janna Taylor
  • 3. LEGISLATIVE AUDIT DIVISION Scott A. Seacat, Legislative Auditor Deputy Legislative Auditors: Tori Hunthausen, James Gillett Chief Deputy Legislative Auditor Jim Pellegrini Room 160, State Capitol Building, PO Box 201705, Helena, MT 59620-1705 Phone (406) 444-3122 FAX (406) 444-9784 E-Mail lad@mt.gov June 2006 The Legislative Audit Committee of the Montana State Legislature: This performance audit provides the Legislature information about the collection and use of graduation and dropout data. To ensure data is consistent among schools for reporting and decision-making, this report makes recommendations for implementing controls as well as a means to utilize the data. A written response from the Office of Public Instruction is included at the end of the report. We wish to express our appreciation to the Office of Public Instruction staff and local schools for their cooperation and assistance during the audit. Respectfully submitted, /s/ Scott A. Seacat Scott A. Seacat Legislative Auditor
  • 4. Legislative Audit Division Performance Audit The Collection and Use of Graduate and Dropout Data Office of Public Instruction Members of the audit staff involved in this audit were Bridget Butler and Angie Grove.
  • 5. Table of Contents List of Figures and Tables ........................................................................ii Elected, Appointed and Administrative Officials....................................iii Report Summary....................................................................................S-1 Chapter I – Introduction and Background............................................................................................... 1 Introduction............................................................................................... 1 Audit Scope and Objectives ................................................................ 1 Background............................................................................................... 2 State Requirements.............................................................................. 2 Federal Requirements.......................................................................... 2 Calculations of Graduate Data............................................................. 3 Calculations of Dropout Data.............................................................. 5 National Attention ............................................................................... 7 Report Organization.................................................................................. 8 Chapter II – OPI Guidelines...................................................................................................................... 9 OPI Guidelines for Reporting................................................................... 9 School Visits........................................................................................... 10 Data Verification ............................................................................... 11 Examples of Inconsistency ................................................................ 11 Guidelines Not Fully Utilized............................................................ 12 A Quality Assurance System Needed................................................ 12 Conclusion......................................................................................... 13 Documentation Needed for District Approved GEDs and Home School Students ...................................................................................... 13 Home School Students....................................................................... 13 District Approved GED Recipients ................................................... 14 Chapter III - OPI's Plan For Improving Data Collection and Accuracy ............................................ 15 Initial Planning........................................................................................ 15 Resources Appropriated .................................................................... 15 Current Stage of Implementation............................................................ 15 The New System................................................................................ 16 Majority of States Have a Statewide Information Management System..................................................................................................... 17 Impacts of the New System .................................................................... 18 Human Element Still Exists............................................................... 18 Chapter IV – Use of Data ......................................................................................................................... 19 Data is Integral to Decision-Making....................................................... 19 National Use of Data for Economic Analysis.................................... 19 Stakeholders' Use of Data.................................................................. 20 Accessibility and Use of Data................................................................. 21 Conclusion......................................................................................... 22 Appendix – A............................................................................................................................................A-1 Agency Response......................................................................................................................................B-1 Page i
  • 6. List of Figures and Tables Page ii Figures Figure 1 Economic Benefits of Education in Montana................................... 20 Tables Table 1 National Methods for Calculating Graduation Rates ......................... 4 Table 2 Methods for Calculating Dropout Rates............................................. 6 Table 3 Student Status Definitions................................................................ 10
  • 7. Elected, Appointed and Administrative Officials Page iii Office of Public Instruction Linda McCulloch, Superintendent Dennis “Bud” Williams, Deputy Superintendent Nancy Coopersmith, Assistant Superintendent Madalyn Quinlan, Chief of Staff Donna O’Neill, Division Administrator, Measurement and Accountability Division
  • 9. Report Summary The Legislative Audit Committee prioritized a performance audit of Montana high school graduate and dropout rates to examine the requirements associated with the calculations and their use. The overall intent was to determine the effect and cause of any deviations from established requirements. The scope of this audit focused on three main activities: the current process of compiling data on graduate and dropout students, how the implementation of a new student information management system affects the process, and how graduate and dropout data is used. Background Although supervision and control of schools is dispersed among different entities, the Superintendent of Public Instruction administers the majority of services to students and teachers in over 400 school districts, as well as compiles data from schools. Based on both state and federal requirements, the Office of Public Instruction (OPI)’s Division of Measurement and Accountability obtains data on student graduate and dropout numbers in the annual data collection, which schools/districts submit each fall. Federal Requirements The federal No Child Left Behind Act (NCLB) (PL 107-110), enacted in 2002, holds states and the schools under their jurisdictions accountable for student performance. While student achievement must be the principal indicator of performance under NCLB, statewide accountability systems are also required to incorporate one additional academic outcome. At the secondary level, this “other academic indicator” is required by NCLB to be the high school graduate rate. States are required to set goals for themselves, and then each school and district is to meet these goals through various performance indicators. Calculations of Graduate Data Although NCLB requires states to submit graduate data, it does not mandate how it is collected or calculated. The National Center for Education Statistics (NCES) suggests states use a Leaver-Based Graduation Rate. This definition follows groups of students throughout their four years of high school to calculate a graduation rate. Montana, along with 31 other states, currently uses this definition. Page S-1
  • 10. Report Summary NCLB does not require states to directly report dropout rates. However, the annual number of dropouts is needed to calculate the graduation rate submitted annually to the federal government. Montana collects dropout data from schools for local and state analysis as well. An annual dropout rate is used in Montana. This rate is established by dividing the annual enrollment by the number of dropouts in a given year. The NCES recommends this method for calculating dropout rates. It produces the lowest rate of any method since it is only a snapshot of one year. Calculations of Dropout Data School Visits To assure accuracy and consistency between schools, OPI has established the Montana High School Completer and Dropout Data Collection Handbook. This handbook instructs schools on how to collect/input data to OPI for graduates and dropouts, as well as provides information on calculating dropout and graduation rates. To determine if these guidelines are followed we visited 14 schools around the state to observe and interview school personnel on how they use the OPI handbook and apply student status coding procedures. We compared OPI data to documentation maintained by the schools on the number of reported student graduates, dropouts and completers. In all 14 schools visited, 100 percent of the data reviewed at the schools was consistent to that reported by OPI. Examples of Inconsistency We found inconsistencies in the manner in which status codes were applied to students. During our visits we inquired how a student would be coded in different scenarios; what constitutes a graduate, completer, and dropout. The responses we received indicated schools have different interpretations on how and when to apply OPI student status codes as defined in guidelines. In 9 out of 14 schools visited, we found inconsistencies in the application of student status codes. For example, some schools categorize a student passing a General Education Development (GED) test as a completer, regardless of the administering entity. OPI, in accordance with NCLB, requires students to pass a GED test through a program administered by the school district in order to be coded as a completer. In most Montana districts, this is usually done through an alternative school within the district. A student who passes a GED Page S-2
  • 11. Report Summary test through another entity other than the school district should be coded a dropout, according to OPI guidelines. Quality Assurance System Needed The National Center for Educational Accountability suggests, in addition to establishing a statewide coding system for student status, it is important to provide training on how those codes should be applied. OPI does not provide on-site technical assistance for Montana schools. There are no on-site visits to assist applicable school personnel in interpreting coding requirements or communicating guideline changes/updates. Documentation Needed for District Approved GEDs and Home School Students There are some limitations to OPI guidelines. OPI guidelines do not require verification of home school students and GED test recipients from the district. Although OPI’s handbook states a home-schooled student or a GED test recipient within the district is not a dropout, audit work showed variation on the level of confirmation schools require for a student in these categories. In order for data to be accurate, OPI must be able to distinguish between students who drop out, get a GED, or who transfer to another school or home school situation. Montana school districts already require documentation of transcripts for students transferring among other public schools; the same standard could apply to the documentation of home schooling or the entity that issued a GED test to a student. OPI's Plan For Improving Data Collection and Accuracy OPI began exploring the creation of a comprehensive educational reporting system in 2003. The goal was to develop an infrastructure for the educational community to gather school data via the Internet, manage the secure storage of the data, and make the data accessible to decision makers throughout the educational community. In 2004, OPI contracted with an independent consultant to survey schools on the data currently collected and the systems they use to manage data, as well as write a concept and implementation plan for a student record system. One of the most important findings of the consultant’s survey was that the majority of respondent districts were more than ready to see OPI move forward and initiate data improvements. Page S-3
  • 12. Report Summary Resources Appropriated In 2005, OPI requested funds to implement the student information management system. The legislature appropriated $2.8 million for the purpose of a new statewide K-12 education data system and approved four full time staff. Most recently, OPI assembled an evaluation team. They met on regular occasions, discussing and conducting research on similar systems and, eventually, discussing the request for proposal (RFP) for the creation and implementation of the new system. The New System According to planning documents, the RFP, and interviews with OPI personnel, the new system will have three main components: Student information, including student identifier and data elements, Special education data, An electronic data warehouse. OPI will begin initial implementation in the fall of 2006 by assigning a student identifier to each student enrolled in public school, K-12. OPI will still collect data on the number of graduates and dropouts, but with the student identification component it will be possible to roll up the data and look at overall numbers or drill down to see the status of one particular student. Human Element Still Exists The implementation of the new student information system will improve OPI’s current data collection and compilation system in various ways, but individuals will still decide on which status code to enter for a student. If individuals are not using student status codes consistently among schools, the new student information system will not provide comparable data. Data is Integral to Decision-Making Educational stakeholders in Montana agree graduate and dropout data is an integral piece of information, specifically at the state level. They consider it to be an important tool in efficient decision-making and public reporting. Educational stakeholders believe the public has a right to know the number of students graduating and have access to that data. During audit work, one stakeholder discussed the importance of looking at the bigger picture and the economic Page S-4
  • 13. Report Summary impacts of education. The importance of paying attention to students who are at risk of dropping out was highlighted. The number of individuals in prison and on social welfare without a degree is high. Stakeholders indicated the expense on the back end of “at-risk” kids is much more than if efforts would focus on the problem while they are in school. Accessibility and Use of Data The OPI Division of Measurement and Accountability, which collects, compiles, and analyzes graduate and dropout data, shares data with various programs within OPI and presents annually to the Board of Public Education. Some annual reports are posted to OPI’s website as well. Audit work found no formal plan for educational stakeholders and the public to access and analyze data stored in the new system. The RFP does request the system have an interactive querying tool to enable data driven decision-making by state-level education staff and policy makers. Section 10.55.603, ARM, states the assessment of educational programs and their effectiveness should be examined through assessment results as well as graduate and dropout numbers. In order to examine graduate and dropout numbers for program effectiveness, statewide data needs to be accessible. A more comprehensive system that provides various means to access data would be more effective. Page S-5
  • 14. Chapter I – Introduction and Background Introduction The Legislative Audit Committee prioritized a performance audit of Montana high school graduate and dropout rates to examine the requirements associated with the calculations and their use. The overall intent was to determine the effect and cause of any deviations from established requirements. For the 2004-2005 school year, the Office of Public Instruction (OPI) reported an 84.8 percent graduation rate and a 3.4 percent dropout rate. Audit work shows inconsistent procedures are used to categorize students at schools. Audit Scope and Objectives The scope of this audit focused on three main activities: the current process of compiling data on graduate and dropout students, how the implementation of a new student information management system affects the process, and how graduate and dropout data is used. Audit scope concentrated on graduate and dropout numbers in Montana high schools (grades 9-12) for the school year 2004-2005. Based on this scope, we established four main objectives: 1. Determine if guidelines and definitions provided by OPI are designed to create consistent, accurate data on high school graduates and dropouts. 2. Determine if schools follow guidelines and definitions for reporting graduates and dropouts in a consistent manner. 3. Determine if the new student information management system will provide comparable and uniform information on graduates and dropouts among Montana public schools. 4. Determine if data on high school graduates and dropouts is used by educational stakeholders for the purpose of making informed decisions. These objectives were addressed through the following methodologies: Review of national educational policy centers’ literature on graduate and dropout data. Review of state and federal laws applicable to the collection of graduate and dropout numbers. Review of legislative/agency documents and work completed to date on the new student information system. Page 1
  • 15. Chapter I – Introduction and Background Visits to 14 high schools to interview school personnel, observe data collection, and verify aggregate data from OPI. Review of other states’ student information systems. Interviews with educational stakeholders (education associations, schools, and Board of Public Education) on the use and importance of graduate and dropout data. Background State law separates responsibilities of the public school system among three entities. The Montana Constitution provides the Board of Public Education (BPE) with responsibility for long range planning, and coordination and evaluation of policies and programs of the public school system. Article X, Section 8, of the Montana Constitution vests the supervision and control of the schools in each district to an elected local board of trustees. Section 20-3-106, MCA, provides the Superintendent of Public Instruction with general supervision of public schools and districts of the state. Although supervision and control of schools is dispersed among different entities, the Superintendent of Public Instruction, administers the majority of services to students and teachers in over 400 school districts, as well as compiles data from schools. Based on both state and federal requirements, OPI’s Division of Measurement and Accountability obtains data on student dropout and graduate numbers in the annual data collection (ADC), which schools/districts submit each fall. State Requirements Section 10-55-603, ARM, established by the BPE, requires schools to “examine program effectiveness through graduation and dropout rates…” As a means to implement this rule, schools construct a five- year Comprehensive Education Plan which outlines goals for continuous educational improvements. Each district reports on its progress toward these goals annually in the ADC. Federal Requirements The federal No Child Left Behind Act (NCLB) (PL 107-110), enacted in 2002, holds states and the schools under their jurisdictions accountable for student performance. While student achievement must be the principal indicator of performance under NCLB, statewide accountability systems are also required to incorporate one additional academic outcome. At the secondary level, this “other Page 2
  • 16. Chapter I – Introduction and Background academic indicator” is required by NCLB to be the high school graduation rate. States are required to set goals for themselves, and then each school and district is to meet these goals through various performance indicators. If a school does not meet the set graduation rate requirement, the district can incur fiscal sanctions under NCLB. Title I of NCLB provides funds to help improve instruction in high poverty schools and ensure poor and minority students have the same opportunity as other students to meet academic standards. Schools that consistently fail to meet these NCLB accountability requirements may be required to use Title I monies to fund supplemental education services, pay transportation costs for a student to attend another school within their district, and/or develop a restructuring plan. Calculations of Graduate Data Although NCLB requires states to submit graduate data, it does not mandate how it is collected or calculated. The National Center for Education Statistics (NCES) suggests states use a Leaver-Based Graduation Rate. This definition follows groups of students throughout their four years of high school to calculate a graduation rate. Montana, along with 31 other states, currently uses this definition. Other common graduation rates used nationally are detailed in Table 1. Page 3
  • 17. Chapter I – Introduction and Background Table 1 National Methods for Calculating Graduation Rates Rate Methodology Considerations Leaver-Based Graduation Rate Calculated by dividing number of high school diploma recipients by number of students known to leave school by dropping out, graduating or otherwise completing high school. Requires dropout data from four consecutive academic years, as well as number of graduates for the latest year Relies on accuracy of dropout data Does not use enrollment Enrollment-Based Cumulative Promotion Index This method assumes graduation is a process of three grade-to-grade transitions (9 to 10, 10 to 11, and 11 to 12). Each transition is calculated as a probability by dividing the enrollment of the later year by the enrollment of the previous year. These separate probabilities are then multiplied to produce the probability that a student will graduate. Requires enrollment data from two consecutive academic years, as well as number of graduates for the latest year Requires calculation of district-level rates to determine the state rate Does not use dropout data Enrollment-Based Cohort Graduation Rate Calculated by dividing the number of students who receive a regular high school diploma by the number of students enrolled in ninth grade four years earlier. Requires enrollment data from five consecutive academic years, as well as number of graduates for the latest year Requires census population data Does not use dropout data Source: Data compiled by Standard and Poor’s School Evaluation Services. Page 4
  • 18. Chapter I – Introduction and Background Calculations of Dropout Data NCLB does not require states to directly report dropout rates. However, the annual number of dropouts is needed to calculate the graduation rate submitted annually to the federal government. Montana collects dropout data from schools for local and state analysis as well. An annual dropout rate is used in Montana. This rate is established by dividing the number of dropouts by the number enrolled in a given year. The NCES recommends this method for calculating dropout rates. It produces the lowest rate of any method since it is only a snapshot of one year. There are three main methods used by states to calculate dropout rates. Page 5
  • 19. Chapter I – Introduction and Background Table 2 Methods for Calculating Dropout Rates Annual Dropout Rate Longitudinal Dropout Rate Attrition Rate Description Measures the percentage of students who drop out of school during one year. Measures the percentage of students from a class of 9th graders who drop out before completing high school. Estimates the percentage of students from a class of 9th graders not enrolled in grade 12 four years later for whatever reason. Calculation Divide the number of students who drop out during a school year by the total number enrolled that year. Divide the number of students who drop out by the end of grade 12, by the total number of students in the original 9th grade class. Students who transfer in or out over the years are added or subtracted. Subtract grade 12 enrollment from grade 9 enrollment four years prior then divide by the grade 9 enrollment. Advantages • Measures annual performance • Requires only one year of data • Can be calculated for any school or district with students in any of the grades covered • Can be disaggregated • More consistent with the publics’ understanding of a dropout rate • Districts have more time to encourage dropouts to return to school before being held accountable • Provides a simple measure of school leavers when aggregate enrollment numbers are all that is available Disadvantages • Produces the lowest rate of any method • May not correspond to the public’s understanding of a dropout rate • Requires multiple years of data • Does not produce a dropout rate by grade • Program improvements may not be reflected for several years • Produces the highest rate of any method • Does not distinguish attrition resulting from dropping out from that resulting from transfers, retentions, death, etc. School example (Grades 9-12) 2.2% 8.5% 36.6% Source: Compiled by the Legislative Audit Division. The table defines and discusses the advantages and disadvantages of each rate. The bottom row of the table depicts a dropout rate for the same school, same year, for each calculation. It shows the differences produced among the methods. Page 6
  • 20. Chapter I – Introduction and Background Recent national studies comparing state graduation rates found different methods produce different results and in some cases the disparities can be quite large. More specifically, national research suggests that approaches for calculating graduation rates based on dropout data produce inflated graduation estimates compared with other methods. This is due to the reliance on the accuracy of dropout data, and not using enrollment data as a basis but rather diploma recipients. Currently, state accountability plans submitted for NCLB, use graduation rates that incorporate dropout data in more than half of all states (including Montana). Changes and improvements in Montana’s methods are discussed in Chapters III and IV. National Attention The calculation of graduation and dropout rates has received national attention due to the high standards set by NCLB’s accountability requirements. Through audit work, various states have discovered inaccuracies in their calculation of graduates and dropouts. The following illustrates some examples: A Texas audit of 16 Houston schools found that more than half of the 5,500 students who left in the 2000-2001 school year should have been declared dropouts, but were not. That year, Houston schools reported that only 1.5 percent of its students dropped out. A 2001 Michigan audit of the educational accountability program found the education department did not have an effective process for gathering data, and that calculations used for graduate and dropout rates were not in accordance with state statutes. The national attention on misreporting of graduate and dropout numbers spurred educational policy groups, including a National Governors Association Task Force, to recommend the creation and establishment of better systems and methods of collecting, analyzing, and reporting graduate and dropout data, which includes looking at longitudinal data for both groups. The difficult part of this task is accurately accounting for students who do not finish, and distinguishing between those who should be counted as dropouts and those who should not. In order to calculate precise graduation rates, Page 7
  • 21. Chapter I – Introduction and Background states need integrated information systems that can tell if a student who stopped attending one high school shows up in another school. Report Organization The next chapter will outline how OPI currently collects and guides schools on graduate and dropout data. Chapter III details OPI’s current plans for improving data collection, and the last chapter discusses the importance of using dropout and graduate data for decision-making. Page 8
  • 22. Chapter II – OPI Guidelines Page 9 OPI Guidelines for Reporting The Office of Public Instruction (OPI) is required to submit Montana graduation rates annually to the federal government for No Child Left Behind (NCLB) requirements. To assure accuracy and consistency between schools, OPI has established the Montana High School Completer and Dropout Data Collection Handbook. These guidelines were developed in the early 1990’s, and are continually updated, taking language directly from the National Center on Education Statistics. These guidelines outline definitions for dropouts, graduates, completers, and no shows. This handbook instructs schools how to collect/input data to OPI for graduates and dropouts, as well as provides information on calculating dropout and graduation rates. OPI personnel calculate these percentages. Listed in the following table are brief definitions for the six OPI-defined categories of Montana student status.
  • 23. Chapter II – OPI Guidelines Table 3 Student Status Definitions Student Status Definition Graduate A student who completed the high school graduation requirements of a school district in four years or less, or had a special education plan allowing more than four years to graduate. Completer A student who passes a GED test through a program administered by the school district and/or a student who takes more than the standard number of years (4) to receive a high school diploma. No Show A student who was enrolled in school the previous year, but as of the fall collection date, the student has not shown up to school. The student should be counted as a dropout the following year if a transfer status is not confirmed. Dropout A student who was enrolled the previous year but quit school at some point and is not currently enrolled. Transfer A student who exits from one school to enroll in another. Home School A student who has left the public school system to be taught at home and is registered with the county superintendent as a home schooler. Source: Compiled by the Legislative Audit Division from agency records. In defining student status, the handbook provides a different example and perspective to illustrate each definition. According to the National Center for Educational Accountability (NCEA), one of ten essential elements in collecting quality data is having accurate student level dropout and graduate data. In an effort to do this, NCEA suggests establishing a statewide coding system for the various reasons students leave a school and clear guidelines on how those codes should be applied. OPI has established such a system for Montana. School Visits To determine if these guidelines are followed, we visited 14 schools around the state to observe and interview school personnel on how they use the OPI handbook and apply status coding procedures. The Page 10
  • 24. Chapter II – OPI Guidelines schools were chosen based on their average enrollment and dropout rate. Averages for both enrollment and dropout rates were calculated using three years of data (2001-2004). We divided Montana high schools into four groups – high, medium, low and zero percent dropout rates. Within the four groups, we chose schools based on enrollment size and dropout rate. A small, medium and large enrollment school was chosen within each of the four dropout groups. Data Verification We compared OPI data to documentation maintained by the schools on the number of reported student graduates, dropouts and completers. In all 14 schools visited, 100 percent of the data reviewed at the schools was consistent to that reported by OPI. Our review confirmed that the data in school information systems matched data input into OPI’s system. Examples of Inconsistency We found inconsistencies in the manner in which status codes were applied to students. During our visits we inquired how a student would be coded in different scenarios; what constitutes a graduate, completer, and dropout. The responses we received indicated schools have different interpretations on how and when to apply OPI defined status codes. In 9 out of 14 schools visited, we found inconsistencies in the application of student status codes. For example, some schools categorize a student passing a General Education Development (GED) test as a completer, regardless of the administering entity. OPI guidelines, in accordance with NCLB, require students to pass a GED test through a program administered by the school district in order to be coded as a completer. In most Montana districts, this is usually done through an alternative school within the district. A student who passes a GED test through another entity other than the school district should be coded a dropout, according to OPI guidelines. Another example is a student that attends Job Corps. Depending on the school, this type of student is coded in various ways; dropout, graduate, and completer. Job Corps is an education and vocational training program administered by the U.S. Department of Labor that Page 11
  • 25. Chapter II – OPI Guidelines serves young people ages 16 through 24. At Job Corps, students enroll to learn a trade, earn a high school diploma/GED, and get help finding a job. OPI’s guidelines are unclear in defining a status code for Job Corps students or when those students should be coded as a dropout versus a completer. Another variation found in schools was how a “no show” student is coded. A “no show” student is one who was enrolled either from eighth grade or in the previous year; however, when school begins in the fall, this student does not show up. Some schools are reporting this student as a dropout in the Annual Data Collection (ADC) the same year, while others are waiting until the following school year to report, in hopes of receiving more information on whether the student is a dropout or transfer. OPI guidelines allow a school to wait until the following year to report a “no show.” Our visits also found a school that only reports dropouts as those students who drop out of the twelfth grade, rather than grades 9-12, as required. Although ethnicity has no effect on dropout or graduation numbers, we found a school that coded students as White, non-Hispanic, even when that was not the student’s ethnicity. Guidelines Not Fully Utilized Although OPI’s dropout and graduate handbook provides detailed guidelines for student status codes, schools are using the guidelines on a limited basis. As part of our audit work, we interviewed officials responsible for tracking student status and reporting it to OPI. The staff person responsible for these duties varied by school and included either the secretary, principal, or data specialist. During interviews we asked if these officials found the handbook useful. Three of the 14 schools we visited found OPI guidelines for graduates and dropouts to be very useful. Eight schools use the guidelines to some degree and the other three do not use the guidelines at all. Therefore, a majority (11 of 14) of the schools are using the guidelines on a limited basis or not at all. A Quality Assurance System Needed NCEA suggests, in addition to establishing a statewide coding system for student status, it is important to provide training on how those codes should be applied. They also recommend each state Page 12
  • 26. Chapter II – OPI Guidelines have a system for occasionally spot-checking the accuracy of data in cases that are not flagged by statistical checks. Currently, OPI has not developed this level of quality assurance. For example, OPI does not provide on-site technical assistance for Montana schools to assist applicable school personnel in interpreting coding requirements or communicating guideline changes/updates. Conclusion OPI’s Montana High School Completer and Dropout Data Collection Handbook is an effort to create consistent and accurate data among schools. The handbook provides clear, detailed guidelines. However, when establishing policy (handbook) the issuing entity has a responsibility to ensure it is communicated and followed by the intended recipients (schools). Additional assurance could be provided through OPI staff conducting on-site audits of status code application, as well as providing technical assistance. Off-site assurances could include building on existing statistical checks in the database, as well as randomly calling to verify a student who has recently changed status. Recommendation #1 We recommend the Office of Public Instruction establish a quality assurance system that includes: A. On-site technical assistance training on status code procedures and requirements. B. Random verification of student status coding and data submitted. Documentation Needed for District Approved GEDs and Home School Students There are some limitations to OPI guidelines. OPI guidelines do not require verification of home school students and GED test recipients from the district. Although OPI’s handbook states a home-schooled student or a GED test recipient within the district is not a dropout, audit work showed variation on the level of confirmation schools require for a student in these categories. Home School Students Home school students in Montana are required to register with the County Superintendent of Schools. Some of our sample schools Page 13
  • 27. Chapter II – OPI Guidelines verify the student’s registration with the County Superintendent while other schools do not. OPI guidelines do not require schools to verify home school registration. During interviews with school personnel, concerns of schools misclassifying a student as a homeschooler arose. School personnel stated some other schools may be coding a dropout as a home school student in order to not negatively affect their school’s graduation and dropout rates. By not accurately coding a dropout, schools inflate their graduation rate and decrease their dropout rate. District Approved GED Recipients The level of confirmation varies on students who pass the GED test as well. As mentioned earlier, we found schools did not confirm whether a GED test was taken through a district-administered program. Audit work found some schools categorize a student completing a GED, even if outside the district (not district administered), as a completer. In one example a student passed a GED test through a private program after dropping out of school. School personnel became aware of the student’s GED achievement, and therefore coded the student’s status as a completer instead of a dropout. OPI requires students to receive a GED from a district-administered program, which is usually an alternative school within the district, in order to be counted as a completer. This requirement is consistent with NCLB law. In order for data to be accurate, OPI must be able to distinguish between students who drop out, get a GED, or who transfer to another school or home school situation. Montana school districts already require documentation of transcripts for students transferring among public schools; the same standard could apply to documentation of home schooling or the entity issuing a GED test to a student. Recommendation #2 We recommend OPI incorporate into its guidelines that schools verify and document home school registration and GED test information. Page 14
  • 28. Chapter III - OPI's Plan For Improving Data Collection and Accuracy Page 15 Initial Planning The Office of Public Information began exploring the creation of a comprehensive educational reporting system in 2003. The goal was to develop an infrastructure for the educational community to gather school data via the Internet, manage the secure storage of the data, and make the data accessible to decision makers throughout the educational community. In 2004, OPI contracted with an independent consultant to survey schools on the data currently collected and the systems they use to manage the data, as well as write a concept and implementation plan for a student information system. One important finding of the consultant’s survey was the majority of respondent districts were more than ready to see OPI move forward and initiate data improvements. Many districts indicated they were already collecting student level data and could provide such data to OPI in many of the areas surveyed. In the concept and implementation plan, the consultant emphasized the need for OPI to provide leadership, coordination and support for a statewide student information system. The plan states a comprehensive reporting system should be the primary source of educational information. The consultant’s work provided OPI with the feedback necessary to move forward on implementing the student information system. Resources Appropriated In 2005, OPI requested for funds to implement a student information system. The legislature appropriated $2.8 million for the purpose of a new statewide K-12 system and approved four full-time staff. The request for proposal (RFP) for the system went out with a cost estimate of $2 million, which leaves $800,000 for the new positions over the 2007 biennium. Positions being hired for this project are: database administrator, project manager, student records manager, and data resource administrator. Current Stage of Implementation Most recently, OPI assembled an evaluation team which was comprised of eight OPI staff members, as well as two school staff members with knowledge about information technology and special
  • 29. Chapter III - OPI's Plan For Improving Data Collection and Accuracy education. They met on regular occasions, discussing and conducting research on similar systems for the creation and implementation of the new system. Research consisted of important components to consider such as: An audit system to assess data quality, validity, and reliability. A unique identifier for each student in the system. Interoperability. Privacy protection. The New System OPI is currently in the process of contracting with a vendor to develop the new system. According to planning documents, the RFP, and interviews with OPI personnel, the new system will have three main components: Student information; including student identifier and data elements, Special education data, An electronic data warehouse. The student identification component will provide a unique identifier for each student entering the Montana public education system. This number will remain the student’s identifier until he/she exits the system. As well, it will provide information on each student such as gender, grade, etc. Currently, there is no way to track students throughout the public education system because OPI collects aggregate numbers, not information to identify or track an individual student through the education system. The second main component will provide information on the statewide system for special education students. All documents pertinent to the student will be accessed electronically through the student’s identification number. The third component of the new system will be an electronic data warehouse where all student/school level data will be stored annually. This data will be updated periodically as student Page 16
  • 30. Chapter III - OPI's Plan For Improving Data Collection and Accuracy information changes. Information can be accessed to conduct trend analysis by district or state personnel. OPI will begin initial implementation in the fall of 2006 by assigning a student identifier to each student enrolled in public schools, K-12. OPI will still collect data on the number of graduates and dropouts, but with the student identification component it will be possible to roll up the data and look at overall numbers or drill down to see the status of one particular student. Majority of States Have a Statewide Information Management System A student identifier and data warehouse system similar to what Montana is implementing exists in over half of the states. Thirty-two states and the District of Columbia already have such a system in place. Sixteen states, including Montana are currently developing a system. Only two states have not yet looked at developing such a system. The National Center for Educational Accountability (NCEA) recommends states institute a longitudinal data system which matches individual student records over time, from pre-kindergarten through twelfth grade and into post-secondary education. NCEA states, “That when states collect the most relevant data and are able to examine longitudinally, they can answer the questions that are at the core of educational effectiveness. States are spending hundreds of millions of dollars to improve student achievement. But without quality data, they are essentially flying blind.” Other states have various components to their statewide student information management systems; for example, teacher information, fiscal or budget information, and post-secondary information. Although OPI documents and interviews suggest a desire for these additional components, at this point, there is only funding allocated to implement the three components previously mentioned. Page 17
  • 31. Chapter III - OPI's Plan For Improving Data Collection and Accuracy Impacts of the New System The most obvious benefit from the graduate and dropout perspective is the ability to track or follow students within Montana public schools. Currently, one student could be coded as a dropout from two schools in the same year. If a student attends two schools and drops from both within one year, duplications in student coding occur. If a student transfers to another school, but the receiving school never requests transcripts, the student may be coded as a dropout rather than a transfer. The new system will help address these problems. No longer will OPI’s data be just disaggregated numbers; with the new system there will be a higher level of detail available. For example, stakeholders will be able to correlate certain factors such as the number of dropouts to students in advanced placement or special education classes statewide. Because there will be a data warehouse component to the system, longitudinal data or trend analysis will be possible. In addition, stakeholders believe a longitudinal rate for dropouts would be a better representation of the dropout rate for Montana. The implementation of the new student information system will improve OPI’s current data collection and compilation system in various ways, but individuals will still decide on which status code to enter for a student. If individuals are not using student status codes consistently among schools, the new student information system will not provide comparable data. The importance of this was stressed in Chapter II and addressed in Recommendation 1. The issue was also raised in various interviews with stakeholders. The subject of consistent, accurate data came up repeatedly. Stakeholders do not believe all schools are defining a dropout in the same manner. Our school visits reaffirm this statement. Consistency in the application of student status codes is essential to assure the validity and accuracy of the data. Page 18 Human Element Still Exists Conclusion: The statewide student information system will assist in providing quality, uniform data on graduates and dropouts. However, OPI’s data collection system will still largely depend on the consistent application of student status codes by school personnel.
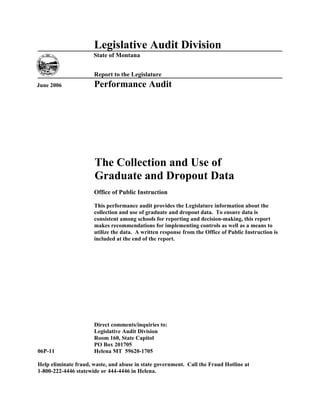
  • 32. Chapter IV – Use of Data Data is Integral to Decision-Making Educational stakeholders in Montana agree graduate and dropout data is an integral piece of information, specifically at the state level. They consider it to be an important tool in efficient decision-making and public reporting. Educational stakeholders believe the public has a right to know the number of students graduating and have access to that data. During audit work, one stakeholder discussed the importance of looking at the bigger picture and the economic impacts of education. The importance of paying attention to students who are at risk of dropping out was highlighted. The number of individuals in prison and on social welfare without a degree is high. The expense on the back end of “at-risk” kids is much more than if efforts would focus on the problem while they are in school. National Use of Data for Economic Analysis The National Center for Education Statistics, in conjunction with the U.S. Department of Commerce, confirms the importance of tracking these areas, by stating, “Dropouts from high school are more likely to be unemployed and earn less when they are employed than those who complete high school.” Research presented to the New Mexico Business Roundtable for Educational Excellence by the Office of Education Accountability estimates a lifetime loss of tax revenues, from males ages 25-34 years who did not complete high school, to be approximately $944 billion, with cost increases to public welfare and crime at $24 billion. Montana decision-makers could use similar approaches to look at the effects of dropouts on Montana’s economy. The following chart depicts one method of calculating the economic impacts of a high school diploma in Montana. Page 19
  • 33. Chapter IV – Use of Data Figure 1 Economic Benefits of Education in Montana Annual Increase in Earnings by Educational Level $0 $5,000,000 $10,000,000 $15,000,000 $20,000,000 $25,000,000 $30,000,000 $35,000,000 High School Diploma Some Postsecondary Eductaion Bachelor's Degree Source: Data compiled by Alliance for Excellent Education, 2005. The increased earnings in the above chart were calculated using graduate rate data from the National Center for Education Statistics and the Manhattan Institute for Policy Research and a formula from the U.S. Department of Commerce. The availability of better graduate and dropout data provides a better means to analyze economic costs and benefits of education. Stakeholders' Use of Data At the local level, schools use graduate and dropout data to assess the performance of their individual school and district. Administrators review the data collected on the number of graduates and dropouts in order to discern the bigger picture of the school’s performance. One educational stakeholder stated, “dropout and graduate data is just one indicator of school performance, but a foundational one so the district and state know where to put their resources.” A superintendent of a large district in the state developed dropout prevention programs and started an alternative high school because the data for his district showed high numbers of dropouts. Because Page 20
  • 34. Chapter IV – Use of Data graduation and dropout rates are performance indicators for schools, stakeholders indicated they would like to see a more consistent depiction of the rates. Accessibility and Use of Data The OPI Division of Measurement and Accountability at the Office of Public Instruction collects, compiles, and analyzes graduate and dropout data, shares data with various programs within OPI and presents annually to the Board of Public Education. Upon request, the division also provides data to educational stakeholders in the state and researchers from around the nation. Some annual reports are posted to OPI’s website, as well. Audit work found no formal plan for educational stakeholders and the public to access and analyze data stored in the new system. The RFP does request the system have an interactive querying tool to enable data driven decision-making by state-level education staff and policy makers. In the OPI concept and implementation plan for the new statewide student information system the term “information democracy” is used. Information democracy means everyone (with appropriate security) can access data in the data warehouse component of the system (i.e., it is an open system). Different stakeholders in the educational community need different types of access to data. For example, members of the general public often need summary or “canned reports” from the data warehouse, whereas some researchers or legislators may need to conduct a series of ‘ad hoc’ queries. In such a system, less experienced data users must have reports regularly pushed to them via the Internet and those groups that have the capability for greater analysis may have permission to pull more selective data at any time from the data warehouse. Section 10.55.603, ARM, states the assessment of educational programs and their effectiveness should be examined through assessment results as well as graduate and dropout numbers. In order to examine graduate and dropout numbers for program effectiveness, statewide data needs to be accessible. A comprehensive system that provides various means to access data would be more effective. Page 21
  • 35. Chapter IV – Use of Data Conclusion OPI is working to implement a $2 million statewide student information system. The implementation of a new information system would be an optimal time to establish a plan for data accessibility and dissemination. An accessibility and distribution plan would enable the state to effectively utilize the $2 million information system to its full potential. The implementation of the new system is the first step to providing quality data to educational stakeholders. However, this data should be used and analyzed. A plan for data distribution and accessibility is the next step in fully utilizing the student information management system. Recommendation #3 We recommend OPI establish a plan for accessing and disseminating the data in the new student information system. Page 22
  • 36. Appendix A – Average Dropout Rate By High School Page A-1 School 3 Year Average Dropout Rate Absarokee High School 0.53% Alberton High School 1.33% Anaconda High School 3.62% Arlee High School 2.64% Augusta High School 0.00% Bainville High School 0.00% Baker High School 0.37% Beaverhead Co High School 2.63% Belfry High School 3.23% Belgrade High School 4.28% Belt High School 1.33% Big Sandy High School 1.33% Big Sky High School 3.16% Bigfork High School 2.56% Billings Sr High School 4.67% Billings West High School 3.02% Blgs Central Catholic H S 0.40% Blue Sky High School 0.00% Box Elder High School 12.32% Bozeman High School 3.22% Brady High School 3.09% Bridger High School 1.00% Broadview High School 0.74% Broadwater High School 3.00% Brockton High School 3.35% Browning High School 7.25% Butte Central High School 0.22% Butte High School 5.58% C M Russell High School 2.18% Capital High School 3.32% Carter County High School 0.99% Cascade High School 3.24% Centerville High School 1.79% Charlo High School 2.54% Chester High School 1.12% Chinook High School 2.77% Choteau High School 0.40% Circle High School 1.19% Colstrip High School 2.09% Columbia Falls High Schl 4.29%
  • 37. Appendix A – Average Dropout Rate by High School School 3 Year Average Dropout Rate Columbus High School 1.70% Conrad High School 3.14% Corvallis High School 3.98% Culbertson High School 0.47% Custer Co District High 4.15% Custer High School 1.10% Cut Bank High School 4.01% Darby High School 5.50% Dawson High School 2.13% Denton High School 1.24% Dodson High School 0.00% Drummond High School 0.00% Dutton High School 0.00% Eagle High School 0.00% Ennis High School 0.00% Fairfield High School 0.00% Fairview High School 3.45% Fergus High School 3.03% Flathead High School 7.47% Flaxville High School 0.00% Florence-Carlton HS 0.85% Forsyth High School 3.25% Fort Benton High School 1.16% Frazer High School 7.52% Frenchtown High School 2.84% Froid High School 0.00% Fromberg High School 2.33% Gardiner High School 2.13% Garfield Co Dist HS 0.96% Geraldine High School 0.75% Geyser High School 0.00% Glasgow High School 2.58% Granite High School 4.33% Grass Range High School 0.64% Great Falls Cent Cath HS 0.66% Great Falls High School 3.10% Hamilton High School 3.42% Hardin High School 5.74% Harlem High School 6.10% Harlowton High School 1.25% Harrison High School 0.00% Havre High School 3.95%
  • 38. Appendix A – Average Dropout Rate by High School Page A-3 School 3 Year Average Dropout Rate Hays-Lodge Pole High Sch 11.56% Heart Butte High School 12.68% Helena High School 5.43% Hellgate High School 5.10% Highwood High School 0.82% Hinsdale High School 0.00% Hobson High School 0.00% Hot Springs High School 0.86% Huntley Project High Schl 0.88% Hysham High School 1.27% Jefferson High School 2.44% Joliet High School 1.12% Joplin-Inverness HS 0.00% Judith Gap High School 0.00% Kalispell Jr High School 9th 1.62% K-G High School 0.00% Lambert High School 0.00% Lame Deer High School 10.88% Laurel High School 3.57% Lavina High School 0.00% Libby High School 4.21% Lima High School 0.00% Lincoln Co High School 2.58% Lincoln High School 3.33% Lodge Grass High School 18.71% Loyola-Sacred Heart H S 0.16% Lustre Christian H S 0.00% Malta High School 0.35% Manhattan Christian H S 0.00% Manhattan High School 0.96% Medicine Lake High School 0.00% Melstone High School 1.19% Moore High School 1.05% Mount Ellis Academy High 0.44% MT Sch For Deaf & Blnd HS 0.00% Nashua High School 0.00% Northern Cheyenne Trib HS 8.46% Noxon High School 1.67% Opheim High School 0.00% Outlook High School 0.00% Park City High School 0.00% Park High School 2.54%
  • 39. Appendix A – Average Dropout Rate by High School School 3 Year Average Dropout Rate Peerless High School 0.00% Pine Hills School HS 0.00% Plains High School 2.56% Plenty Coups High School 11.06% Plentywood High School 2.12% Plevna High School 0.00% Polson High School 6.93% Poplar High School 10.17% Powder River Co Dist High 0.23% Powell County High School 6.86% Power High School 2.50% Rapelje High School 0.00% Red Lodge High School 1.53% Reedpoint High School 0.00% Richey High School 0.00% Riverside High School 0.00% Roberts High School 0.00% Rocky Boy High School 12.18% Ronan High School 8.38% Rosebud High School 1.15% Roundup High School 4.11% Roy High School 0.00% Ryegate High School 2.78% Saco High School 1.10% Savage High School 1.56% Scobey High School 0.30% Seeley-Swan High School 2.56% Sentinel High School 3.28% Shelby High School 7.55% Shepherd High School 3.19% Sheridan High School 1.10% Shields Valley High Schl 2.47% Sidney High School 2.57% Simms High School 3.53% Skyview High School 1.96% St Ignatius High School 4.94% St Labre High School 2.52% St Regis High School 1.00% Stanford High School 1.19% Stevensville High School 3.93% Sunburst High School 1.49% Superior High School 1.46%
  • 40. Appendix A – Average Dropout Rate by High School Page A-5 School 3 Year Average Dropout Rate Sweet Grass Co High Schl 2.38% Terry High School 1.56% Thompson Falls High Schl 2.14% Three Forks High School 1.43% Troy High School 1.27% Turner High School 1.10% Twin Bridges High School 0.46% Two Eagle River High Schl 8.26% Valier High School 0.44% Victor High School 3.24% West Yellowstone HS 6.82% Westby High School 0.00% White Sulphur Springs HS 3.80% Whitefish High School 3.05% Whitehall High School 3.39% Whitewater High School 0.00% Wibaux High School 0.99% Willow Creek High School 0.00% Winifred High School 0.72% Winnett High School 0.00% Wolf Point High School 5.68%