Download to read offline


![Vendor Rating - Bajaj
CSPL (Vendor) Rating from BAJAJ [2012-13]
Standa
Customer APRIL MAY JUN JUL AUG SEP OCT NOV DEC JAN FEB MAR
rd
BAL – WC < Level
(100487) 2 2 3 3
BAL – < Level
Haridwar 2 2 2 2
(111407)
34](https://image.slidesharecdn.com/0614607-130318062902-phpapp02/75/0614607-34-2048.jpg)
![Line PPM feedback from M&M FES
Actual 2012-13
Line ppm:
Actual
MM FES Apr May Jun Jul Aug Sep Oct Nov Dec Jan Feb Mar
11-12
TARGET LR
PPM <250 618 258 13
ppm
% GR
3 0 0
Rejection = 0
M&M FES - Line ppm [12-13]
Target: 250 ppm
700
600
500
400
300
200
100
0
Actual 11-…
Nov
Aug
Apr
Jul
May
Dec
Sep
Feb
Oct
Mar
Jun
Jan
35](https://image.slidesharecdn.com/0614607-130318062902-phpapp02/75/0614607-35-2048.jpg)


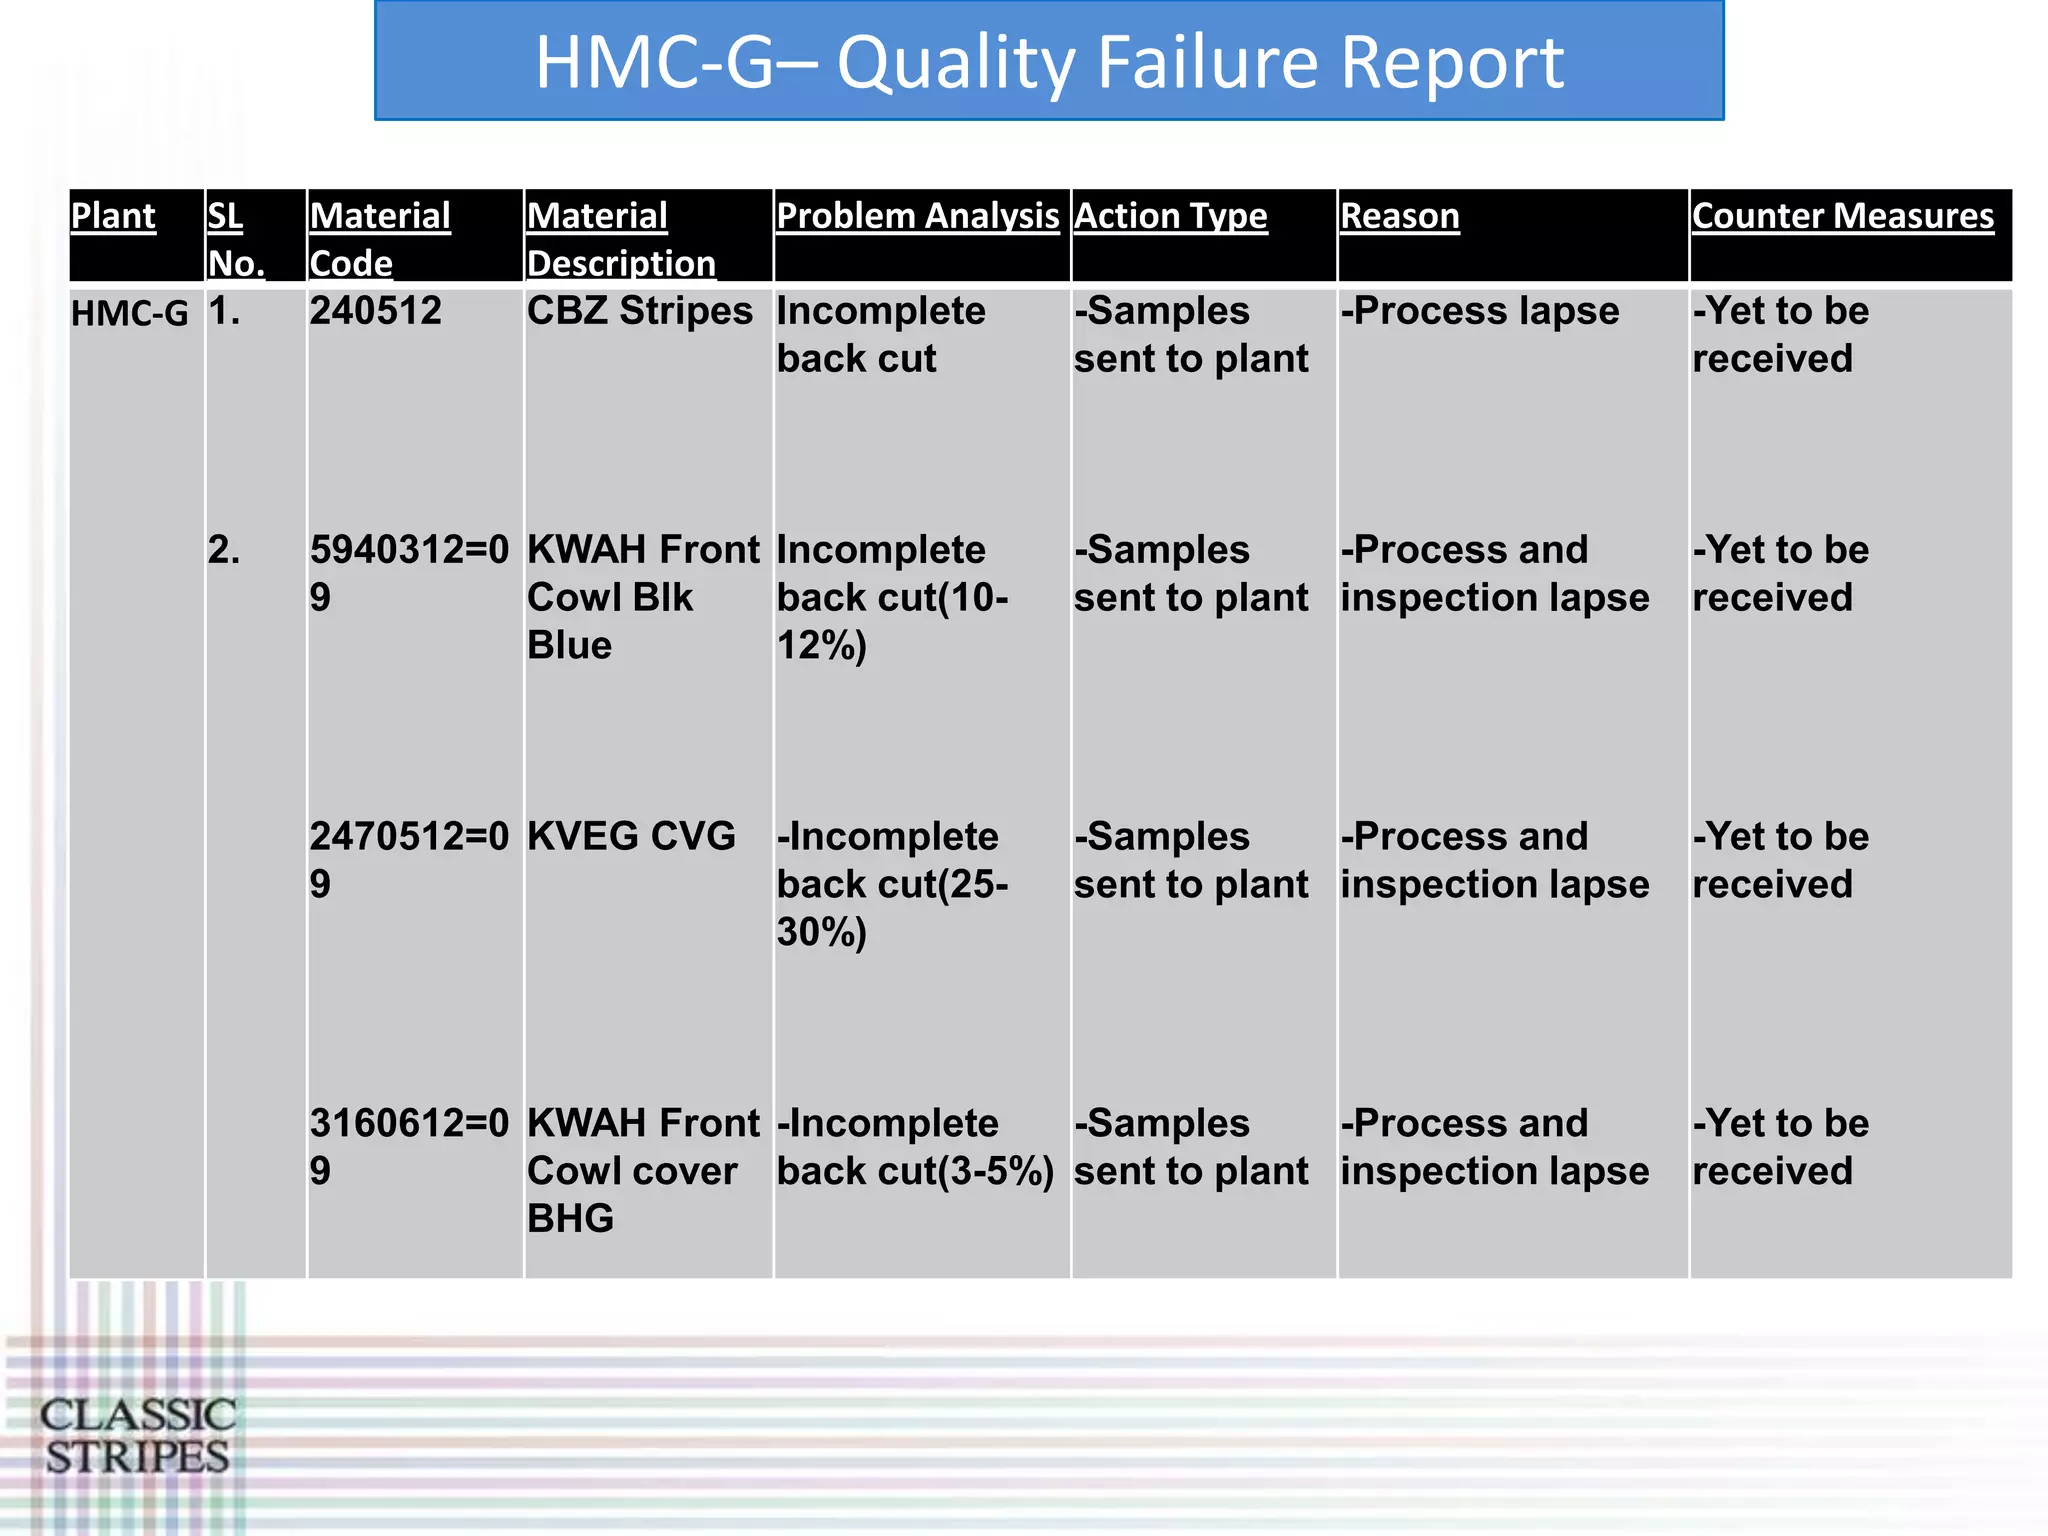
![5. Summary of Corrective actions - June
Sr.No Customer Complaint Description Root Cause Corrective Action
1] Work instruction amended for the method
IYM- Levelling of blade on one side of die
1 Graphic Cut in 1CK2 of visual checking of deepcut,
Surajpur found out to be uneven.
2] job training provided to the inspectors.
Uncoated metallic particles have less
Coated metallic particles to be used. Bill of
IYM- Ink peel off in Yamaha cohesive force as compared to coated
2 material amended and also the process
Surajpur Emblem (5KAB CRUX) metallic particles used in ink
routing changes in SAP.
preparation.
IYM- New material was used - inadequate PPAP methodology to be followed for new
3 Air Bubbles in 1CK3
Surajpur validation material introduction
Disc. 125 ST Shade
Variation in deposition of metallic
Bajaj - Variation found in Flame red Uniform stirring during ink issue also stirring
4 partcile on base film during printing in
Waluj for batches 446052012 & prior to pouring ink on the screen.
single batch.
70062012
Smoke Variation found in Setup Sheets/Dials to be crossed completely
Setup sheet is not identified at printing
HDT Diamler in 1 pieces in using permanent marker in printing stage
stage before proceeding for further
Continental- lot size of 300 of batch itself.
5 operation leading to mixing of setup
Bengaluru number 2021211 at customer Illumination inspection to be done on Cluster
sheets/dials with Ok sheets/dials at final
assembly line at Continental, instead of light table.
inspection.
Bangalore on 20/06/2012.
Green and white dots found Before commencing printing a pc sheet with
Leakage in screen due to removal of
in HDT Daimler in 59 pieces lamination and/or rough pc sheet will be
emulsion coating from non image area
Continental- in lot size of 300 of batch printed and checked for ink leakage and
6 leading to green and grey ink transfer
Bengaluru number 2021211 at customer same will be done after every 100th and for
on image area while printing 5th Colour
assembly line at Continental, last sheet and leakages if any will be touched
and 6th colour respectively
Bangalore on 20/06/2012. up by PVA](https://image.slidesharecdn.com/0614607-130318062902-phpapp02/75/0614607-38-2048.jpg)


![Ink Lab – OC Wastage for June
Wastage % Wastage
PO no. Machine Description Qty. 8600 OC Average
Qty.Kg OC
100068194 SPS-XP KWAH BLK H. GREY F/COWL (T-3) [4 SETS] 2000 8.8 1.781 20.20%
100068200 SPS-XP BAJAJ DISC 125ST BLK RED SEAT/FR.COWL(1S 2000 16 3.6 22.50%
100068001 SPS-XP KTPJ C.B.RED T-2 FUC 'A', BC 'A' (1SET) 2600 11.2 2.544 22.70%
100068691 SPS-XP BAJAJ DISC 125ST BLK RED SEAT/FR.COWL(1S 1860 6.4 1.384 21.50%
100068615 ATMA-6 EXPORT 1000 5.8 1.19 20.50%
100070565 ATMA-6 EXPORT 500 4.5 1 22.20% 21.65%
CSPL 2120 Wastage % Wastage
PO no. Machine Description Qty. Average
of Nazdar Qty.Kg OC
100067055 SPS-XP AACA PASSION PRO BLK H.GREY SC (2SETS) 2272 10.5 2.44 23.20%
100068298 SPS-XP AAFA SPL.NXG BLK RED ABS PARTS(1SET) 3000 16.8 4.27 25.40%
100067415 SPS-XP AACA[PASS.PRO]BLK H.GREY ABS (1SET) 2300 11.2 3.5 31.25%
100068271 SPS-XP BAJAJ PULSAR 135 RED ABS(4SETS) 600 3.5 1.2 34.20%
100068001 SPS-XP KTPJ C.B.RED T-2 FUC 'A', BC 'A' (1SET) 1100 5.6 1 17.80%
100068604 SPS-XP KWAH BLK RED/BLUE /H.GREY R/COWL(5SETS) 2500 14.4 3.4 23.60% 26%
44](https://image.slidesharecdn.com/0614607-130318062902-phpapp02/75/0614607-44-2048.jpg)


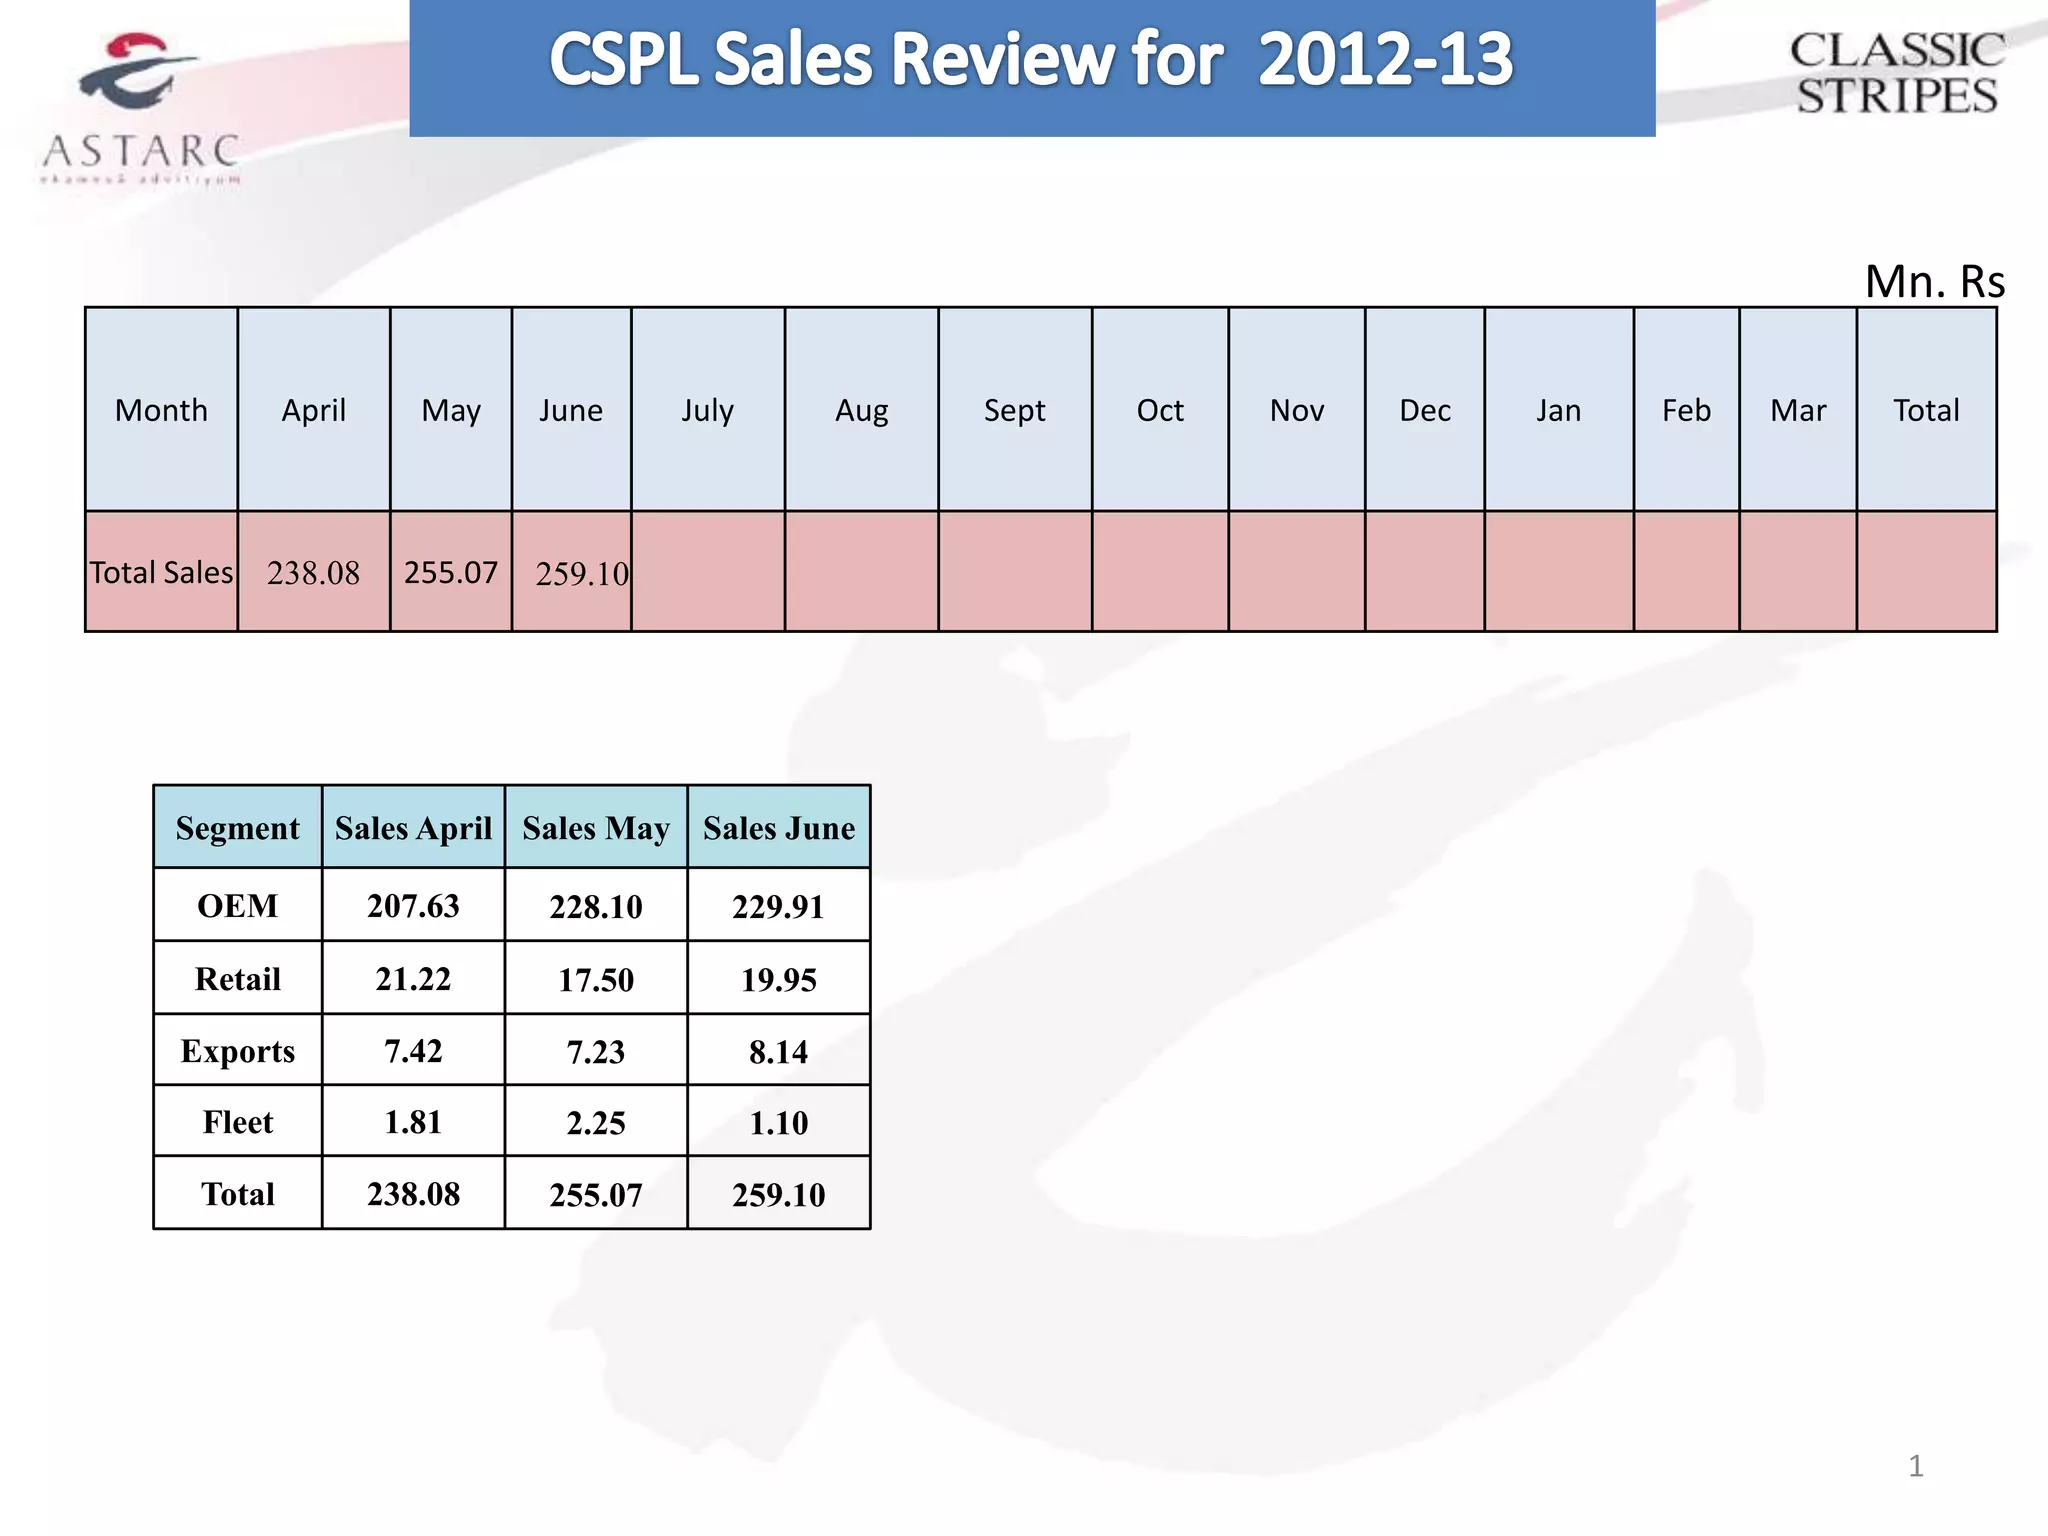
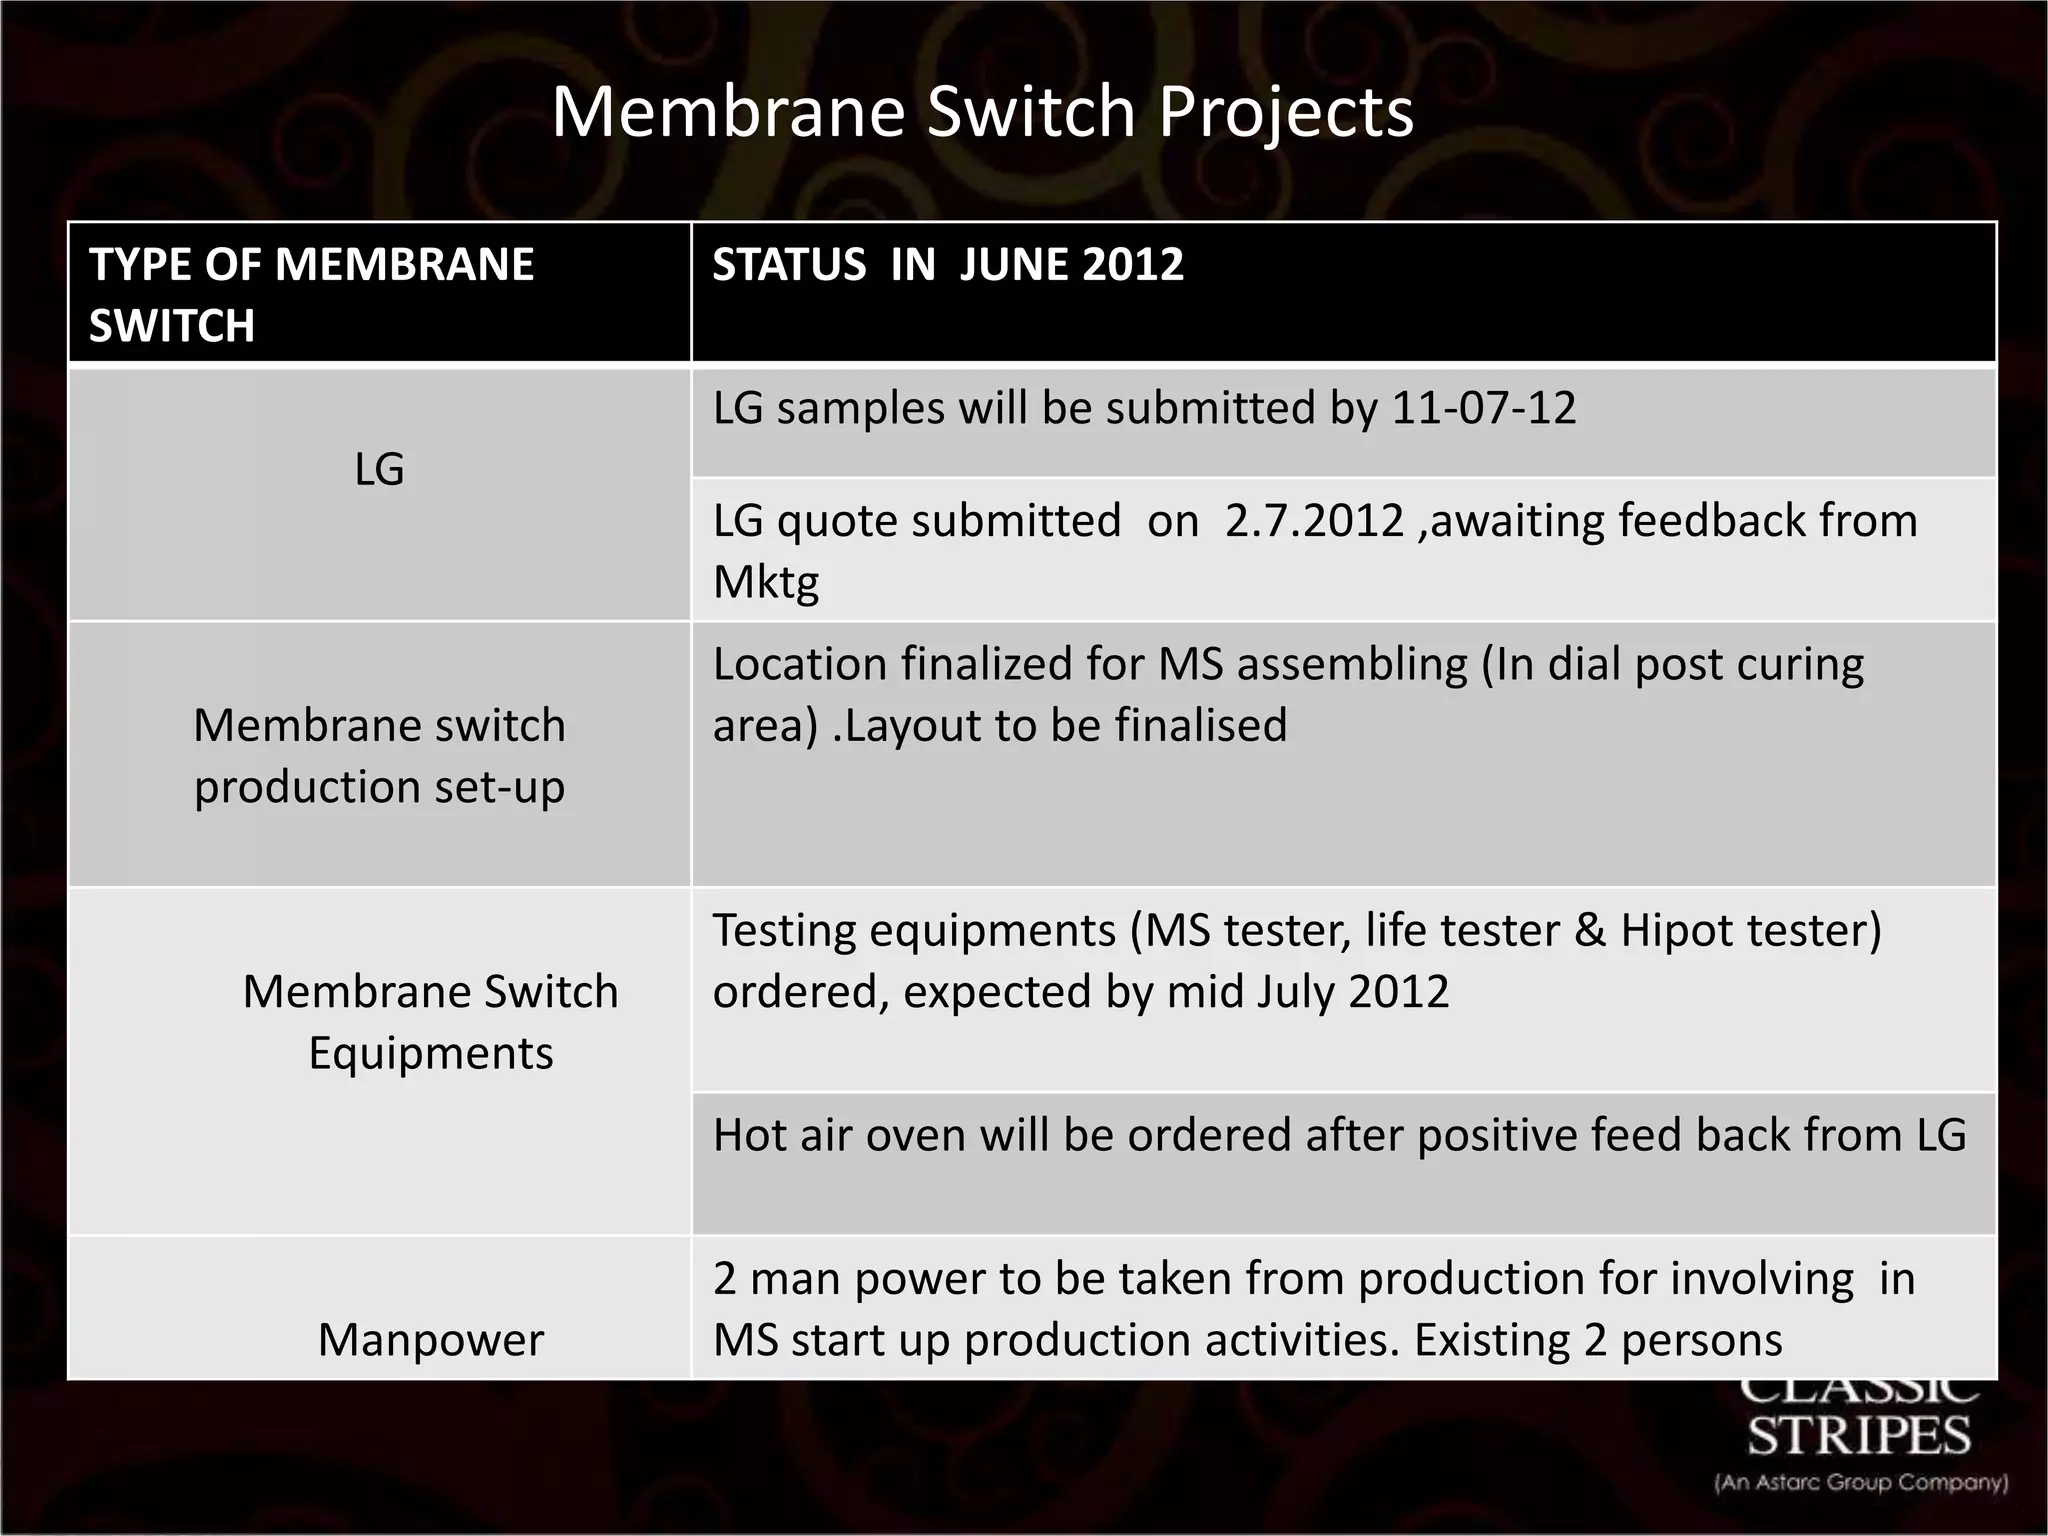
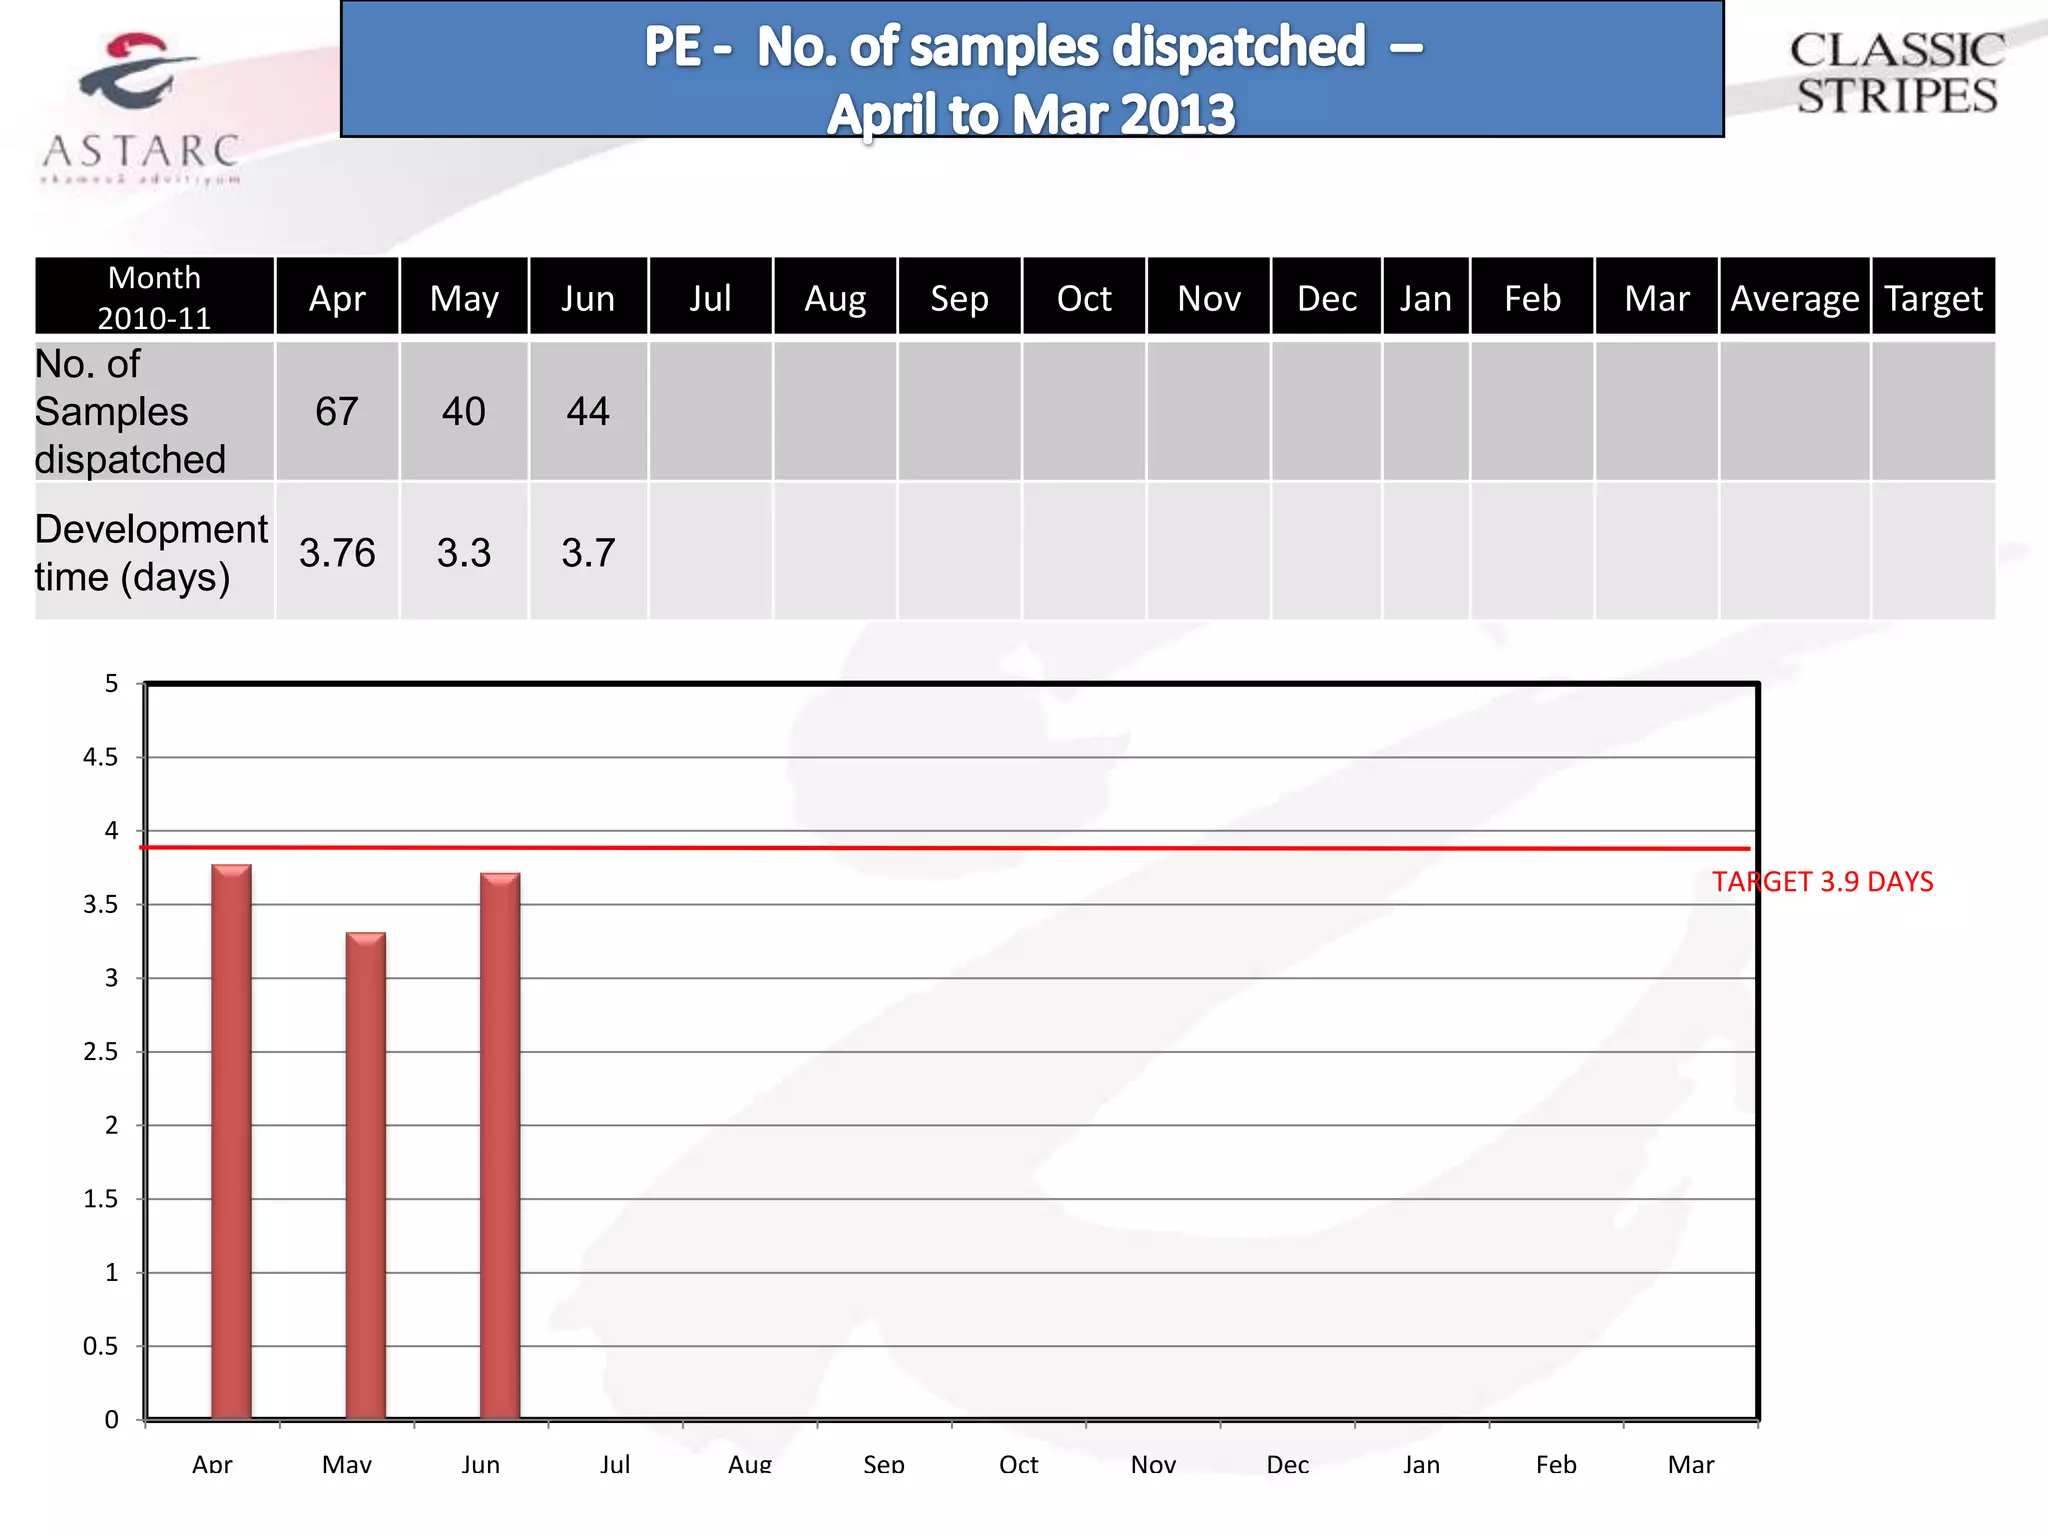
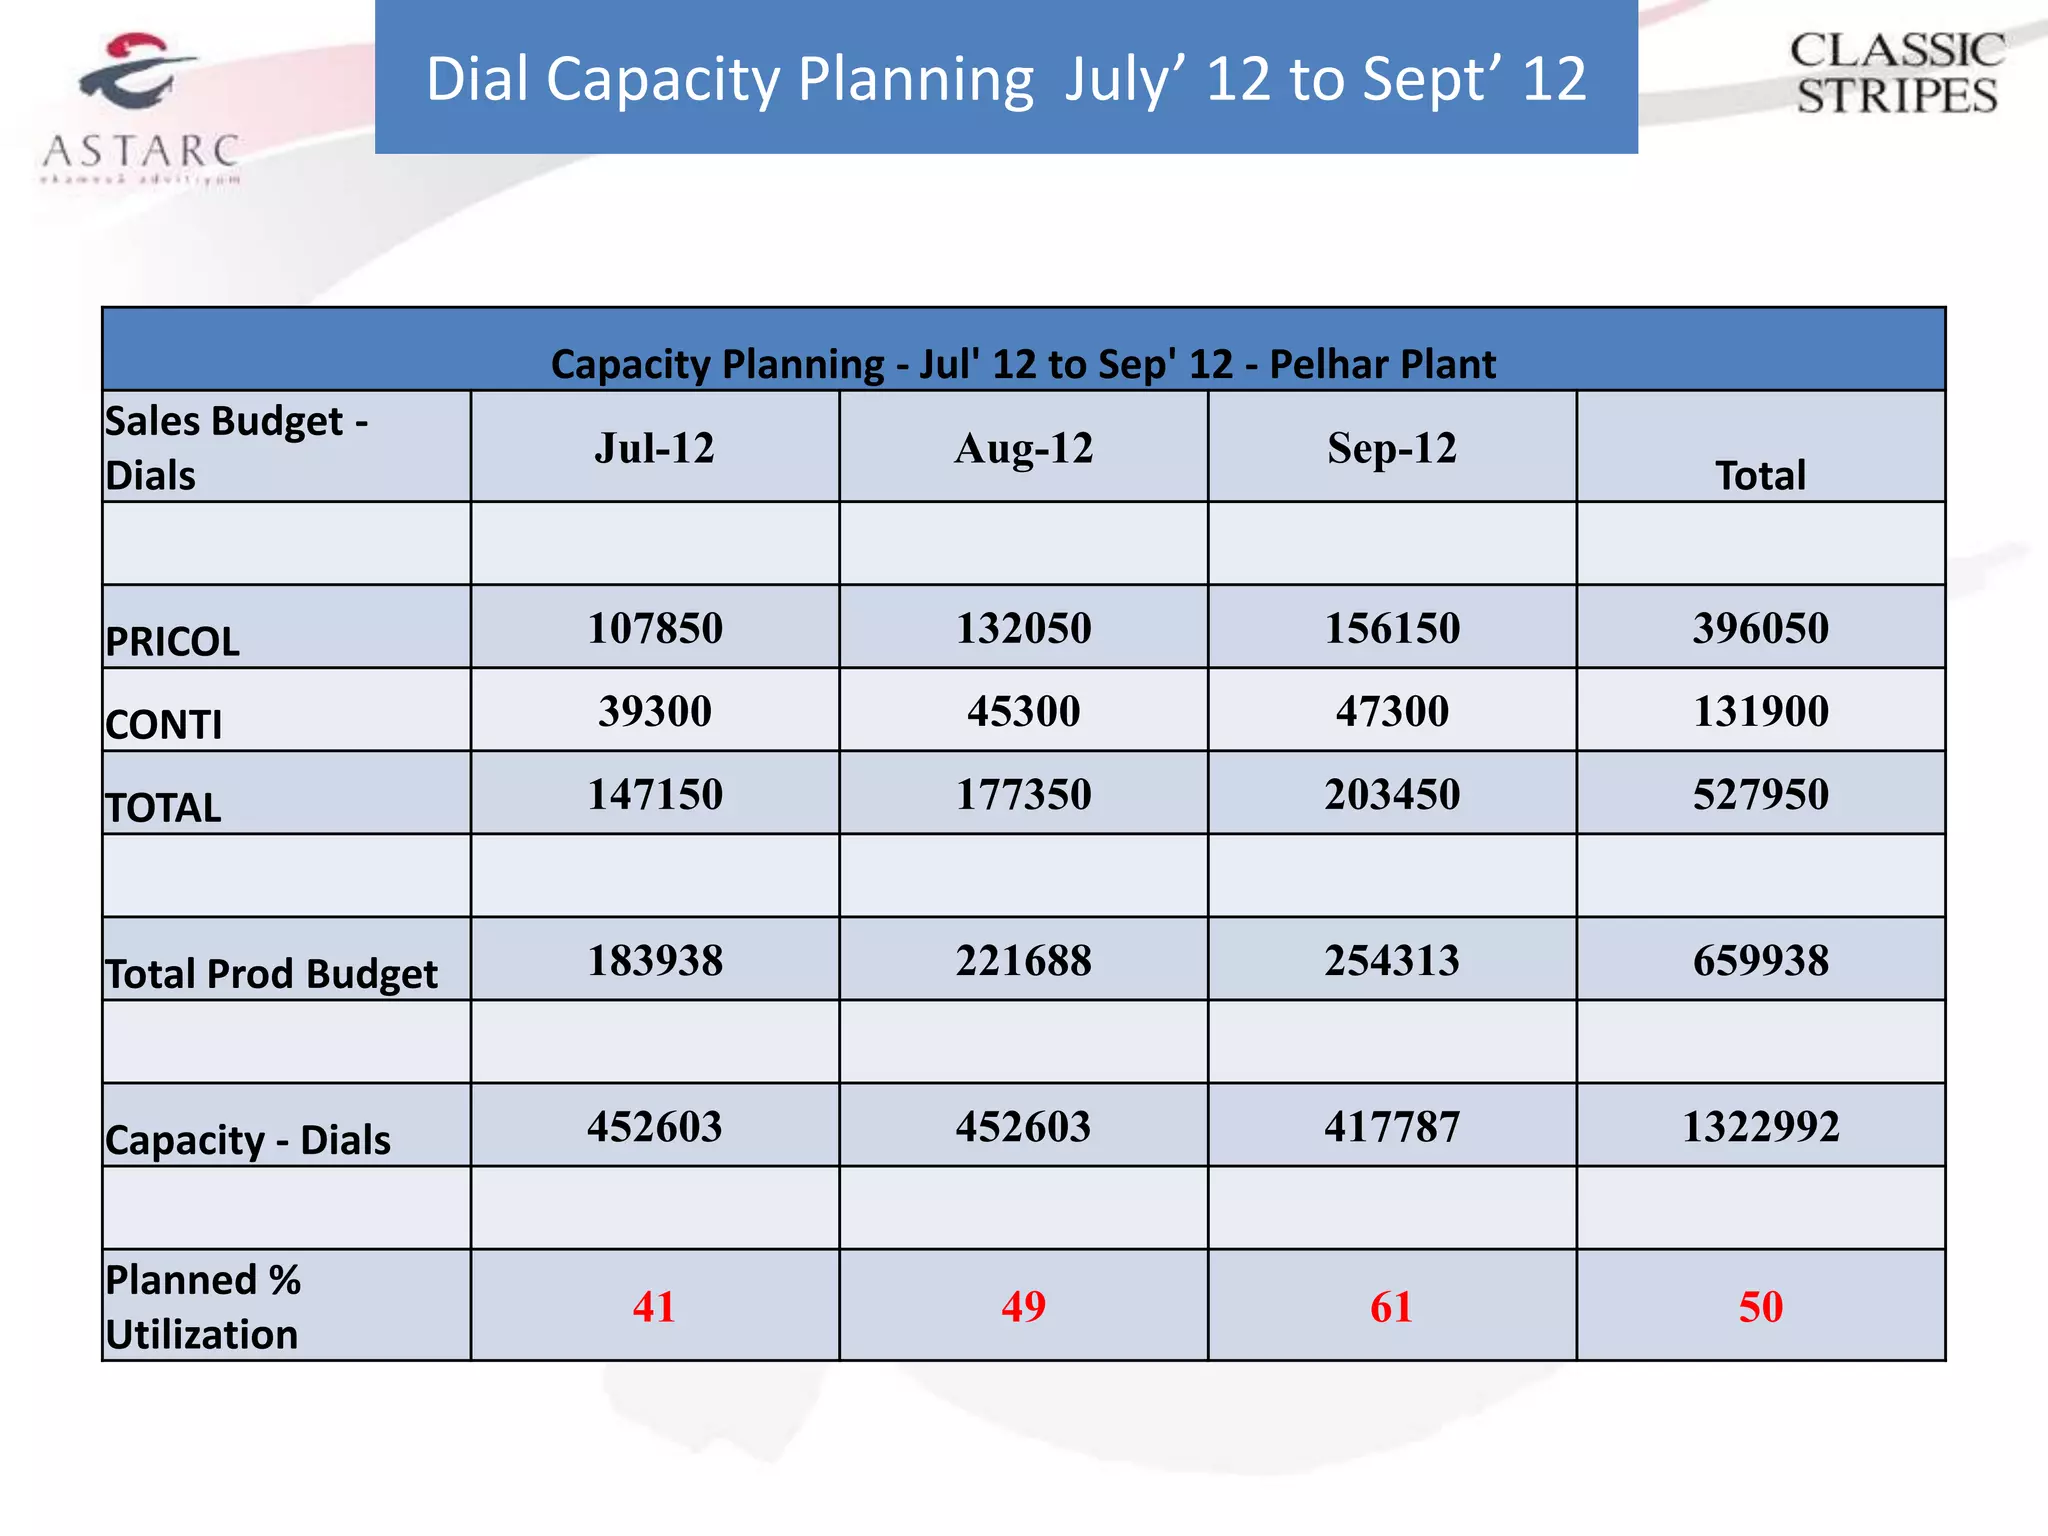
This document contains sales, production, export, membrane switch, and raw material data for a company for the month of June 2012. It reports total sales of 259.10 million for June across OEM, retail, export, and fleet segments. Production capacity was 0.83 million sets and utilization was 61%. The export projects status update mentions material testing results for Honda and Yamaha projects. It also includes membrane switch production setup details and tracking of raw material development time, which averaged 3.9 days against a target of 3 days.


![Navrh programu rada_rtvs_130320[1]](https://cdn.slidesharecdn.com/ss_thumbnails/navrhprogramuradartvs1303201-130318062908-phpapp01-thumbnail.jpg?width=640&height=640&fit=bounds)


