التحليل الفني اليومي - بورصة قطر - 04 فبراير
•
0 likes•330 views

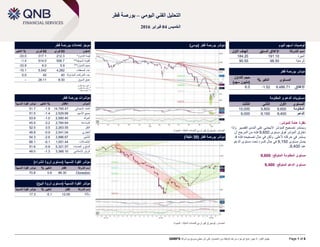
ويستمر تصحيح المؤشر االيجابي على المدى القصير وإذا اخترق المؤشر فوق مستوى 0,6,9 فإنه من المرجح أن يستمر في حركته ألعلى. ولكن في حال تصحيحه فإنه قد يصل مستوى 0,1,9 في حال كسره تحت مستوى الدعم .0,499 عند

Recommended
More Related Content
What's hot
What's hot (20)
Viewers also liked
Viewers also liked (19)
Similar to التحليل الفني اليومي - بورصة قطر - 04 فبراير
Similar to التحليل الفني اليومي - بورصة قطر - 04 فبراير (16)
More from QNB Group
More from QNB Group (20)
التحليل الفني اليومي - بورصة قطر - 04 فبراير
- 1. حقوقالنشر:اليجوزنسخأيجزءمنهذهالوثيقةدونالحصولعلىإذنخطيصريحمنشركةQNBFS Page 1 of 6 التحليلالفنياليومي–قطر بورصة الخميس40فبراير6402 قطر بورصة تعامالت موجز التغيير % 20فبراير 23فبراير المكون -33.0 317.1 212.3 التداول قيمة* -1.4 514.0 506.7 **السوقية القيمة -33.9 9.0 5.9 ***التداول حجم -15.1 5,042 4,282 الصفقات عدد 0.0 40 40 المتداولة الشركات عدد – 26:11 8:30 السوق عمق مليون *قطري لاير قطري لاير مليار ** صفقة مليون *** قطر بورصة مؤشرات الن القوة مؤشرسبية %التغيير اإلقفال المؤشر 51.7 -1.5 14,795.47 العائداإلجمالي 51.5 -1.4 2,529.68 جميعاألسھم 53.9 -1.0 2,590.40 البنوك 45.5 -3.2 2,764.64 الصناعة 52.5 0.5 2,263.55 النقل 48.8 -0.9 2,041.04 العقاري 54.3 -2.6 3,996.67 التأمين 66.1 -0.1 1,051.44 اإلتصاالت 51.6 -0.8 5,321.57 الخدمات و السلع 48.0 -1.3 3,366.10 اإلسالمي الريان النسبي القوة مؤشرةذروة (مستوىالشراء) النسبية القوة مؤشر % التغيير إقفال الشركة اسم 70.8 0.6 86.30 Ooredoo النسبي القوة مؤشرةذروة (مستوىالبيع) النسبية القوة مؤشر % التغيير إقفال الشركة اسم 17.3 -5.1 12.00 داللة مؤشربورصةقطر)(يومي كيو ,بلومبيرغ :المصادرالمالية للخدمات بي ان-البحوث توصياتأسهماليوم االول الهدف السابق اإلغالق الشركة اسم 184.20 191.10 الميرة 90.50 98.50 الرعاية مؤشربورصةقطر التداول حجم )سهم (مليون % التغير المستوى 6.0 -1.52 9,486.71 اإلغالق المقاومة و الدعم مستويات الثالث الثاني األول المستوى 10,000 9,800 9,600 المقاومة 9,000 9,150 9,400 الدعم :للمؤشر عامة نظرة ويستمرتصحيحالمؤشرااليجابيعلىالمدىالقصيروإذا مستوى فوق المؤشر اخترق0,6,9فإنالم من هرأ جحن يستمرفيأل حركتهعلى.ولكنقد فإنه تصحيحه حال في مستوى يصل0,1,9مستوى تحت كسره حال فيالدعم عند0,499. المتوقع المقاومة مستوى:9,600 المتوقع الدعم مستوى:9,400 مؤشربورصةقطر(32دقيقة) المالية للخدمات بي ان كيو ,بلومبيرغ :المصادر-البحوث
- 2. حقوقالنشر:اليجوزنسخأيجزءمنهذهالوثيقةدونالحصولعلىإذنخطيصريحمنشركةQNBFS Page 2 of 6 ( البياني الرسميومي) المالية للخدمات بي ان كيو ,بلومبيرغ :المصادر-البحوث ( البياني الرسمساعة) المالية للخدمات بي ان كيو ,بلومبيرغ :المصادر-البحوث الميرة حجمالتداول % التغير السعر 5,198 -1.24 191.10 اإلغالق (لاير المقاومة و الدعم مستويات) الثالث الثاني األول المستوى 212.00 205.00 200.00 المقاومة 180.00 184.20 190.60 الدعم الشرح : عامة نظرة ارتدسعرالسھمتصحيحياووصلالىقاعسعريسابق .الماضي ديسمبر شھر في مكونكمامستوى الى وصل والمك المحتمل المقاومةوعند نملـ المتحرك السعر توسط ,9يوما.كماألس انعكاسيتين شمعتين السھم سعر كون.فل ونذكر.ألسفل يزال ال الميرة سھم لسعر العام االتجاه بأن :المتوقع المستهدف السعر184.20لاير–180.00لاير نرجحالبيعفيحالكسرسعرالسھمتحتمستوىسعر 109.69لاير.
- 3. حقوقالنشر:اليجوزنسخأيجزءمنهذهالوثيقةدونالحصولعلىإذنخطيصريحمنشركةQNBFS Page 3 of 6 ( البياني الرسميومي) المالية للخدمات بي ان كيو ,بلومبيرغ :المصادر-البحوث ( البياني الرسمساعة) المالية للخدمات بي ان كيو ,بلومبيرغ :المصادر–البحوث الرعاية التداول حجم % التغير السعر 169,384 1.03 98.50 اإلغالق (لاير المقاومة و الدعم مستويات) الثالث الثاني األول المستوى 109.30 108.00 103.90 المقاومة 85.20 90.50 96.10 الدعم الشرح : عامة نظرة لقدشراء توصية الماضي االثنين يوم اصدرناووصل للسھم المحد الھدفين الى السھم سعردينعند09.49كھدف لاير و أول04.09.ثان كھدف لايرواستمرالسھم سعر ارتفاع مستوى الى193.09.لايروإنلح تبع لمننصح فإننا االن د الشاشة على عينيك تبقي بأنالسھ سعر ألنكون مشمعة انعكاسيةتسمىShooting Starاحتمال على يدل مما ج.السابق االرتفاع ارباح ني :المتوقع المستهدف السعر90.50لاير–85.20لاير نرجحالبيعفيحالكسرسعرالسھمتحتمستوىسعر 06.19لاير.
- 4. حقوقالنشر:اليجوزنسخأيجزءمنهذهالوثيقةدونالحصولعلىإذنخطيصريحمنشركةQNBFS Page 4 of 6 المتحرك اليومي المتوسط محورفيبوناتشيومستوياتالدعموالمقاومةالبينية المقاومة مستويات الدعم مستويات 022يوم 022يوم 02يوم الثالث الثاني األول المحور األول الثاني الثالث إغالق آخر المؤشر 11,261.98 10,607.91 9,792.37 9,649.11 9,577.09 9,532.60 9,460.58 9,388.56 9,344.07 9,272.05 9,486.71 العام المؤشر 17,504.65 16,489.48 15,222.83 15,048.75 14,936.43 14,867.04 14,754.72 14,642.40 14,573.01 14,460.69 14,795.47 العائداإلجمالي 3,004.02 2,824.51 2,609.48 2,570.31 2,552.46 2,541.43 2,523.59 2,505.74 2,494.71 2,476.87 2,529.68 جميعاألسھم 4,273.70 3,954.80 3,585.39 3,429.70 3,402.46 3,385.62 3,358.38 3,331.14 3,314.30 3,287.06 3,366.10 الرياناإلسالمي قطاعالبنوكوالخدماتالمالية 42.14 38.81 35.15 35.02 34.54 34.24 33.77 33.29 32.99 32.52 33.85 الريان 52.25 48.73 43.41 41.38 41.06 40.86 40.53 40.21 40.01 39.68 40.55 التجاري 49.37 45.48 41.63 37.50 37.16 36.94 36.60 36.26 36.04 35.70 36.90 الدوحة 108.26 109.26 101.24 97.43 95.94 95.02 93.53 92.04 91.12 89.63 92.50 المصرف 73.77 68.88 63.31 65.40 64.98 64.72 64.30 63.88 63.62 63.20 64.00 الدولي التأمين 90.93 87.09 81.26 84.60 83.84 83.36 82.60 81.84 81.36 80.60 82.20 قطرللتأمين السلعاالستهالكيةوالخدمات 155.79 135.19 109.30 107.30 104.32 102.48 99.50 96.52 94.68 91.70 98.50 الرعاية الصناعة 124.51 111.66 102.13 103.47 102.09 101.24 99.87 98.49 97.64 96.27 100.00 صناعاتقطر 211.42 206.61 201.40 196.20 193.76 192.24 189.80 187.36 185.84 183.40 190.00 كھرباءوماء 65.16 54.95 47.18 38.70 38.70 38.70 38.70 38.70 38.70 38.70 38.70 الخليجالدولية 45.00 39.38 33.72 27.98 27.74 27.58 27.33 27.09 26.93 26.68 27.25 المستثمرون العقارات 44.85 40.38 36.98 32.45 32.13 31.92 31.60 31.28 31.07 30.75 31.65 بروة 22.81 21.68 19.63 18.41 18.28 18.21 18.08 17.95 17.88 17.75 18.19 المتحدةللتنمية 17.38 16.84 14.93 14.97 14.76 14.64 14.44 14.23 14.11 13.91 14.50 إزدانالقابضة 16.48 14.76 13.36 11.63 11.53 11.47 11.36 11.26 11.20 11.09 11.38 مزاياقطر اإلتصاالت 80.15 74.36 73.17 89.70 88.21 87.29 85.80 84.31 83.39 81.90 86.30 Ooredoo 14.36 12.63 11.44 10.87 10.79 10.74 10.65 10.57 10.52 10.43 10.62 فودافونقطر النقل 22.65 23.07 22.28 24.06 23.32 22.87 22.14 21.40 20.95 20.22 22.25 ناقالت 96.54 95.21 92.48 88.17 87.78 87.55 87.17 86.78 86.55 86.17 87.50 المالحة المصادر:بلومبيرغالمالية للخدمات بي ان كيو ,–البحوثمال .حظة:األرقامالمائلةأن على تدلالمتوسطاتالمتحركةمن أعلىمستوىالمؤشر/سعرالسھم
- 5. حقوقالنشر:اليجوزنسخأيجزءمنهذهالوثيقةدونالحصولعلىإذنخطيصريحمنشركةQNBFS Page 5 of 6 :التعريفات :اليابانية الشموعوطرق أحد هيرسماسعر الرسم يحدد .قديمة يابانية طريقة على ألسعاراالفتتاحت حيث الشمعة ""جسم من الشمعة تتكون و .محددة فترة خالل السھم وصله سعر أدنى و أعلى و اإلغالق وتو اإلفتتاح بسعر حدد سعر من أقل اإلغالق سعر أن تعني الملونة الشمعة .اإلغالقاالفتتاحب يسمى ما اليابانية للشمعة .البيضاء للشمعة بالنسبة صحيح العكس و" ـظل"و الشمعة.المطلوبة الفترة خالل السھم وصله سعر أقل و أعلى يحدد لظل هذا من كثيرة دالالت له الشمعة شكل فإن ,عامة بصورةاستمرارالتجاهأو السھمانعكاسه. :الدعم مستوىف المتداولين يشارك أن فيه يتوقع الذي المستوى هو ومن يقلل هذا و ,البيع من أكثر الشراء على يهاحتمالانخفاض.دنية مستويات إلى السھم :المقاومة مستوىمن يقلل ذلك و ,الشراء من أكثر بالبيع المتداولون يقوم أن يتوقع حيث ,الدعم مستوى عكس هو واحتمالارتفاع.أعلى مستويات الى السھم :البسيط المتحرك المتوسطهومتوسطحسابييحسبالسھم سعر معدلعلىعددمحددمنالفتراتالمختارةالسبب لھذاالمؤشر هذا يعتبرالشراء و البيع عالمات إعطاء في متأخر.المستخدمة المتوسطاتفيتحليلناتستخدمأسعار اإلغالق.بشكل،عامللمتوسطاتأغراضا،كثيرةمثلأداةلمعرفةاتجاهالسعر،تأشيريالسعر تقلبات حدة تقليلوالمستوياتالمحتملةللدعموالمقاومةمن ذلك غير إلى واالستخدامات. :السوق إتساعيشيرإلىعددعلى أقفلت و تداولھا تم التي المالية األوراقارتفاعمقابلعدداألسھمالمتراجعةفيتبادل.معين يوم التباعد / التقارب المتحرك المتوسط(MACD):و قوة في التغيرات على يدل تداول مؤشر هواتجاهوحسابات مجموعة خالل من األسھم أسعار زخممكونةاإلغالق أسعار بيانات من محسوبة زمنية سالسل ثالثة من.التاريخية ( النسبية القوة مؤشرRSI:)ال يتذبذب .المتداولين قبل من البيع أو الشراء ذروة لتحديد منه محاولة معينة فترة خالل السھم سعر تحرك قوة يقارن فني مؤشر هو وال بين مؤشر9ال و199درجةوصول يعتبر ,عام بشكل و . ال فوق قراءات الى المؤشر09ال تحت و الشراء ذروة مناطق الى وصل قد السعر بأن درجة39.البيع ذروة لمستويات درجة :األسعار شكل / نمطهو واستقراءهذه تأتي و .الفني التحليل وسط في تداولھا يتم معينة أشكال حسب السھم سعر لحركةالسعرية األنماطفيأشكالمختلفة(مثلالرأسوالكتفين،والمثلثات،واألعالمالخ.)وتستخدماألشكاللتحديد االتجاهاتالمحتملةأو السھم لحركةانعكاسھاونقاطالدخولوالخروجمن غيرها واالستخدامات. انسحابات:فيبوناتشيهذه نسبتاالنسحابات,فيبوناتشي ليوناردو الرياضيات لعالموالمستويات تستخدم .السابقة األسعار حركة أساس على السھم لسعر المقاومة أو للدعم المتوقعة المناطق إلى تشير التي األفقية الخطوط هيالتالية مستويات كأهم للسھماالنسحاباتهي و السھم لذلك السابقة للحركة المحتملة03.6,%3..0,%,9.9,%61..ال مستوى و %199.9.السابقة الحركة أجزاء من % :البينية المقاومة و الدعم مستويات و فيبوناتشي محورتماما مختلف هذا ولالنسحاباتالمذكومعينة حسابات المحور لھذا .أعاله رةس أعلى مع اإلغالق سعر منالسابق لليوم سعر أقل و عرمقاومة و دعم مستويات منھا يستخلص بينية.اليومي للتداول متوقعة
- 6. حقوقالنشر:اليجوزنسخأيجزءمنهذهالوثيقةدونالحصولعلىإذنخطيصريحمنشركةQNBFS Page 6 of 6 ل:إلتصال النافوسي زيدCMT،CFTeسوغاتاساركاركوشكريان شاهان أول بحوث محللمديرقسمالبحوثأول بحوث محلل (+974) 4476 6535(+974) 4476 6534(+974) 4476 6534 zaid.alnafoosi@qnbfs.com.qasaugata.sarkar@qnbfs.com.qashahan.keushgerian@qnbfs.com.qa إعالنبإخالءالمسؤوليةوحقوقالنشر:لقدتمإعدادهذهالمطبوعةمنقبلشركةQNBللخدماتالمالية"(QNBFS)"-.ش.ش.و-وهيشركةتابعةومملوكةبالكامللبنكقطرالوطني(ش.م.ق"( ).QNB.)"وتخضعشركةQNBللخدماتالماليةلتنظيمورقابةهيئةقطر لألسواقالماليةوبورصةقطر،ويخضعبنكقطرالوطني(ش.م.ق).لتنظيمورقابةمصرفقطرالمركزي.ّربتعهذهالمطبوعةعنآراءووجھاتنظرشركةQNBFSفيوقتمعينفقط.ولكنھاليستعرضاأوترويجاأوتوصيةلشراءأوبيعاألوراقالماليةأوغيرهامن ،االستثماراتكمااليقصدبھاتقديممشورةقانونيةأوضريبيةأومحاسبيةأومالية.والتقبلQNBFSأيمسؤوليةعلىاإلطالقعنأيخسائرمباشرةأوغيرمباشرةتنشأعناستخدامهذاالتقرير.فأيقراراستثمارييجبأنيعتمدعلىالظروفالفرديةللمستثمروأنينبنيعلى نصيحةاستثماريةّمدتقخصيصالغرضاالستثمار.ولذلكفإنناننصحالمستثمرينالمحتملينبقوةبالتماسمشورةمھنيةمستقلةقبلاتخاذأيقراراستثماري.وبالرغممنأنالمعلوماتالواردةفيهذاالتقريرقدتمالحصولعليھامنمصادرتعتقدشركةQNBFSأنھاجديرة،بالثقةإال أننالمنتحققمنهذهالمعلوماتبشكل،مستقلوقدالتكونالمعلوماتالواردةدقيقةأوكاملة.إنشركةQNBFSالتقدمأيّاتدتعھأوضماناتبشأندقةواكتمالالمعلوماتالمضمنةفيهذا،التقريروترفضقبولأيمسؤوليةفيهذاالصدد.إنالتقاريرالتيتتناولالتحليل،الفني واآلراءو/أوالتوصياتالتييتمالتعبيرعنھاقدتكونمختلفةأومخالفةآلراء/توصياتقسمالبحوثاألساسيةبشركةQNBFSنتيجةاالعتمادالكليعلىالبياناتالفنيةالتاريخية(السعروحجمالتداول.)وتحتفظشركةQNBFSبحقتعديلوجھاتالنظرواآلراءالواردةفيهذه المطبوعةفيأيوقت.كماأنھاقدتعربعنوجھاتنظرأوتتخذقراراتاستثماريةتختلفكثيراأوحتىتناقضوجھاتالنظرواآلراءالواردةفيهذاالتقرير.كمااليجوزاستنساخهذاالتقريركلياأوجزئيادونالحصولعلىإذنمنشركةQNBFS.