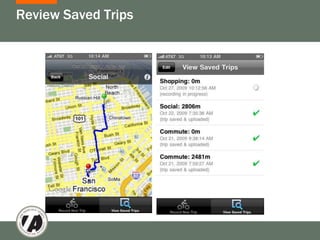
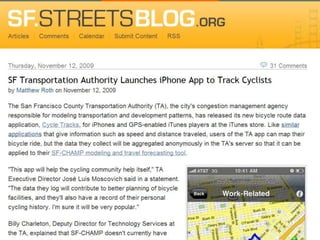
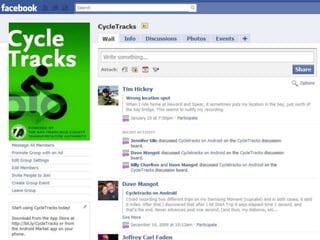
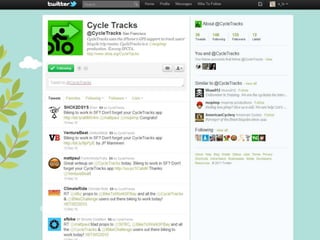
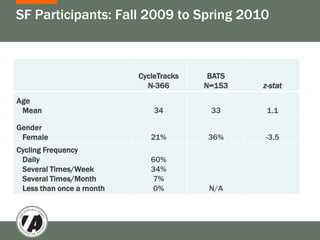
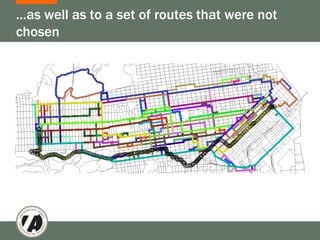
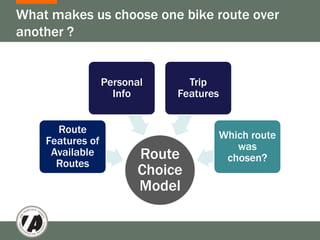
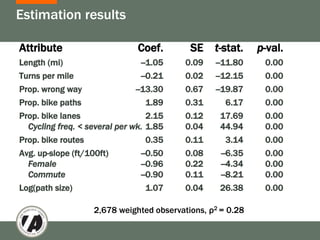
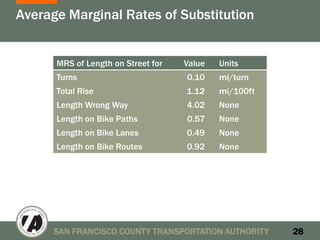
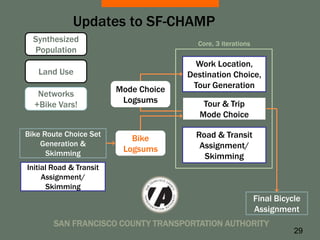
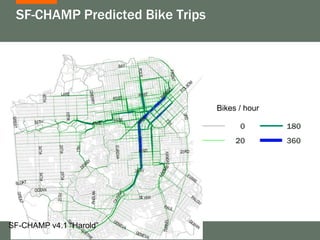
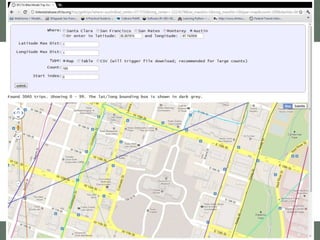
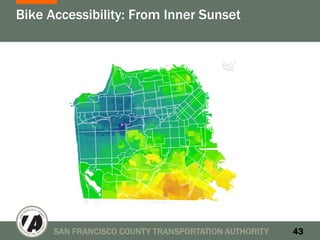
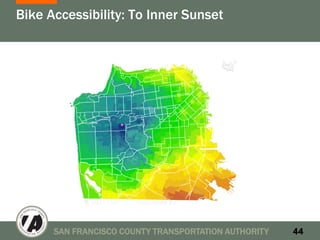
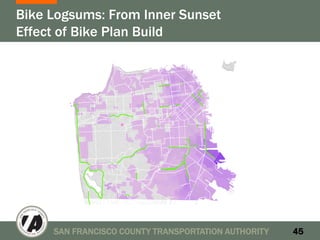
Completing the Cycle:
  Incorporating CycleTracks
       into SF-CHAMP
Using technology to understand the needs
               of cyclists


SAN FRANCISCO COUNTY TRANSPORTATION AUTHORITY
                  Fall 2012
Outline


1.   Why make CycleTracks?
2.   What does CycleTracks do?
3.   Who used CycleTracks and why?
4.   What data did we get from CycleTracks?
5.   What did we do with that data?
6.   Evolution and future of CycleTracks
1. Why CycleTracks?
Why CycleTracks?


Need to prioritize projects, including bike projects.
   Estimate a bike choice model that evaluated
     various bike infrastructure features
   Needed bike route choice data on a budget.
2. What does
CycleTracks do?
Enter personal data (optional)
Enter New Trip
Review Saved Trips
That’s it?


Bells and whistles could promote deviation from planned
 route.


     Features!
                                         Good Data.
       Flare!
                                           Yawn.
    More users!
3. Who used CycleTracks and Why?
        - User Recruitment
        - Participants
Participants: who gave
us data?
SF Participants: Fall 2009 to Spring 2010


                          CycleTracks    BATS
                            N-366       N=153   z-stat
Age
 Mean                         34         33      1.1

Gender
 Female                      21%        36%     -3.5
Cycling Frequency
 Daily                       60%
 Several Times/Week          34%
 Several Times/Month          7%
 Less than once a month       0%         N/A
4. What data did we get?
    - Data Quality
    - Data Summaries
Data Quality: some good, some bad
Urban Canyon Effect


                       Haight Ashbury


                  vs


      Downtown
GPS Signal at Beginning of Trip
Not on a Bike
Post Processing Warranted


  5,178 traces                    Gaussian
   497 users                      smoothing


                                  Activity & mode
                                  detection


                                                3,034 bike
                                  Map             stages
                              h
                                  matching       366 users

(Schüssler & Axhausen 2009)
5. What did we
do with the
CycleTracks
Data?
Matched Route Features to the Chosen Route…
…as well as to a set of routes that were not
chosen
What makes us choose one bike route over
another ?


                  Personal      Trip
                    Info      Features


      Route
                                     Which route
    Features of
                                        was
     Available           Route        chosen?
      Routes
                         Choice
                         Model
Estimation results

Attribute                       Coef.       SE    t-stat.    p-val.
Length (mi)                      --1.05    0.09   --11.80     0.00
Turns per mile                   --0.21    0.02   --12.15     0.00
Prop. wrong way                --13.30     0.67   --19.87     0.00
Prop. bike paths                   1.89    0.31       6.17    0.00
Prop. bike lanes                   2.15    0.12     17.69     0.00
  Cycling freq. < several per wk. 1.85     0.04     44.94     0.00
Prop. bike routes                  0.35    0.11       3.14    0.00
Avg. up-slope (ft/100ft)         --0.50    0.08     --6.35    0.00
  Female                         --0.96    0.22     --4.34    0.00
  Commute                        --0.90    0.11     --8.21    0.00
Log(path size)                     1.07    0.04     26.38     0.00

                    2,678 weighted observations, ρ2 = 0.28
Average Marginal Rates of Substitution


      MRS of Length on Street for   Value   Units
      Turns                         0.10    mi/turn
      Total Rise                    1.12    mi/100ft
      Length Wrong Way              4.02    None
      Length on Bike Paths          0.57    None
      Length on Bike Lanes          0.49    None
      Length on Bike Routes         0.92    None


      SAN FRANCISCO COUNTY TRANSPORTATION AUTHORITY    28
Updates to SF-CHAMP
  Synthesized                            Core, 3 iterations
  Population
                                         Work Location,
   Land Use                            Destination Choice,
                         Mode Choice    Tour Generation
   Networks
   Networks               Logsums
  +Bike Vars!                              Tour & Trip
                                          Mode Choice

Bike Route Choice Set                    Road & Transit
    Non-Motorized           Bike
    Generation &                          Assignment/
Skimming (Distances)      Logsums
      Skimming                             Skimming
Initial Road & Transit
     Assignment/
      Skimming
                                                              Final Bicycle
                                                              Assignment
        SAN FRANCISCO COUNTY TRANSPORTATION AUTHORITY
                                                                         29
Bike Accessibility: From 4th and King


      SAN FRANCISCO COUNTY TRANSPORTATION AUTHORITY   30
Bike Accessibility: To 4th and King


      SAN FRANCISCO COUNTY TRANSPORTATION AUTHORITY   31
Bike Logsums: From 4th and King
Effect of Bike Plan Build


     SAN FRANCISCO COUNTY TRANSPORTATION AUTHORITY   32
Bike Logsums: To 4th and King
Effect of Bike Plan Build


     SAN FRANCISCO COUNTY TRANSPORTATION AUTHORITY   33
Preliminary Results:
Tour Mode Choice Sensitivity

                    Tour Difference
   Daily Tours    v4.1 Harold           v4.3 Fury
   Bike            300      0.1%      1,300       0.9%
   Walk            300      0.0%        200       0.0%
   Transit          200      0.0%      -900     -0.1%
   Auto          -1,000     -0.0%      -600     -0.0%
   Total           -200     -0.0%         0      0.0%


      SAN FRANCISCO COUNTY TRANSPORTATION AUTHORITY      34
Preliminary Results:
Trip Mode Choice Sensitivity

                     Trip Difference
   Daily Tours    v4.1 Harold            v4.3 Fury
   Bike            500      0.1%       3,000       0.8%
   Walk          1,100      0.0%        -500      -0.0%
   Transit          850      0.0%        -600    -0.0%
   Auto          -2,400     -0.0%      -1,300    -0.0%
   Total              0      0.0%         600     0.0%


      SAN FRANCISCO COUNTY TRANSPORTATION AUTHORITY       35
SF-CHAMP Predicted Bike Trips


                                 Bikes / hour

                                       0        180
                                      20        360


SF-CHAMP v4.1 “Harold”
6. Evolution and
Future of
CycleTracks
All Open Source


                        •   GPL3 License
                        •   Code on GitHub
                        •   Fork us!


 www.github.com/sfcta
e.g. AggieTrack


  http://aggietrack.com
CycleTracks Works Everywhere…


We already have the database set up
Agencies can download “scrubbed” data


                                           Austin,TX


                             Monterey Bay, CA


                              …and more!
Title
Questions?

www.sfcta.org/cycletracks
Bike Accessibility: From Inner Sunset


      SAN FRANCISCO COUNTY TRANSPORTATION AUTHORITY   43
Bike Accessibility: To Inner Sunset


      SAN FRANCISCO COUNTY TRANSPORTATION AUTHORITY   44
Bike Logsums: From Inner Sunset
Effect of Bike Plan Build


     SAN FRANCISCO COUNTY TRANSPORTATION AUTHORITY   45
Bike Logsums: To Inner Sunset
Effect of Bike Plan Build


     SAN FRANCISCO COUNTY TRANSPORTATION AUTHORITY   46

Completing the Cycle: Incorporating CycleTracks into SF-CHAMP

  • 1.
    Completing the Cycle: Incorporating CycleTracks into SF-CHAMP Using technology to understand the needs of cyclists SAN FRANCISCO COUNTY TRANSPORTATION AUTHORITY Fall 2012
  • 2.
    Outline 1. Why make CycleTracks? 2. What does CycleTracks do? 3. Who used CycleTracks and why? 4. What data did we get from CycleTracks? 5. What did we do with that data? 6. Evolution and future of CycleTracks
  • 3.
  • 4.
    Why CycleTracks? Need toprioritize projects, including bike projects.  Estimate a bike choice model that evaluated various bike infrastructure features  Needed bike route choice data on a budget.
  • 5.
  • 6.
  • 7.
  • 8.
  • 9.
    That’s it? Bells andwhistles could promote deviation from planned route. Features! Good Data. Flare! Yawn. More users!
  • 10.
    3. Who usedCycleTracks and Why? - User Recruitment - Participants
  • 15.
  • 16.
    SF Participants: Fall2009 to Spring 2010 CycleTracks BATS N-366 N=153 z-stat Age Mean 34 33 1.1 Gender Female 21% 36% -3.5 Cycling Frequency Daily 60% Several Times/Week 34% Several Times/Month 7% Less than once a month 0% N/A
  • 17.
    4. What datadid we get? - Data Quality - Data Summaries
  • 18.
    Data Quality: somegood, some bad
  • 19.
    Urban Canyon Effect Haight Ashbury vs Downtown
  • 20.
    GPS Signal atBeginning of Trip
  • 21.
  • 22.
    Post Processing Warranted 5,178 traces Gaussian 497 users smoothing Activity & mode detection 3,034 bike Map stages h matching 366 users (Schüssler & Axhausen 2009)
  • 23.
    5. What didwe do with the CycleTracks Data?
  • 24.
    Matched Route Featuresto the Chosen Route…
  • 25.
    …as well asto a set of routes that were not chosen
  • 26.
    What makes uschoose one bike route over another ? Personal Trip Info Features Route Which route Features of was Available Route chosen? Routes Choice Model
  • 27.
    Estimation results Attribute Coef. SE t-stat. p-val. Length (mi) --1.05 0.09 --11.80 0.00 Turns per mile --0.21 0.02 --12.15 0.00 Prop. wrong way --13.30 0.67 --19.87 0.00 Prop. bike paths 1.89 0.31 6.17 0.00 Prop. bike lanes 2.15 0.12 17.69 0.00 Cycling freq. < several per wk. 1.85 0.04 44.94 0.00 Prop. bike routes 0.35 0.11 3.14 0.00 Avg. up-slope (ft/100ft) --0.50 0.08 --6.35 0.00 Female --0.96 0.22 --4.34 0.00 Commute --0.90 0.11 --8.21 0.00 Log(path size) 1.07 0.04 26.38 0.00 2,678 weighted observations, ρ2 = 0.28
  • 28.
    Average Marginal Ratesof Substitution MRS of Length on Street for Value Units Turns 0.10 mi/turn Total Rise 1.12 mi/100ft Length Wrong Way 4.02 None Length on Bike Paths 0.57 None Length on Bike Lanes 0.49 None Length on Bike Routes 0.92 None SAN FRANCISCO COUNTY TRANSPORTATION AUTHORITY 28
  • 29.
    Updates to SF-CHAMP Synthesized Core, 3 iterations Population Work Location, Land Use Destination Choice, Mode Choice Tour Generation Networks Networks Logsums +Bike Vars! Tour & Trip Mode Choice Bike Route Choice Set Road & Transit Non-Motorized Bike Generation & Assignment/ Skimming (Distances) Logsums Skimming Skimming Initial Road & Transit Assignment/ Skimming Final Bicycle Assignment SAN FRANCISCO COUNTY TRANSPORTATION AUTHORITY 29
  • 30.
    Bike Accessibility: From4th and King SAN FRANCISCO COUNTY TRANSPORTATION AUTHORITY 30
  • 31.
    Bike Accessibility: To4th and King SAN FRANCISCO COUNTY TRANSPORTATION AUTHORITY 31
  • 32.
    Bike Logsums: From4th and King Effect of Bike Plan Build SAN FRANCISCO COUNTY TRANSPORTATION AUTHORITY 32
  • 33.
    Bike Logsums: To4th and King Effect of Bike Plan Build SAN FRANCISCO COUNTY TRANSPORTATION AUTHORITY 33
  • 34.
    Preliminary Results: Tour ModeChoice Sensitivity Tour Difference Daily Tours v4.1 Harold v4.3 Fury Bike 300 0.1% 1,300 0.9% Walk 300 0.0% 200 0.0% Transit 200 0.0% -900 -0.1% Auto -1,000 -0.0% -600 -0.0% Total -200 -0.0% 0 0.0% SAN FRANCISCO COUNTY TRANSPORTATION AUTHORITY 34
  • 35.
    Preliminary Results: Trip ModeChoice Sensitivity Trip Difference Daily Tours v4.1 Harold v4.3 Fury Bike 500 0.1% 3,000 0.8% Walk 1,100 0.0% -500 -0.0% Transit 850 0.0% -600 -0.0% Auto -2,400 -0.0% -1,300 -0.0% Total 0 0.0% 600 0.0% SAN FRANCISCO COUNTY TRANSPORTATION AUTHORITY 35
  • 36.
    SF-CHAMP Predicted BikeTrips Bikes / hour 0 180 20 360 SF-CHAMP v4.1 “Harold”
  • 37.
  • 38.
    All Open Source • GPL3 License • Code on GitHub • Fork us! www.github.com/sfcta
  • 39.
    e.g. AggieTrack http://aggietrack.com
  • 40.
    CycleTracks Works Everywhere… Wealready have the database set up Agencies can download “scrubbed” data Austin,TX Monterey Bay, CA …and more!
  • 41.
  • 42.
  • 43.
    Bike Accessibility: FromInner Sunset SAN FRANCISCO COUNTY TRANSPORTATION AUTHORITY 43
  • 44.
    Bike Accessibility: ToInner Sunset SAN FRANCISCO COUNTY TRANSPORTATION AUTHORITY 44
  • 45.
    Bike Logsums: FromInner Sunset Effect of Bike Plan Build SAN FRANCISCO COUNTY TRANSPORTATION AUTHORITY 45
  • 46.
    Bike Logsums: ToInner Sunset Effect of Bike Plan Build SAN FRANCISCO COUNTY TRANSPORTATION AUTHORITY 46

Editor's Notes

  • #17 Here is a comparison of the demographics of the participants whose traces survived the data processing to the subpopulation from the Bay Area Travel Survey that reported a cycling trip in San Francisco. As you can see, the CycleTracks sample is over twice the size of BATS, which contained 50,000 households, illustrating why seeking a representative sample to study cycling is not feasible. But, our sample is biased. While the mean age in the two samples are not significantly different, our study does include a lower proportion of women at 21% compared to BATS’ 36%. While we don’t have a population to compare cycling frequency against, we also suspect that our sample is biased toward frequent cyclists. The bias is a limited problem because we were able to account for it with interaction variables in model estimation.
  • #23 Schuessler, Nadine and Kay W. Axhausen. “Processing Raw Data from Global Positioning Systems Without Additional Information,” Transportation Research Record : Journal of the Transportation Research Board, No 2105. Washington D.C., 2009, pp. 28-35. http://trb.metapress.com/content/tv306m812140p330/
  • #25 SharrowsCongestionNight-timeNo bike lanesCapacity of roadwayBike laneBike pathCrimeWeather
  • #26 We use a “Doubly Stochastic Route Search” to find other potential routes in the available choice setBovy, P. &amp; Fiorenzo-Catalano, S. (2007), “Stochastic route choice set generation: behavioral and probabilistic foundations,” Transportmetrica 3, 173-189.
  • #28 Here are the coefficients from the path size multinomial logit route choice model. Obviously, cyclists prefer shorter routes, with fewer turns, and don’t go the wrong way down a one way street unneccessarily. The coeficients on the proportions of the different bicycle facility types are measured on the same scale, and so represent the relative preferences for these treatments. Bike lanes are preferred the most, especially by infrequent cyclists, a preliminary indication that installing bicycle lanes may attract new cyclists. Hill climbing is especially disfavored by women and on commute trips. The path size variable corrects for the correlation between alternatives due to route overlap. The coefficient is not significantly different from the theoretically correct value in a model with a scale parameter of one, another indication of the quality with which our choice sets represent the consideration sets. Traffic volume, vehicle speed, number of lanes, crime, and rain had no effect.
  • #29 The average cyclist will Avoid a turn if it costs no more than one-tenth of a mileAvoid climbing a hill 100 feet tall as long as the detour is less than roughly one mileAvoid traveling the wrong way down a one-way street unless doing so saves more than four times the distance elsewhereAdd a mile on bike lanes in exchange for only half a mile on ordinary roadsBike paths vs Bike Lanes could be due to limited off-street bike path facilities in SF and other factors that make them less attractive (although Krizek also found similar preferences).Mention the other variables that were significant in estimation: females and work-commuters were more hill-averse
  • #31 Talking points/or circle/or flip through
  • #33 Yellow doesn’t stand out enough
  • #35 Not apples to apples: the bike network coded in Harold was much more aggressive. That said, the results are still interesting:Harold has an auto-stick, but no carrot, so the mode switchers switch to whatever is best for them, which happens to be pretty even across bike, walk and transit.Fury has a very strong bike-carrot, and walk modes benefit mildly from the road diets. Biking draws from auto but also transit because of tour distance.
  • #36 Harold again has the auto stick. Walk trips are up because of transit tours being up.Fury has the bike carrot. Walk trips are down (despite the walk tours being up) because of the transit tours being down – many walk trips are part of a transit tour.
  • #39 Our code is open source, and there are a number of agencies who have tried their hand at modifying it to their own needs.
  • #44 Back pocket all four of these?