Download as PDF, PPTX


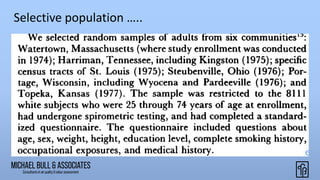


Dr. Michael Bull examines the implications of air pollution on health, particularly through the lens of the six cities study, which demonstrated a correlation between fine particle exposure and increased mortality. He critiques the assumptions behind air quality measurement and model verification, arguing that inherent variability and biases compromise their accuracy. Ultimately, he questions whether the established scientific beliefs adequately represent causation in the context of air pollution and its effects.


