Financial Analysis - Skanska AB offers construction related and project development services. The Company focuses on construction of housing, commercial buildings, roads, and railways, as well as develops
•
2 likes•1,242 views

Financial Analysis - Skanska AB offers construction related and project development services. The Company focuses on construction of housing, commercial buildings, roads, and railways, as well as develops

Recommended
Recommended
More Related Content
More from BCV
More from BCV (20)
Recently uploaded
Recently uploaded (20)
Financial Analysis - Skanska AB offers construction related and project development services. The Company focuses on construction of housing, commercial buildings, roads, and railways, as well as develops
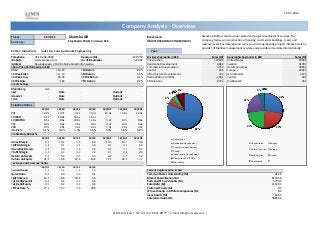
- 1. 19.03.2013 Company Analysis - Overview Ticker: SKAB SS Skanska AB Benchmark: Skanska AB offers construction related and project development services. The Stockholm: SKAB, Currency: SEK OMX STOCKHOLM 30 INDEX (OMX) Company focuses on construction of housing, commercial buildings, roads, and Currency: railways, as well as develops and carries out civil engineering projects. Skanska is also a provider of facilities management services and provides all services internationally. Sector: Industrials Industry: Construction & Engineering Year: Telephone 46-10-448-0000 Revenue (M) 129'350 Business Segments in SEK Sales (M) Geographic Segments in SEK Sales (M) Website www.skanska.com No of Employees 56'618 Construction 124509 United States 40038 Address Rasundavagen 2 169 83 Solna Stockholm Sweden Residential Development 8682 Sweden 31784 Share Price Performance in SEK Commercial Development 6742 Nordic Countries 30652 Price 116.10 1M Return 0.6% Central 498 Europe 29023 52 Week High 117.10 6M Return 5.5% Infrastructure Development 242 Latin America 8224 52 Week Low 93.30 52 Wk Return 3.1% Reconciliation to IFRSs -2581 Central 498 52 Wk Beta 0.83 YTD Return 9.3% Eliminations -8742 Unallocated 454 Credit Ratings Bloomberg IG2 6% 0% 0% 0% S&P - Date - Outlook - 2% 6% 0% 4% Moody's - Date - Outlook - 28% Fitch - Date - Outlook - 6% 21% Valuation Ratios 12/09 12/10 12/11 12/12 12/13E 12/14E 12/15E P/E 12.0x 13.7x 6.2x 15.3x 13.9x 13.0x 12.4x EV/EBIT 8.2x 10.9x 14.4x 16.1x - - - EV/EBITDA 6.5x 8.6x 10.3x 11.0x 9.2x 8.7x 8.6x P/S 0.4x 0.4x 0.4x 0.3x 0.4x 0.4x 0.4x P/B 2.5x 2.6x 2.4x 2.3x 2.4x 2.3x 2.2x 22% 23% 82% Div Yield 5.1% 9.0% 5.3% 5.6% 5.4% 5.6% 5.8% Profitability Ratios % 12/09 12/10 12/11 12/12 12/13E 12/14E 12/15E Construction Gross Margin 9.9 10.2 9.5 8.9 10.4 10.5 9.8 Residential Development United States Sweden EBITDA Margin 5.1 5.1 4.1 3.4 4.7 4.9 5.0 Commercial Development Operating Margin 4.0 4.0 2.9 2.4 3.5 3.7 3.7 Nordic Countries Europe Central Profit Margin 3.0 3.3 6.4 2.2 2.7 2.8 2.9 Infrastructure Development Latin America Central Return on Assets 5.0 5.0 9.5 3.3 4.8 5.0 5.0 Return on Equity 21.6 19.8 37.9 14.8 17.4 18.1 17.7 Reconciliation to IFRSs Unallocated Eliminations Leverage and Coverage Ratios 12/09 12/10 12/11 12/12 Current Ratio 1.2 1.2 1.1 1.2 Current Capitalization in SEK Quick Ratio 0.5 0.4 0.4 0.1 Common Shares Outstanding (M) 411.8 EBIT/Interest 12.4 18.8 10.3 6.6 Market Capitalization (M) 51355.8 Tot Debt/Capital 0.2 0.2 0.3 0.4 Cash and ST Investments (M) 5770.0 Tot Debt/Equity 0.3 0.2 0.4 0.6 Total Debt (M) 11103.0 Eff Tax Rate % 27.2 25.7 9.9 24.4 Preferred Equity (M) 0.0 LT Investments in Affiliate Companies (M) 0.0 Investments (M) 166.0 Enterprise Value (M) 56854.8 Q.M.S Advisors | tel: +41 (0)78 922 08 77 | e-mail: info@qmsadv.com |
- 2. Company Analysis - Analysts Ratings Skanska AB Target price in SEK Broker Recommendation Buy and Sell Recommendations vs Price and Target Price Price Brokers' Target Price 140 140 100% 20% 120 120 25% 31% 31% 31% 31% 35% 35% 80% 41% 44% 47% 47% 100 100 80 60% 80 47% 38% 60 44% 44% 44% 44% 60 40% 47% 47% 35% 39% 35% 40 40 53% 20 20% 38% 33% 20 25% 25% 25% 25% 24% 0 18% 18% 17% 18% Nordea Equity S&P Capital IQ DNB Markets Markets CA Cheuvreux Carnegie ABG Sundal Berenberg Swedbank Goldman HSBC SEB Enskilda Dimensions Deutsche Bank Handelsbanken Danske Sachs Research Bank 0% 0 Collier 0% EVA mars.12 avr.12 mai.12 juin.12 juil.12 août.12 sept.12 oct.12 nov.12 déc.12 janv.13 févr.13 Buy Hold Sell Price Target Price Date Buy Hold Sell Date Price Target Price Broker Analyst Recommendation Target Date 28-Feb-13 0% 53% 47% 19-Mar-13 116.10 107.77 Carnegie TOBIAS KAJ hold 27-Feb-13 31-Jan-13 18% 35% 47% 18-Mar-13 116.10 107.77 Berenberg Bank CHRIS MOORE sell 99.00 11-Feb-13 31-Dec-12 17% 39% 44% 15-Mar-13 116.30 107.57 Nordea Equity Research JONAS L ANDERSSON hold 118.00 8-Feb-13 30-Nov-12 24% 35% 41% 14-Mar-13 116.10 107.57 Swedbank NICLAS HOGLUND neutral 115.00 8-Feb-13 31-Oct-12 18% 47% 35% 13-Mar-13 115.60 107.57 S&P Capital IQ JAWAHAR HINGORANI hold 115.00 8-Feb-13 28-Sep-12 18% 47% 35% 12-Mar-13 116.00 107.57 DNB Markets SIMEN MORTENSEN hold 120.00 8-Feb-13 31-Aug-12 25% 44% 31% 11-Mar-13 116.90 107.36 Danske Markets PETER TRIGARSZKY sell 104.00 8-Feb-13 31-Jul-12 25% 44% 31% 8-Mar-13 116.70 107.36 ABG Sundal Collier FREDRIC CYON hold 113.00 7-Feb-13 29-Jun-12 38% 38% 25% 7-Mar-13 116.00 107.36 SEB Enskilda STEFAN ANDERSSON hold 115.00 7-Feb-13 31-May-12 33% 47% 20% 6-Mar-13 115.90 107.36 Handelsbanken ALBIN SANDBERG reduce 104.00 7-Feb-13 30-Apr-12 25% 44% 31% 5-Mar-13 115.30 107.36 EVA Dimensions CRAIG STERLING underweight 17-Jan-13 30-Mar-12 25% 44% 31% 4-Mar-13 114.70 107.36 Goldman Sachs WILL MORGAN Sell/Neutral 108.00 14-Jan-13 1-Mar-13 114.50 107.36 Deutsche Bank MANU RIMPELA hold 112.00 21-Dec-12 28-Feb-13 114.80 107.36 HSBC TOBIAS LOSKAMP underweight 95.00 21-Dec-12 27-Feb-13 114.80 107.36 CA Cheuvreux BJORN GUSTAFSSON underperform 105.00 17-Dec-12 26-Feb-13 114.00 107.36 25-Feb-13 115.70 107.36 22-Feb-13 116.10 107.36 21-Feb-13 114.60 107.36 20-Feb-13 116.00 107.36 19-Feb-13 115.40 107.36 18-Feb-13 114.40 107.36 15-Feb-13 113.80 107.36 14-Feb-13 113.60 107.36 13-Feb-13 113.60 107.36 12-Feb-13 111.80 107.36 11-Feb-13 111.60 107.36 8-Feb-13 111.70 107.36 7-Feb-13 110.60 106.64 6-Feb-13 105.40 105.71 Q.M.S Advisors | tel: +41 (0)78 922 08 77 | e-mail: info@qmsadv.com |
- 3. 19.03.2013 Skanska AB Company Analysis - Ownership Ownership Type Ownership Statistics Geographic Ownership Distribution Geographic Ownership 0% Shares Outstanding (M) 411.8 15% Unknown Country 52.92% 1% 0%0% 0% Float Sweden 41.50% 3% 1% Short Interest (M) United States 3.11% Short Interest as % of Float Luxembourg 0.85% Days to Cover Shorts Britain 0.38% Institutional Ownership 84.59% Japan 0.32% 53% Retail Ownership 15.04% Ireland 0.27% Insider Ownership 0.37% Others 0.65% 42% 85% Institutional Ownership Distribution Other 54.08% Investment Advisor 23.36% Pension Fund (Erisa) 9.30% Unknown Country Sweden United States Institutional Ownership Retail Ownership Insider Ownership Holding Company 5.89% Luxembourg Britain Japan Pricing data is in SEK Others 7.38% Ireland Others Top 20 Owners: TOP 20 ALL Institutional Ownership Holder Name Position Position Change Market Value % of Ownership Report Date Source Country AMF FORSAKRING 191'244'600 0 22'203'498'060 45.54% 30.09.2012 Research 7% ALECTA PENSIONSFORSA 33'870'000 0 3'932'307'000 8.07% 30.09.2012 Research SWEDEN 6% INDUSTRIVARDEN AB 21'443'238 0 2'489'559'932 5.11% 30.09.2012 Research SWEDEN NORDEA FONDER AB/SWE 16'968'154 404'852 1'970'002'679 4.04% 28.02.2013 MF-AGG SWEDEN SWEDBANK ROBUR FONDE 14'688'599 0 1'705'346'344 3.50% 30.09.2012 Research SWEDEN 9% NORDEA FONDER AB 14'022'076 0 1'627'963'024 3.34% 30.09.2012 Research SWEDEN 55% LUNDBERGS 7'550'000 0 876'555'000 1.80% 30.09.2012 Research SWEDEN FOLKSAM GROUP 6'858'966 0 796'325'953 1.63% 30.09.2012 Research SWEDEN VANGUARD GROUP INC 6'755'570 132'140 784'321'677 1.61% 31.12.2012 MF-AGG UNITED STATES 23% AMF FONDER AB 6'639'600 0 770'857'560 1.58% 31.12.2012 MF-AGG SWEDEN CARNEGIE FONDER AB/S 6'100'000 0 708'210'000 1.45% 30.09.2012 Research SWEDEN LANSFORSAKRINGAR GRO 5'762'867 0 669'068'859 1.37% 30.09.2012 Research SWEDEN DIDNER & GERGE FONDE 5'450'000 0 632'745'000 1.30% 30.09.2012 Research SWEDEN SEB 4'866'216 1'148'562 564'967'678 1.16% 31.12.2012 ULT-AGG Other Investment Advisor Pension Fund (Erisa) Holding Company Others FOLKSAM LO FOND AB 4'760'326 -12'738 552'673'849 1.13% 31.12.2012 MF-AGG SWEDEN HANDELSBANKEN FONDER 3'970'956 -99'436 461'027'992 0.95% 28.02.2013 MF-AGG SWEDEN LANSFORSAKRINGAR FON 3'944'877 -495'581 458'000'220 0.94% 31.12.2012 MF-AGG SWEDEN SPP FONDER AB 3'126'831 98'366 363'025'079 0.74% 28.02.2013 MF-AGG SWEDEN MARSHALL WACE LLP -2'099'516 0 -243'753'808 -0.50% 15.03.2013 Short BRITAIN XACT FONDER AB 1'662'776 218'976 193'048'294 0.40% 28.02.2013 MF-AGG SWEDEN Top 5 Insiders: Holder Name Position Position Change Market Value % of Ownership Report Date Source LUNDBERG FREDRIK 1'000'000 116'100'000 0.24% 31.12.2011 Co File KARLSTROM JOHAN 157'305 18'263'111 0.04% 31.12.2011 Co File GRAHAM STUART E 95'679 11'108'332 0.02% 31.12.2011 Co File WILLIAMSON MATS WILLIAM 82'426 9'569'659 0.02% 31.12.2011 Co File WIECZOREK ROMAN 45'348 5'264'903 0.01% 31.12.2011 Co File Q.M.S Advisors | tel: +41 (0)78 922 08 77 | e-mail: info@qmsadv.com |
- 4. Company Analysis - Financials I/IV Skanska AB Financial information is in SEK (M) Equivalent Estimates Periodicity: Fiscal Year 12/02 12/03 12/04 12/05 12/06 12/07 12/08 12/09 12/10 12/11 12/12 12/13E 12/14E 12/15E Income Statement Revenue 142'033 132'879 116'257 124'106 125'603 138'781 143'674 139'124 122'224 118'734 129'350 129'703 132'875 134'166 - Cost of Goods Sold 106'696 112'952 114'220 125'807 131'532 125'417 109'774 107'410 117'789 Gross Income 9'561 11'154 11'383 12'974 12'142 13'707 12'450 11'324 11'561 13'424 13'919 13'148 - Selling, General & Admin Expenses 140'767 128'440 6'343 6'593 6'985 7'970 8'932 8'078 7'533 7'853 8'508 (Research & Dev Costs) 57 55 48 47 72 58 43 42 Operating Income 1'266 4'439 3'218 4'561 4'398 5'004 3'210 5'629 4'917 3'471 3'053 4'565 4'911 4'933 - Interest Expense 1'026 685 332 137 73 165 264 265 215 204 312 - Foreign Exchange Losses (Gains) 51 6 -17 28 -37 43 50 54 12 -11 - Net Non-Operating Losses (Gains) 116 -324 -457 -547 -623 -871 -1'514 -490 -733 -5'147 -1'043 Pretax Income 73 4'072 3'360 4'943 4'985 5'667 4'410 5'800 5'423 8'425 3'784 4'843 5'062 5'160 - Income Tax Expense 856 1'303 1'141 1'230 1'330 1'546 1'253 1'579 1'395 830 923 Income Before XO Items -783 2'769 2'219 3'713 3'655 4'121 3'157 4'221 4'028 7'595 2'861 - Extraordinary Loss Net of Tax 0 0 -967 -177 0 0 0 0 0 0 0 - Minority Interests 54 8 13 11 20 25 55 5 6 6 8 Diluted EPS Before XO Items Net Income Adjusted* -837 2'761 2'648 3'702 3'639 4'096 3'719 3'621 4'022 2'989 2'853 3'490 3'683 3'825 EPS Adjusted (2.00) 6.60 6.33 8.84 8.69 9.79 8.92 8.72 9.76 7.26 6.92 8.35 8.94 9.36 Dividends Per Share 2.00 3.00 4.00 6.50 8.25 5.25 5.25 6.25 12.00 6.00 6.00 6.27 6.50 6.76 Payout Ratio % 45.5 75.9 73.5 95.0 84.3 70.4 61.2 122.7 32.5 86.6 0.75 0.73 0.72 Total Shares Outstanding 419 419 419 419 419 419 416 409 408 412 412 Diluted Shares Outstanding 419 419 419 419 419 419 418 417 416 415 414 EBITDA 3'609 6'247 4'828 5'820 5'545 6'276 4'521 7'106 6'224 4'864 4'462 6'152 6'526 6'646 *Net income excludes extraordinary gains and losses and one-time charges. Q.M.S Advisors | tel: +41 (0)78 922 08 77 | e-mail: info@qmsadv.com |
- 5. Company Analysis - Financials II/IV Periodicity: 12/02 12/03 12/04 12/05 12/06 12/07 12/08 12/09 12/10 12/11 12/12 12/13E 12/14E 12/15E Balance Sheet Total Current Assets 58602 50345 49508 55918 55250 64097 67522 67753 62166 64277 69715 + Cash & Near Cash Items 5'460 6'819 5'815 10'583 8'839 14'209 7'881 9'409 6'654 5'309 5'770 + Short Term Investments 303 218 3'053 3'095 2'131 + Accounts & Notes Receivable 21'499 18'481 15'949 18'941 18'995 20'407 18'765 17'069 18'044 + Inventories 865 828 610 501 484 769 901 835 926 1'014 1'079 + Other Current Assets 30'475 23'999 24'081 22'798 24'801 49'119 38'333 38'744 37'517 39'910 62'866 Total Long-Term Assets 18'146 16'391 13'573 15'393 16'057 14'844 15'956 16'012 15'546 18'493 18'520 + Long Term Investments 547 76 0 0 0 Gross Fixed Assets 18'024 16'506 14'528 14'924 15'104 17'002 18'715 18'794 18'291 20'388 Accumulated Depreciation 10'216 9'778 9'021 9'681 9'647 11'029 11'796 12'491 12'385 13'370 + Net Fixed Assets 7'808 6'728 5'507 5'243 5'457 5'973 6'919 6'303 5'906 7'018 7'938 + Other Long Term Assets 9'791 9'587 8'066 10'150 10'600 8'871 9'037 9'709 9'640 11'475 10'582 Total Current Liabilities 42'009 36'795 39'676 44'919 45'364 53'948 58'206 57'879 52'932 57'151 59'385 + Accounts Payable 16'540 14'019 12'438 14'343 13'861 14'026 12'536 10'716 11'684 + Short Term Borrowings 1'280 1'006 1'080 1'396 2'703 2'081 3'706 2'786 5'563 6'283 + Other Short Term Liabilities 24'189 22'776 26'232 29'496 30'107 51'245 42'099 41'637 39'430 39'904 53'102 Total Long Term Liabilities 20'224 15'574 7'037 7'805 6'606 4'269 6'023 5'719 3'988 6'036 9'497 + Long Term Borrowings 13'494 5'774 3'046 2'424 2'039 955 1'077 1'913 1'107 1'335 4'820 + Other Long Term Borrowings 6'730 9'800 3'991 5'381 4'567 3'314 4'946 3'806 2'881 4'701 4'677 Total Liabilities 62'233 52'369 46'713 52'724 51'970 58'217 64'229 63'598 56'920 63'187 68'882 + Long Preferred Equity 0 0 0 0 0 0 0 0 0 0 + Minority Interest 298 200 117 133 147 210 178 170 122 170 166 + Share Capital & APIC 2'685 2'902 1'786 3'014 1'585 1'585 1'585 1'771 1'979 2'198 + Retained Earnings & Other Equity 11'532 11'267 14'465 15'440 17'605 18'929 17'486 18'226 18'691 17'215 19'187 Total Shareholders Equity 14'515 14'369 16'368 18'587 19'337 20'724 19'249 20'167 20'792 19'583 19'353 Total Liabilities & Equity 76'748 66'738 63'081 71'311 71'307 78'941 83'478 83'765 77'712 82'770 88'235 Book Value Per Share 33.97 33.85 38.83 44.09 45.85 49.01 45.87 48.91 50.72 47.17 46.59 47.63 49.92 53.92 Tangible Book Value Per Share 20.01 22.58 28.23 32.63 33.35 36.49 33.25 37.73 40.24 34.61 34.28 Q.M.S Advisors | tel: +41 (0)78 922 08 77 | e-mail: info@qmsadv.com |
- 6. Company Analysis - Financials III/IV Periodicity: 12/02 12/03 12/04 12/05 12/06 12/07 12/08 12/09 12/10 12/11 12/12 12/13E 12/14E 12/15E Cash Flows Net Income -837 2'761 3'173 3'879 3'635 4'096 3'102 4'216 4'022 7'589 2'853 3'435 3'718 3'904 + Depreciation & Amortization 2'343 1'808 1'610 1'259 1'147 1'272 1'311 1'477 1'307 1'393 1'409 + Other Non-Cash Adjustments 576 -1'195 -3'786 -3'274 -2'310 -2'174 -2'792 -1'183 -2'442 -7'408 -4'353 + Changes in Non-Cash Capital 426 8'545 5'522 4'843 1'245 5'905 -1'067 3'075 3'351 -1'329 Cash From Operating Activities 2'508 11'919 6'519 6'707 3'717 9'099 554 7'585 6'238 245 -91 + Disposal of Fixed Assets 522 381 641 648 688 685 1'920 538 643 6'006 + Capital Expenditures -1'636 -1'309 -1'319 -1'931 -2'014 -1'967 -2'538 -1'718 -2'030 -3'194 -2'663 -2'588 -2'989 + Increase in Investments -41 10 -7 -3 -2'068 -3'201 + Decrease in Investments 351 433 491 42 791 1'986 + Other Investing Activities -2'207 -1'444 1'400 921 -597 51 -1'300 -1'951 -2'463 -1'894 -1'193 Cash From Investing Activities -3'011 -1'929 1'206 -323 -3'200 -2'446 -1'918 -3'131 -3'850 918 -1'193 + Dividends Paid -1'256 -837 -1'256 -1'674 -2'721 -3'453 -3'448 -2'185 -2'582 -4'945 + Change in Short Term Borrowings 0 + Increase in Long Term Borrowings 2'614 694 410 912 595 295 1'333 473 3'443 + Decrease in Long Term Borrowings -3'586 -6'808 -5'186 -1'397 -1'123 -951 -2'426 -1'269 -2'445 -677 + Increase in Capital Stocks 0 + Decrease in Capital Stocks 0 -271 -355 -252 -184 + Other Financing Activities -562 -457 -56 -85 72 115 274 -280 -82 -75 1'872 Cash From Financing Activities -2'790 -8'102 -5'804 -2'746 -2'860 -3'694 -5'576 -2'756 -4'888 -2'438 1'872 Net Changes in Cash -3'293 1'888 1'921 3'638 -2'343 2'959 -6'940 1'698 -2'500 -1'275 588 Free Cash Flow (CFO-CAPEX) 872 10'610 5'200 4'776 1'703 7'132 -1'984 5'867 4'208 -2'949 1'727 2'064 1'228 Free Cash Flow To Firm -10'133 11'076 5'419 4'879 1'757 7'252 -1'795 6'060 4'368 -2'765 Free Cash Flow To Equity 422 4'437 2'180 7'461 -2'195 6'469 2'879 5'823 Free Cash Flow per Share 2.08 25.35 12.42 11.41 4.07 17.04 -4.76 14.14 10.21 -7.16 Q.M.S Advisors | tel: +41 (0)78 922 08 77 | e-mail: info@qmsadv.com |
- 7. Company Analysis - Financials IV/IV Periodicity: 12/02 12/03 12/04 12/05 12/06 12/07 12/08 12/09 12/10 12/11 12/12 12/13E 12/14E 12/15E Ratio Analysis Valuation Ratios Price Earnings 9.6x 15.1x 13.7x 15.5x 12.5x 10.4x 12.0x 13.7x 6.2x 15.3x 13.9x 13.0x 12.4x EV to EBIT 24.0x 5.7x 8.8x 8.9x 11.2x 8.1x 8.6x 8.2x 10.9x 14.4x 16.1x EV to EBITDA 8.4x 4.1x 5.9x 7.0x 8.9x 6.5x 6.1x 6.5x 8.6x 10.3x 11.0x 9.2x 8.7x 8.6x Price to Sales 0.2x 0.2x 0.3x 0.4x 0.4x 0.4x 0.2x 0.4x 0.4x 0.4x 0.3x 0.4x 0.4x 0.4x Price to Book 1.5x 1.9x 2.1x 2.7x 2.9x 2.5x 1.7x 2.5x 2.6x 2.4x 2.3x 2.4x 2.3x 2.2x Dividend Yield 3.9% 4.7% 5.0% 5.4% 6.1% 4.3% 6.8% 5.1% 9.0% 5.3% 5.6% 5.4% 5.6% 5.8% Profitability Ratios Gross Margin 8.2% 9.0% 9.1% 9.3% 8.5% 9.9% 10.2% 9.5% 8.9% 10.4% 10.5% 9.8% EBITDA Margin 2.5% 4.7% 4.2% 4.7% 4.4% 4.5% 3.1% 5.1% 5.1% 4.1% 3.4% 4.7% 4.9% 5.0% Operating Margin 0.9% 3.3% 2.8% 3.7% 3.5% 3.6% 2.2% 4.0% 4.0% 2.9% 2.4% 3.5% 3.7% 3.7% Profit Margin -0.6% 2.1% 2.7% 3.1% 2.9% 3.0% 2.2% 3.0% 3.3% 6.4% 2.2% 2.7% 2.8% 2.9% Return on Assets -1.0% 3.8% 4.9% 5.8% 5.1% 5.5% 3.8% 5.0% 5.0% 9.5% 3.3% 4.8% 5.0% 5.0% Return on Equity -5.2% 19.5% 20.9% 22.4% 19.3% 20.6% 15.7% 21.6% 19.8% 37.9% 14.8% 17.4% 18.1% 17.7% Leverage & Coverage Ratios Current Ratio 1.39 1.37 1.25 1.24 1.22 1.19 1.16 1.17 1.17 1.12 1.17 Quick Ratio 0.65 0.69 0.63 0.73 0.66 0.26 0.49 0.49 0.45 0.41 0.10 Interest Coverage Ratio (EBIT/I) 1.08 5.56 9.69 33.29 60.25 11.07 7.02 12.43 18.84 10.27 6.59 Tot Debt/Capital 0.50 0.29 0.20 0.16 0.15 0.15 0.14 0.22 0.16 0.26 0.36 Tot Debt/Equity 1.02 0.40 0.25 0.19 0.18 0.18 0.16 0.28 0.19 0.35 0.57 Others Asset Turnover 1.67 1.85 1.79 1.85 1.76 1.85 1.77 1.66 1.51 1.48 1.51 Accounts Receivable Turnover 6.09 6.65 6.75 7.11 6.62 7.10 6.82 6.76 Accounts Payable Turnover 8.05 8.43 8.10 9.44 9.45 9.60 Inventory Turnover 148.39 203.33 231.92 200.81 157.52 144.49 124.67 110.73 112.56 Effective Tax Rate 1172.6% 32.0% 34.0% 24.9% 26.7% 27.3% 28.4% 27.2% 25.7% 9.9% 24.4% Q.M.S Advisors | tel: +41 (0)78 922 08 77 | e-mail: info@qmsadv.com |
- 8. Company Analysis - Peers Comparision JACOBS ENGIN SKANSKA AB-B HOCHTIEF AG VINCI SA BILFINGER SE EIFFAGE FLUOR CORP BOUYGUES SA FOSTER WHEELER GRANITE CONSTR TUTOR PERINI COR COLAS SA NCC AB-B JM AB PEAB AB GRP Latest Fiscal Year: 12/2012 12/2012 12/2012 12/2012 12/2012 12/2012 12/2012 12/2012 09/2012 12/2012 12/2012 12/2012 12/2011 12/2012 12/2012 52-Week High 120.00 55.65 40.68 82.43 37.75 66.67 24.33 27.13 54.23 37.74 19.08 137.99 171.20 161.00 39.35 52-Week High Date 19.03.2012 27.02.2013 19.03.2012 20.02.2013 10.01.2013 28.01.2013 19.03.2012 28.01.2013 18.03.2013 20.02.2013 19.02.2013 02.04.2012 08.03.2013 11.03.2013 12.03.2013 52-Week Low 93.30 34.64 31.23 58.82 20.53 44.99 17.54 15.26 33.61 21.38 9.21 96.00 110.30 106.75 28.91 52-Week Low Date 01.06.2012 06.09.2012 01.06.2012 05.06.2012 26.07.2012 25.06.2012 16.11.2012 12.07.2012 25.06.2012 04.06.2012 07.08.2012 15.05.2012 14.06.2012 21.11.2012 04.09.2012 Daily Volume 706'615 29'127 366'121 19'967 23'003 1'506'224 442'593 1'655'988 1'237'601 166'061 381'500 36 63'664 26'076 21'129 Current Price (3/dd/yy) 116.10 54.46 35.45 82.12 35.43 63.55 22.27 22.57 54.05 30.77 18.26 120.55 165.10 152.00 38.04 52-Week High % Change -3.3% -2.1% -12.9% -0.4% -6.2% -4.7% -8.5% -16.8% -0.3% -18.5% -4.3% -12.6% -3.6% -5.6% -3.3% 52-Week Low % Change 24.4% 57.2% 13.5% 39.6% 72.6% 41.3% 27.0% 47.9% 60.8% 43.9% 98.3% 25.6% 49.7% 42.4% 31.6% Total Common Shares (M) 411.8 73.6 536.2 46.0 85.6 162.4 324.0 104.4 129.9 38.7 47.6 32.7 108.0 80.5 295.0 Market Capitalization 51'356 4'193 20'544 3'780 3'088 10'348 7'108 2'358 7'046 1'192 868 3'937 17'912 12'718 11'262 Total Debt 11'103.0 4'456.5 20'193.8 1'180.9 16'112.0 541.0 8'642.0 137.7 528.3 290.1 737.1 404.0 9'243.0 877.0 8'633.0 Preferred Stock - - - - - - - - - - - - - - - Minority Interest 166.0 1'603.4 735.4 8.0 (1.0) 85.8 1'500.0 43.4 36.4 41.9 - 34.0 15.0 - - Cash and Equivalents 5'770.0 3'143.6 6'516.1 1'087.2 2'402.0 2'610.0 4'487.0 582.3 1'032.5 433.4 168.1 446.0 2'802.0 2'475.0 439.0 Enterprise Value 56'855 7'110 34'957 3'881 17'195 8'365 12'763 1'957 6'370 1'090 1'437 5'039 24'368 11'120 19'456 Valuation Total Revenue LFY 129'350.0 25'527.7 39'183.2 8'508.8 14'000.0 27'577.1 33'547.0 3'414.6 10'893.8 2'083.0 4'111.5 13'036.0 57'227.0 12'480.0 46'840.0 LTM 129'350.0 25'527.7 38'633.6 8'508.8 14'000.0 27'577.1 33'547.0 3'414.6 11'021.7 2'083.0 4'111.5 13'036.0 57'226.0 12'480.0 46'840.0 CY+1 129'702.9 26'295.3 38'898.6 8'788.6 14'226.8 29'087.4 33'516.2 3'778.3 11'868.1 2'507.0 4'535.0 - 56'057.0 12'853.4 46'588.9 CY+2 132'874.7 27'382.4 39'687.3 9'209.0 14'569.6 30'313.9 33'717.1 4'291.7 13'149.6 2'718.8 4'875.7 - 58'170.9 13'674.2 47'519.4 EV/Total Revenue LFY 0.4x 0.2x 0.9x 0.4x 1.2x 0.3x 0.4x 0.6x 0.4x 0.6x 0.3x 0.3x 0.4x 0.6x 0.4x LTM 0.4x 0.2x 0.9x 0.4x 1.2x 0.3x 0.4x 0.6x 0.4x 0.6x 0.3x 0.4x 0.4x 0.6x 0.4x CY+1 0.4x 0.3x 0.9x 0.4x 1.1x 0.3x 0.4x 0.5x 0.5x 0.5x 0.4x - 0.4x 0.9x 0.4x CY+2 0.4x 0.2x 0.8x 0.4x 1.1x 0.3x 0.4x 0.4x 0.4x 0.4x 0.3x - 0.4x 0.8x 0.4x EBITDA LFY 4'462.0 1'477.3 5'507.8 577.5 1'939.0 946.4 2'890.0 309.2 696.9 105.8 216.2 932.0 3'156.0 1'492.0 1'885.0 LTM 4'462.0 1'477.3 5'453.4 577.5 1'983.0 946.4 2'890.0 309.2 714.5 108.3 216.2 891.0 3'155.0 - - CY+1 6'151.7 1'639.9 5'534.1 582.0 2'110.2 1'345.9 2'884.9 272.1 789.1 177.4 258.3 - 3'013.1 1'460.8 2'503.6 CY+2 6'526.5 1'788.4 5'693.7 624.0 2'194.4 1'482.9 2'939.0 338.2 869.7 223.6 295.0 - 3'145.4 1'618.2 2'709.5 EV/EBITDA LFY 11.0x 4.2x 6.1x 6.0x 8.4x 8.0x 4.5x 6.9x 6.8x 11.4x 5.6x 4.8x 6.7x 5.2x 9.2x LTM 11.0x 4.2x 6.2x 6.0x 8.2x 8.0x 4.5x 6.9x 6.7x 11.1x 5.6x 5.0x 6.7x - - CY+1 8.7x 4.2x 6.1x 6.4x 7.7x 6.2x 4.6x 6.9x 7.9x 6.5x 6.2x - 8.0x 7.9x 7.2x CY+2 8.2x 3.8x 5.7x 5.8x 7.2x 5.3x 4.5x 5.2x 6.7x 5.1x 5.4x - 7.7x 6.9x 6.5x EPS LFY - 1.41 3.52 6.23 2.49 4.28 2.00 1.55 2.91 0.64 1.48 9.25 - - - LTM 6.93 2.15 3.58 6.23 2.52 4.30 2.01 1.54 2.97 0.72 -1.00 9.25 17.54 11.63 2.47 CY+1 8.35 3.31 3.51 5.72 3.14 4.16 2.46 1.50 3.33 1.84 1.94 - 15.64 12.94 3.95 CY+2 8.94 4.04 3.72 6.41 3.62 4.68 2.71 2.00 3.72 2.55 2.42 - 16.83 14.44 4.43 P/E LFY 16.8x 25.3x 9.9x 13.2x 14.0x 14.8x 11.1x 14.7x 18.2x 42.7x - 13.0x 9.4x 13.1x 15.4x LTM - 25.3x 10.0x 13.2x 14.9x 14.8x 11.1x 14.7x 18.2x 42.7x - 13.0x - - - CY+1 13.9x 16.5x 10.1x 14.4x 11.3x 15.3x 9.0x 15.0x 16.2x 16.7x 9.4x - 10.6x 11.7x 9.6x CY+2 13.0x 13.5x 9.5x 12.8x 9.8x 13.6x 8.2x 11.3x 14.5x 12.1x 7.5x - 9.8x 10.5x 8.6x Revenue Growth 1 Year 8.9% 9.6% 4.1% 3.7% 1.4% 17.9% 2.6% (23.8%) 4.9% 3.7% 10.6% 5.0% 8.9% 4.0% 7.6% 5 Year (1.1%) 12.5% 4.3% 0.7% 1.8% 9.2% 1.6% - 3.8% (2.6%) 4.3% 2.2% 2.3% 4.7% 8.0% EBITDA Growth 1 Year (8.3%) (11.8%) 1.1% 13.6% - (20.3%) (10.5%) 10.1% 13.4% (27.7%) 0.1% - 24.6% - (17.1%) 5 Year (6.6%) 32.7% 3.7% 12.2% 4.2% 4.6% (3.3%) (10.5%) 7.0% (15.6%) 7.3% 1.0% (0.6%) (2.9%) 5.0% EBITDA Margin LTM 3.4% 5.8% 14.1% 6.8% 14.3% 3.4% 8.6% 9.1% 6.5% 5.2% 5.3% 7.1% 5.5% - - CY+1 4.7% 6.2% 14.2% 6.6% 14.8% 4.6% 8.6% 7.2% 6.6% 7.1% 5.7% - 5.4% 11.4% 5.4% CY+2 4.9% 6.5% 14.3% 6.8% 15.1% 4.9% 8.7% 7.9% 6.6% 8.2% 6.1% - 5.4% 11.8% 5.7% Leverage/Coverage Ratios Total Debt / Equity % 57.9% 168.8% 151.4% 58.2% 686.2% 16.2% 100.7% 19.1% 14.2% 35.0% 64.4% 16.2% 103.0% 18.8% 108.1% Total Debt / Capital % 36.5% 51.2% 58.9% 36.7% 87.3% 13.6% 46.2% 15.2% 12.3% 25.0% 39.2% 13.8% 50.7% 15.8% 51.9% Total Debt / EBITDA 2.488x 3.017x 3.703x 2.045x 7.969x 0.572x 2.990x 0.445x 0.725x 2.679x 3.409x 1.572x 2.930x - - Net Debt / EBITDA 1.195x 0.889x 2.508x 0.162x 7.130x -2.186x 1.438x -1.438x -1.013x -1.323x 2.632x 1.196x 2.042x - - EBITDA / Int. Expense 9.637x 4.546x 7.578x 14.259x 2.911x 33.514x 8.210x 22.413x 59.635x 9.975x 4.895x 20.261x 11.057x 17.149x 6.352x Credit Ratings S&P LT Credit Rating - - BBB+ BBB+ - A- BBB+ BBB- - - BB- - - - - S&P LT Credit Rating Date - - 29.03.2007 23.10.2012 - 22.01.2004 30.11.2011 09.08.2010 - - 07.10.2010 - - - - Moody's LT Credit Rating - - Baa1 - - A3 (P)A3 - - - B1 - - - - Moody's LT Credit Rating Date - - 23.07.2002 - - 29.11.2000 26.01.2012 - - - 14.09.2012 - - - - Q.M.S Advisors | tel: +41 (0)78 922 08 77 | e-mail: info@qmsadv.com |