

Recommended
Recommended
More Related Content
Recently uploaded
Recently uploaded (20)
Featured
Featured (20)
A study of wars
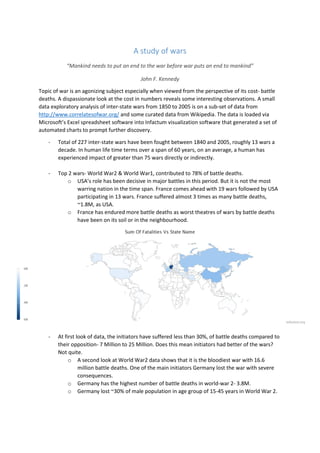
- 1. A study of wars “Mankind needs to put an end to the war before war puts an end to mankind” John F. Kennedy Topic of war is an agonizing subject especially when viewed from the perspective of its cost- battle deaths. A dispassionate look at the cost in numbers reveals some interesting observations. A small data exploratory analysis of inter-state wars from 1850 to 2005 is on a sub-set of data from http://www.correlatesofwar.org/ and some curated data from Wikipedia. The data is loaded via Microsoft’s Excel spreadsheet software into Infactum visualization software that generated a set of automated charts to prompt further discovery. - Total of 227 inter-state wars have been fought between 1840 and 2005, roughly 13 wars a decade. In human life time terms over a span of 60 years, on an average, a human has experienced impact of greater than 75 wars directly or indirectly. - Top 2 wars- World War2 & World War1, contributed to 78% of battle deaths. o USA’s role has been decisive in major battles in this period. But it is not the most warring nation in the time span. France comes ahead with 19 wars followed by USA participating in 13 wars. France suffered almost 3 times as many battle deaths, ~1.8M, as USA. o France has endured more battle deaths as worst theatres of wars by battle deaths have been on its soil or in the neighbourhood. - At first look of data, the initiators have suffered less than 30%, of battle deaths compared to their opposition- 7 Million to 25 Million. Does this mean initiators had better of the wars? Not quite. o A second look at World War2 data shows that it is the bloodiest war with 16.6 million battle deaths. One of the main initiators Germany lost the war with severe consequences. o Germany has the highest number of battle deaths in world-war 2- 3.8M. o Germany lost ~30% of male population in age group of 15-45 years in World War 2.
- 2. - Are fatalities in wars on the decline? The answer sadly seems to be a No. o Post World-War2, there are ~3.5M battle deaths o Overall, even if both world war 1 and 2 fatalities are ignored, the trend of fatalities is still upward. As more conventional modern weaponry becomes all weather and technology oriented, the impact on battle deaths is getting worse.
- 3. Sadly, as Infactum’s visual analysis shows that war as a violent means of settling issues is on the upward trend too. Data Refinement The small data analysis was explored on dataset available on http://www.correlatesofwar.org/. The dataset contains two raw files in .csv format- Tabular data and its code book. Normally, it is a tedious process to combine the data and cleanse it into an analysable form. Consider the following steps: 1. Review the column headers in tabular data and interpret its meaning using the code book. a. 28 column headers with 440 records 2. Clearly, some of the columns provide no additional information and some need to be collapsed into a single column (Ex: day, month, year). a. We can suppress the columns from analysis easily in Infactum with an On/Off switch b. Column combine is a single step operation in Infactum to get Start date of the war and End date of the war. c. Above transformation helps to create a derived column to answer the duration of each war. This is done automatically in Infactum. 3. To transform into tidy analysable data, each record should contain only one warring side. Aggregations such as number of fatalities happen by War Name, as an example. The final analysable dataset is created as below. War Name State Name Initiator Outcome Battle Death Start Date End Date Duration Football War El Salvador Yes Winner 700 7-14-1969 7-18-1969 4 WarNum WarName WarType CcodeA SideA CcodeB SideB Intnl StartMonth1StartDay1 StartYear1EndMonth1EndDay1 EndYear1 StartMonth2StartDay2 St 500 First Caucasus 5 365 Russia -8 Georgians, Dhagestania, Chechens0 6 10 1818 -9 -9 1822 -8 -8