
Recommended
Recommended
More Related Content
More from samirapdcosden
More from samirapdcosden (20)
10222, 925 PM Printhttpscontent.uagc.eduprintMcNei
- 1. 10/2/22, 9:25 PM Print https://content.uagc.edu/print/McNeill.2947.17.1?sections=ch18 ,ch19,ch20,ch21,ch22&content=all&clientToken=91e0f5df- a186-e33f-c66b-58e2e5a9… 1/18 18 Partners HealthCare System Thomas H. Davenport Partners HealthCare System (Partners) is the single largest provider of healthcare in the Boston area. It consists of 12 hospitals, with more than 7,000 affiliated physicians. It has 4 million outpatient visits and 160,000 inpatient admissions a year. Partners is a nonprofit organization with almost $8 billion in revenues, and it spends more than $1 billion per year on biomedical research. It is a major teaching affiliate of Harvard Medical School. Partners is known as a “system,” but it maintains substantial autonomy at each of its member hospitals. While some information systems (the electronic medical record, for example) are standardized across Partners, other systems and data, such as patient scheduling, are specific to particular hospitals. Analytical activities also take place both at the centralized Partners level and at individual hospitals such as Massachusetts General Hospital (MGH) and Brigham and Women’s Hospital (usually described as “the Brigham”). In this chapter, both centralized and hospital-specific analytical
- 2. resources are described. The focus for hospital-specific analytics is the two major teaching hospitals of Partners—MGH and the Brigham—although other Partners hospitals also have their own analytical capabilities and systems. Centralized Data and Systems at Partners The basis of any hospital’s clinical information systems is the clinical data repository, which contains information on all patients, their conditions, and the treatments they have received. The inpatient clinical data repository for Partners was initially implemented at the Brigham during the 1980s. Richard Nesson, the Brigham and Women’s CEO, and John Glaser, the hospital’s chief information officer, initiated an outpatient electronic medical record (EMR) at the Brigham in 1989.1 (http://content.thuzelearning.com/books/McNeill.2947.17.1/sect ions/ch18#ch18end01) This EMR contributed outpatient data to the clinical data repository. The hospital was one of the first to embark on an EMR, though MGH had begun to develop one of the first full-function EMRs as early as 1976. A clinical data repository provides the basic data about patients. Glaser and Nesson came to agree that in addition to a repository and an outpatient EMR, the Brigham—and Partners after 1994, when Glaser became its first CIO—needed facilities for doctors to input online orders for drugs, tests, and other treatments. Online ordering (called CPOE, or Computerized Provider Order Entry) would not only solve the time-honored problem of interpreting poor physician handwriting, but could also, if
- 3. endowed with a bit of intelligence, check whether a particular order made sense or not for a particular patient. Did a prescribed drug comply with best- known medical practice, and did the patient have any adverse reactions in the past to it? Had the same test been prescribed six times before with no apparent benefit? Was the specialist to whom a patient was being referred covered by his or her health plan? With this type of medical and administrative knowledge built into the system, dangerous and time-consuming errors could be prevented. The Brigham embarked on its CPOE system in 1989. Nesson and Glaser knew that there were other approaches to reducing medical error than CPOE. Some provider institutions, such as Intermountain Healthcare in Utah, were focused on close adherence by physicians to well-established medical protocols. Others, like Kaiser Permanente in California and the Cleveland Clinic, combined insurance and medical practices in ways that incented all providers to work jointly on behalf of patients. Nesson and Glaser admired those approaches, but felt that their impact would be less in an academic medical center such as Partners, where physicians were somewhat autonomous, and individual departments prided themselves on their separate reputations for research and practice innovations. Common, intelligent systems seemed like the best way to improve patient care at Partners. In 1994, when the Brigham and Mass General combined as Partners HealthCare System, there was still considerable autonomy for individual hospitals in the combined organization. However, from the onset of the merger, the two hospitals agreed to use a common outpatient
- 4. EMR called the longitudinal medical record (LMR) and a CPOE system, both of which were developed at the Brigha m. This was powerful testimony in favor of the LMR and CPOE systems, since there was considerable rivalry between the two hospitals, and Mass General had its own EMR. Perhaps the greatest challenge was in getting the extended network of Partners-affiliated physicians up on the LMR and CPOE. The physician network of more than 6,000 practicing generalist and specialist physician groups was scattered around the Boston metropolitan area, and often operated out of their own private offices. Many lacked the IT or telecom infrastructures to implement the systems on their own, and implementation of an outpatient EMR cost about $25,000 per physician. Yet full use of the system across Partners-affiliated providers was critical to a seamless patient experience across the organization. Glaser and the Partners information systems (IS) organization worked diligently to spread the LMR and CPOE to the growing number of Partners hospitals and to Partners-affiliated physicians and medical practices. To assist in bringing physicians outside the hospitals on board, Partners negotiated payment schedules with insurance companies that rewarded physicians for supplying the kind of information available from the LMR and CPOE. By 2007, 90% of Partners-affiliated physicians were using the systems, and by 2009, 100% were. By 2009, more than 1,000 orders per hour were being entered through the CPOE system across Partners. The combination of the LMR and the CPOE proved to be a
- 5. powerful one in helping to avoid medical error. Adverse drug events, or the use of the wrong drug for the condition or one that caused an allergic reaction in the patient, typically were encountered by about 14 of every 1,000 inpatients. At the Brigham before LMR and CPOE, the number was about 11. After the widespread implementation of these systems at Brigham and Women’s, there were just above five adverse drug events per 1,000 inpatients —a 55% reduction. Managing Clinical Informatics and Knowledge at Partners The Clinical Informatics Research & Development (CIRD) group, headed by Blackford Middleton, is one of the key centralized resources for healthcare analytics at Partners. Many of CIRD’s staff, like Middleton, have multiple advanced degrees; Middleton has an MD, a Master of Public Health degree, and a Master of Science in Health Services Research. The mission of CIRD is https://content.uagc.edu/books/McNeill.2947.17.1/sections/ch18 #ch18end01 10/2/22, 9:25 PM Print https://content.uagc.edu/print/McNeill.2947.17.1?sections=ch18 ,ch19,ch20,ch21,ch22&content=all &clientToken=91e0f5df- a186-e33f-c66b-58e2e5a9… 2/18 to improve the quality and efficiency of care for patients at Partners HealthCare System by assuring that the most advanced current
- 6. knowledge about medical informatics (clinical computing) is incorporated into clinical information systems at Partners HealthCare.2 (http://content.thuzelearning.com/books/McNeill.2947.17.1/sect ions/ch18#ch18end02) CIRD is part of the Partners IS organization. It was CIRD’s role to help create the strategy for how Partners used information systems in patient care, and to develop both production systems capabilities and pilot projects that employ informatics and analytics. CIRD’s work had played a substantial role in making Partners a worldwide leader in the use of data, analysis, and computerized knowledge to improve patient care. CIRD also has had several projects funded by U.S. government health agencies to adapt some of the same tools and approaches it developed for Partners to the broader healthcare system. One key function of CIRD was to manage clinical knowledge, and translate healthcare research findings into daily medical practice at Partners. In addition to facilitating adoption of the LMR and CPOE, Partners faced a major challenge in getting control of the clinical knowledge that was made available to care providers through these and other systems. The “intelligent CPOE” strategy demanded that knowledge be online, accessible, and easily updated so that it could be referenced by and presented to care providers in real-time interactions with patients. There were, of course, a variety of other online knowledge tools, such as medical literature searching, available to Partners personnel; in total they were referred to as the “Partners
- 7. Handbook.” At one point after use of the CPOE had become widespread at Brigham and Women’s, a comparison was made between online usage of the Handbook and usage of the knowledge base from order entry. There were more than 13,000 daily accesses through the CPOE system at the Brigham alone, and only 3,000 daily accesses of the Handbook by all Partners personnel at all hospitals. Therefore, there was an ongoing effort to ensure that as much high-quality knowledge as possible made it into the CPOE. The problem with knowledge at Partners was not that there wasn’t enough of it; indeed, the various hospitals, labs, departments, and individuals were overflowing with knowledge. The problem was how to manage it. At one point, Tonya Hongsermeier, a physician with an MBA degree who was charged with managing knowledge at Partners, counted the number of places around Partners where there was some form of rule-based knowledge about clinical practice that was not centrally managed. She found about 23,000 of them. The knowledge was contained in a variety of formats: paper documents, computer “screen shots,” process flow diagrams, references, and data or reports on clinical outcomes—all in a variety of locations, and only rarely shared. Hongsermeier set out to create a “knowledge engineering and management” factory that would capture the knowledge at Partners, put it in a common format and central repository, and make it available for CPOE and other online systems. This required not only a new computer system for holding the thousands of rules that constituted the knowledge, but an
- 8. extensive human system for gathering, certifying, and maintaining the knowledge. It consisted of the following roles and organizations: • A set of committees of senior physicians who oversaw clinical practice in various areas, such as the Partners Drug Therapy Committee, which reviewed and sanctioned the knowledge as correct or best known practice • A group of subject matter experts who, using online collaboration systems, debated and refined knowledge such as the best drug for treating high cholesterol under various conditions, or the best treatment protocol for diabetes patients • A cadre of “knowledge editors” who took the approved knowledge from these groups and put it into a rule-based form that would be accepted by the online knowledge repository High Performance Medicine at Partners Glaser and Partners IS had always had the support of senior Partners executives, but for the most part their involvement in the activities designed to build Partners’ informatics and analytics capabilities was limited to some of the hospitals and those physician practices that wanted to be on the leading edge. Then Jim Mongan moved from being president of MGH (a role he had occupied since 1996, shortly after the creation of Partners) to being CEO of Partners overall in January 2003. Not since Dick Nesson had Glaser had such a strong partner in the executive suite. Mongan had come to appreciate the value of the LMR and
- 9. CPOE, and other clinical systems, while he headed Mass General. But when he came into the Partners CEO role, with responsibility over a variety of diverse and autonomous institutions, he began to view it differently. Mongan said: So when I was preparing to make the move to Partners, I began to think about what makes a health system. One of the keys that would unite us was the electronic record. I saw it as the connective tissue, the thing we had in common, that could help us get a handle on utilization, quality, and other issues. Together Mongan and Glaser agreed that while Partners already had strong clinical systems and knowledge management compared to other institutions, a number of weaknesses still needed to be addressed (most importantly that the systems were not universally used across Partners care settings), and steps needed to be taken to get to the next level of capability. Working with other clinical leaders at Partners, they began to flesh out the vision for what came to be known as the High Performance Medicine (HPM) initiative, which took place between 2003 and 2009. Glaser commented on the process the team followed to specify the details of the HPM initiative: Shortly after he took the reins at Partners, however, Jim had a clear idea on where he wanted this to go. To help refine that vision, several of us went on a road trip, to learn from other highly integrated health systems such as Kaiser, Intermountain Healthcare, and the Veterans
- 10. Administration about ways we might bring the components of our system closer together. Mongan concluded: We also were working with a core team of 15-20 clinical leaders and eventually came up with a list of seven or eight initiatives, which then needed to be prioritized. We did a “Survivor”-style voting process, to determine which initiatives to “kick off the island.” That narrowed down the list to five Signature Initiatives. The five initiatives consisted of the following specific programs, each of which was addressed by its own team: https://content.uagc.edu/books/McNeill.2947.17.1/sections/ch18 #ch18end02 10/2/22, 9:25 PM Print https://content.uagc.edu/print/McNeill.2947.17.1?sections=ch18 ,ch19,ch20,ch21,ch22&content=all&clientToken=91e0f5df- a186-e33f-c66b-58e2e5a9… 3/18 • Creating an IT infrastructure—Much of the initial work of this program had already been done; it consisted of the LMR and the CPOE, which was extended to the other hospitals and physician practices in the Partners network and maintained. This project also addressed patient data quality reporting, further enhancement of knowledge management processes, and a patient data portal to give patients access to their own health information.
- 11. • Enhancing patient safety—The team addressing patient safety issues focused on four specific projects: 1) providing decision support about what medications to administer in several key areas, including renal and geriatric dosing; 2) communicating “clinically significant test results,” particularly to physicians after their patients have left the hospital; 3) ensuring effective flow of information during patient care transitions and handoffs in hospitals and after discharge; 4) providing better decision support, patient education, and best practices and metrics for anticoagulation management. • Uniform high quality—This team addressed quality improvement in the specific domains of hospital-based cardiac care, pneumonia, diabetes care, and smoking cessation; it employed both registries and decision support tools to do so. • Chronic disease management—The team addressing disease management focused on prevention of hospital admission by identifying Partners patients who were at highest risk for hospitalization, and then developed health coaching programs to address patients with high levels of need, for example, heart failure patients; the team also pulled together a new database of information about patient wishes about end- of-life decisions. • Clinical resource management—At Jim Mongan’s suggestion, this team focused on how to lower the usage of high-cost drugs and high-cost imaging services; it employed both “low-tech” methods (e.g.,
- 12. chart reviews) and “high-tech” approaches (e.g., a data warehouse making transparent physicians’ imaging behaviors relative to peers) to begin to make use of scarce resources more efficiently. Overall, Partners spent about $100 million on HPM and related clinical systems initiatives, most of which were ultimately paid for by the Partners hospitals and physician practices that used them. To track progress, a Partners-wide report, called the HPM Close, was developed that shows current and trend performance on the achievement of quality, efficiency, and structural goals. The report was published quarterly to ensure timely feedback for measuring performance and supporting accountability across Partners. New Analytical Challenges for Partners Partners had made substantial progress on many of the basic approaches to clinical analytics, but there were many other areas at the intersection of health and analytics that it could still address. One was the area of personalized genetic medicine—the idea that patients would someday receive specific therapies based on their genomic, proteomic, and metabolic information. Partners had created the i2b2 (Informatics for Integrating Biology and the Bedside), a National Center for Biomedical Computing that was funded by the National Institutes of Health. John Glaser was co-director of i2b2 and developed the IT infrastructure for the Partners Center for Personalized Genetic Medicine. One of the many issues these efforts addressed in personalized genetic medicine was how relevant genetic information would be included in the LMR.
- 13. Partners was also attempting to use clinical information for postmarket surveillance—the identification of problems with drugs and medical devices in patients after they have been released to the market. Some Partners researchers had identified dangerous side effects from certain drugs through analysis of LMR data. Specifically, research scientist John Brownstein’s analyses suggested that the level of patients with heart attack admissions to Mass General and the Brigham had increased 18% beginning in 2001 and returned to its baseline level in 2004, which coincided with the timeframe for the beginning and end of Vioxx prescriptions. Thus far the identification of problems had taken place only after researchers from other institutions had identified them, but Partners executives believed it had the ability to identify them at an earlier stage. The institution was collaborating with the Food and Drug Administration and the Department of Defense to accelerate the surveillance process. John Glaser noted: I don’t know that we’ll get as much specificity as might be needed to really challenge whether a drug ought to be in a market, but I also think it’s fairly clear that you can be much faster and involve much fewer funds, frankly, to do what we would call the “canary in the mine” approach.3 (http://content.thuzelearning.com/books/McNeill.2947.17.1/sect ions/ch18#ch18end03) Partners was also focused on the use of communications technologies to improve patient care. Its Center for Connected Health, headed by Dr. Joe Kvedar, developed one of the first physician-to-physician online
- 14. consultation services in an academic medical setting. The Center was also exploring combinations of remote monitoring technologies, sensors (for example, pill boxes that know whether today’s dosage has been taken), and online communications and intelligence to improve patient adherence to medication regimes, engagement in personal health, and clinical outcomes. In the clinical knowledge management area, Partners had done an impressive job of organizing and maintaining the many rules and knowledge bases that informed its “intelligent” CPOE system. However, it was apparent to Glaser, Blackford Middleton, and Tonya Hongsermeier—and her successor as head of knowledge management, Roberto Rocha—that it made little sense for each medical institution to develop its own knowledge base. Therefore, Partners was actively engaged in helping other institutions with the management of clinical knowledge. Middleton (the principal investigator), Hongsermeier, Rocha, and at least 13 other Partners employees were involved in a major Clinical Decision Support Consortium project funded by the U.S. Agency for Healthcare Research and Quality. The consortium involved a variety of other research institutions and healthcare companies, and was primarily focused on finding ways to make clinical knowledge widely available to healthcare providers through EMR and CPOE systems furnished by leading vendors. Despite all these advances, not all Partners executives and physicians had fully bought into the vision of using smart information systems to improve patient care. Some found, for example, the LMR and CPOE to
- 15. be invasive in the relationship of doctor and patient. A senior cardiologist at Brigham and Women’s, for example, argued in an interview [with the author] that: I have a problem with the algorithmic approach to medicine. People end up making rote decisions that don’t fit the patient, and it can also be medically quite wasteful. I don’t have any choice here if I want to write prescriptions—virtually all of them are done online. But I must say that I am getting alert fatigue. Every time I write a prescription for nitroglycerine, I am given an alert that asks me to ensure that my patient isn’t on Viagra. Don’t you think I know that at this point? As for online treatment guidelines, I believe in them up to a point. But once something is in computerized guidelines it’s sacrosanct, whether or not the data are legitimate. Recommendations should be given with notification of how certain we are about them.... Maybe these things are more useful to some doctors than others. If you’re in a subspecialty https://content.uagc.edu/books/McNeill.2947.17.1/sections/ch18 #ch18end03 10/2/22, 9:25 PM Print https://content.uagc.edu/print/McNeill.2947.17.1?sections=ch18 ,ch19,ch20,ch21,ch22&content=all&clientToken=91e0f5df- a186-e33f-c66b-58e2e5a9… 4/18 like cardiology you know it very well. But if you are an internist, you may have shallow knowledge, because you have
- 16. to cover a wide variety of medical issues. Many of the people involved in developing computer systems for patient care at Partners regarded these as valid concerns. “Alert fatigue,” for example, had been recognized as a problem within Blackford Middleton’s group for several years. They had tried to eliminate the more obvious alerts, and to make changes in the system to allow physicians to modify the types of alerts they received. There was a difficult line to draw, however, between saving physician attention and saving lives. Centralized Business Analytics at Partners While much of the centralized analytical activity at Partners has been on the clinical side, the organization is also making progress on business analytics. The primary focus of these efforts is on financial reporting and analysis. For several years, for example, Partners has employed an external “software as a service” tool to provide reporting on the organization’s revenue cycle. It has also developed several customized analytics applications in the areas of cash management, underpayments, bad debt reserves, and charge capture. These activities primarily took place in the Partners Revenue Finance function. The Partners Information Systems organization is also increasing its focus on administrative and financial analytics. It is putting in place Compass, a common billing and administrative system, at all Partners hospitals. At the same time, Partners has created a set of standard processes for collecting,
- 17. defining, and modifying financial and administrative data. Further, as one article put it: At Partners, John Stone, corporate director for financial and administrative systems, is developing a corporate center of business analytics and business intelligence. Some 12 to 14 financial executives will oversee the center, define Partners’ strategy for data management, and determine data-related budget priorities. “Our analysts spend the majority of their time gathering, cleaning, and scrubbing administrative data and less time providing value-added analytics and insight into what the data is saying,” says Stone. “We want to flip that equation so our analysts are spending more time producing a story that goes along with the data.”4 (http://content.thuzelearning.com/books/McNeill.294 7.17.1/sect ions/ch18#ch18end04) Hospital-Specific Analytical Activities—Massachusetts General Hospital MGH, because it was a highly research-driven institution, had long focused primarily on clinical research and the resulting clinical informatics and analytics. In addition to the LMR and CPOE systems used by Partners overall, MGH researchers and staff have developed a number of IT tools to analyze and search clinical data, one of which was a tool that searched across multiple enterprise clinical systems, including the LMR. While historically, the research, clinical, information systems, and the analytically focused business arms of MGH tended to
- 18. operate in stove pipes, the challenges of an evolving healthcare landscape have forced a change in that paradigm. For instance, a strong current focus within MGH is on how to achieve federal “meaningful use” reimbursement for the organization’s expenditures on EMR. Because achieving meaningful use objectives is predicated on a high level of coordination among information systems, the physicians, and business intelligence, people like David Y. Ting, the associate medical director for Information Systems for MGH and Massachusetts General Physicians Organization, and Chris Hutchins, the director of Finance Systems and deputy CIO, are beginning to collaborate extensively. The HITECH/ARRA criteria for Stage 1 EMR meaningful use prescribe 25 specific objectives to incentivize providers to adopt and use electronic health records.5 (http://content.thuzelearning.com/books/McNeill.2947.17.1/sect ions/ch18#ch18end05) To raise the level of EMR use by all its providers, as well as to provide resources for the work needed to achieve that level, MGH has arrived at a novel funds distribution model. They determined that the physicians organization will reserve a portion of the pool of $44,000 per physician toward IT and analytics infrastructure, then distribute the remaining incentive payment across all providers, proportional to the amount of data a particular physician is charged with entering. An internal quality incentive program would serve as the distribution mechanism. So, for example, if you recorded
- 19. demographics, vital signs, and smoking status for the requisite number of patients, you would receive 30% of the per-physician payment from the pool. If you fulfilled all ten quality measures, you would receive 100% of the payment from the pool. This encourages all physicians to contribute to the meaningful use program, but it also means that no physicians will receive the full amount of $44,000. The incentive from the federal government is up to $44,000 for each eligible provider who fulfills the meaningful use criteria. MGH has examined the objectives and broken them down into ten major pieces of patient data that physicians need to record in the EMR. However, many are not relevant for all of its physicians. For example, a primary care physician would logically enter such data as demographics, vital signs, and smoking status, but these would be less relevant for certain specialists to enter. Clearly, such a complex quality incentive model requires an unprecedented level of analytics. Currently, Ting, Hutchins, and others at MGH are working to map the myriad clinical and finance data sources that are scattered among individual departments, exist at a hospital site level, or exist at the Partners enterprise level. Simultaneously, they must negotiate data governance agreements even among other Partners entities, to ensure that the requisite data feeds from sources within Partners and pertaining to MGH, but stored outside MGH’s physical data warehouses, are available for MGH analytics purposes. MGH has some experience with reimbursement metrics based on physician behaviors, having used them in Partners Community
- 20. HealthCare, Inc. (PCHI), its physician network in the Boston area. Physician incentives have been provided through PCHI on the basis of admission rates, cost-effective use of pharmacy and imaging services, and screening for particular diseases and conditions, such as diabetes. This was also the mechanism used to encourage the adoption of the LMR and CPOE systems by physicians. But MGH, like other providers, struggles with developing clear and transparent metrics across the institution that can help to drive awareness and new behaviors. If MGH could create broadly accessible metrics on individual physicians’ frequency of prescribing generic drugs, for example, it would undoubtedly drive MGH’s competitive physicians to excel in the rankings. https://content.uagc.edu/books/McNeill.29 47.17.1/sections/ch18 #ch18end04 https://content.uagc.edu/books/McNeill.2947.17.1/sections/ch18 #ch18end05 10/2/22, 9:25 PM Print https://content.uagc.edu/print/McNeill.2947.17.1?sections=ch18 ,ch19,ch20,ch21,ch22&content=all&clientToken=91e0f5df- a186-e33f-c66b-58e2e5a9… 5/18 On the business side, MGH is trying to develop a broad set of capabilities in business intelligence and analytics. A Business Intelligence/Performance Management group has recently been created under the direction of Chris Hutchins, deputy CIO and director of finance systems for the Mass General Physicians Organization (MGPO). The group is generating
- 21. reports on such financial and administrative topics as • Billing efficiency, claims adjudication, rejection rates, and times to resolve billing accounts, both at MGH overall and across practices • Improving patient access, average wait times to see a physician, and cancellation and no show rates • Employer attrition as an MGH customer MGH is also working with CMS on the Physician Quality Reporting Initiative. To combine all these measures in a meaningful fashion, MGPO is also working on a balanced scorecard.6 (http://content.thuzelearning.com/books/McNeill.2947.17.1/sect ions/ch18#ch18end06) While the current analytical activity is largely around reporting, Hutchins plans to develop more capabilities around alerts, exception reporting, and predictive models. The MGH Physicians Organization is implementing capabilities for statistical and predictive analytics that would be applied to several topics. For example, one key area in which better prediction would be useful involves patient volume. They are also pursuing more general models that would predict shifts in business over time. At the moment, however, Hutchins feels that the scorecard is still early in its development and current efforts are focused on identifying leading indicators. Hospital-Specific Analytical Activities—Brigham and Women’s Hospital Like MGH, the Brigham’s analytical activities in the past have
- 22. been largely focused on clinical research. Today it is also addressing much of the same business, operational, and meaningful use issues that MGH is. Many of the analytical activities at the Brigham are pursued by the Center for Clinical Excellence (CCE), which was founded by Dr. Michael Gustafson in 2001. The center has five functionally interrelated sections, including • Quality programs • Patient safety • Performance improvement • Decision support systems (including all internal and external data management and reporting activities) • Analysis and planning (which oversees business plan development, ROI assessments for major investments, cost benchmarking, asset utilization reporting, and support for strategic planning) The CCE has close working relationships with the Brigham’s CFO and finance organizations, the Brigham’s information systems organization, the Partners Business Development and Planning function, and other centers and medical departments at the Brigham. One major difference between the Brigham and MGH (and most other hospitals, for that matter) is that the Brigham established a balanced scorecard beginning in 2000. It was based on a well-established cultural orientation to operational and quality metrics throughout the hospital. Richard Nesson, the Brigham CEO who had partnered with CIO John Glaser to
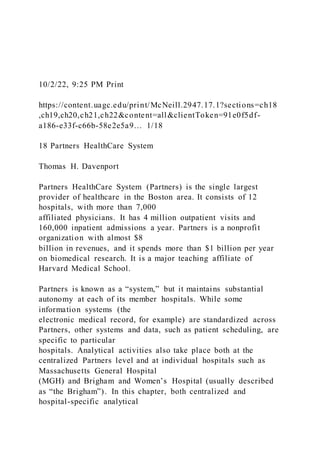
- 23. introduce the LMR and CPOE systems, was also a strong advocate of information-driven decision making on both the clinical and business sides of the hospital. The original systems that Nesson and Glaser had established also incorporated a reporting tool called EX, and a data warehouse called CHASE (Computerized Hospital Analysis System for Efficiency). The analyses and data from these systems formed the core of the Brigham’s balanced scorecard. Before an effective scorecard could be developed, the Brigham had to undertake considerable work on data definitions and management. One analysis discovered, for example, that there were five different definitions of the length of a patient stay circulating in 11 different reports. The chief medical officer at the time, Dr. Andy Whittemore, and the CCE’s Dr. Gustafson, a surgeon who had just taken on quality measurement issues at the Brigham, addressed these data issues with a senior executive steering committee and decided to present the data in an easy-to-digest scorecard. Under the ongoing management of the CCE, the scorecard contains a variety of financial, operational, and clinical metrics from across the hospital. The choice of metrics is driven by a “strategy map”7 (http://content.thuzelearning.com/books/McNeill.2947.17.1/sect ions/ch18#ch18end07) specifying the relationships among key variables that drive the performance of the hospital (see Figure 18.1 (http://content.thuzelearning.com/books/McNeill.2947.17.1/sect ions/ch18#ch18fig01) ). Unlike most corporate strategy maps, financial performance
- 24. variables are at the bottom of the map rather than the top. In the scorecard itself, there are more than 50 specific measures in the hospital-wide scorecard, and more detailed scorecards for particular departments, such as Nursing and Surgery. The scorecard has also been extended to Faulkner Hospital, a Partners institution that is managed jointly with the Brigham. https://content.uagc.edu/books/McNeill.2947.17.1/sections/ch18 #ch18end06 https://content.uagc.edu/books/McNeill.2947.17.1/sections/ch18 #ch18end07 https://content.uagc.edu/books/McNeill.2947.17.1/sections/ch18 #ch18fig01 10/2/22, 9:25 PM Print https://content.uagc.edu/print/McNeill.2947.17.1?sections=ch18 ,ch19,ch20,ch21,ch22&content=all&clientToken=91e0f5df- a186-e33f-c66b-58e2e5a9… 6/18 Figure 18.1 Strategy map for Brigham & Women’s balanced scorecard Dr. Gary Gottlieb, the Brigham president from 1992 to 2009, was the most aggressive user of the scorecard. He noted: I review the balanced scorecard on a regular basis, because there is specific data that is of interest to me. There are key metrics I examine for trends and if they develop, then I analyze the data to better understand what is going right or wrong. It is one view, but an important one of our hospital. I can look at the balanced scorecard and get
- 25. information in another way, from a different perspective than I can when I’m making rounds on a hospital unit, or sitting in the meeting with chiefs.8 (http://content.thuzelearning.com/books/McNeill.2947.17.1/sect ions/ch18#ch18end08) Gottlieb left the Brigham CEO role to become the CEO of Partners overall in 2010. One of the primary initiatives in his new Partners role is to expand the degree of common systems throughout Partners, so that there can be common data and analytics throughout the organization. Perhaps one day all of Partners HealthCare System will be managed through one scorecard. Notes 1 (http://content.thuzelearning.com/books/McNeill.2947.17.1/sect ions/ch18#ch18end01a) . This and other details of the Partners LMR/CPOE systems are derived from Richard Kesner, “Partners Healthcare System: Transforming Healthcare Services Delivery Through Information Management,” Ivey School of Business Case Study (2009). 2 (http://content.thuzelearning.com/books/McNeill.2947.17.1/sect ions/ch18#ch18end02a) . “CIRD, Clinical Informatics Research & Development,” http://www.partners.org/cird/ (http://www.partners.org/cird/) . 3 (http://content.thuzelearning.com/books/McNeill.2947.17.1/sect
- 26. ions/ch18#ch18end03a) . PricewaterhouseCoopers, “Partners HealthCare: Using EHR Data for Post-market Surveillance of Drugs” (2009). http://pwchealth.com/cgi- local/hregister.cgi/reg/partners_healthcare_case_study.pdf (http://pwchealth.com/cgi- local/hregister.cgi/reg/partners_healthcare_case_study.pdf) . 4 (http://content.thuzelearning.com/books/McNeill.2947.17.1/sect ions/ch18#ch18end04a) . Healthcare Financial Management Association, “Developing a Meaningful EHR,” http://www.hfma.org/Publications/Leadership- Publication/Archives/Special-Reports/Spring-2010/Developing- a- Meaningful-EHR/ (http://www.hfma.org/Publications/Leadership- Publication/Archives/Special-Reports/Spring-2010/Developing- a-Meaningful-EHR/) , Part 3 of “Leadership Spring-Summer 2010 Report: Collaborating for Results.” 5 (http://content.thuzelearning.com/books/McNeill.2947.17.1/sect ions/ch18#ch18end05a) . The 25 meaningful use criteria are described in “Eligible Provider: ‘Meaningful Use’ Criteria,” by Jack Beaudoin, Healthcare IT News, December 30, 2009, http://www.healthcareitnews.com/news/eligible-provider- meaningful-use-criteria (http://www.healthcareitnews.com/news/eligible- provider-meaningful-use-criteria) . 6
- 27. (http://content.thuzelearning.com/books/McNeill.2947.17.1/sect ions/ch18#ch18end06a) . Robert S. Kaplan and David P. Norton, “The Balanced Scorecard: Measures that Drive Performance,” Harvard Business Review (January – February 1992). 7 (http://content.thuzelearning.com/books/McNeill.2947.17.1/sect ions/ch18#ch18end07a) . Robert S. Kaplan and David P. Norton, “Having Trouble With Your Strategy? Then Map It,” Harvard Business Review (September – October, 2000). 8 (http://content.thuzelearning.com/books/McNeill.2947.17.1/sect ions/ch18#ch18end08a) . Ibid. https://content.uagc.edu/books/McNeill.2947.17.1/sections/ch18 #ch18end08 https://content.uagc.edu/books/McNeill.2947.17.1/sections/ch18 #ch18end01a https://content.uagc.edu/books/McNeill.2947.17.1/sections/ch18 #ch18end02a http://www.partners.org/cird/ https://content.uagc.edu/books/McNeill.2947.17.1/sections/ch18 #ch18end03a http://pwchealth.com/cgi- local/hregister.cgi/reg/partners_healthcare_case_study.pdf https://content.uagc.edu/books/McNeill.2947.17.1/sections/ch18 #ch18end04a http://www.hfma.org/Publications/Leadership- Publication/Archives/Special-Reports/Spring-2010/Developing- a-Meaningful-EHR/ https://content.uagc.edu/books/McNeill.2947.17.1/sections/ch18 #ch18end05a http://www.healthcareitnews.com/news/eligible-provider-
- 28. meaningful-use-criteria https://content.uagc.edu/books/McNeill.2947.17.1/sections/ch18 #ch18end06a https://content.uagc.edu/books/McNeill.2947.17.1/sections/ch18 #ch18end07a https://content.uagc.edu/books/McNeill.2947.17.1/sections/ch18 #ch18end08a 10/2/22, 9:25 PM Print https://content.uagc.edu/print/McNeill.2947.17.1?sections=ch18 ,ch19,ch20,ch21,ch22&content=all&clientToken=91e0f5df- a186-e33f-c66b-58e2e5a9… 7/18 19 Catholic Health Initiatives Deborah Bulger and Evon Holladay Healthcare organizations sometimes struggle with managing the volumes of data they produce—from financial, clinical, operational systems, and processes. Yet the ability to manage data and transform it into meaningful information yields significant returns to an organization’s business performance. A recent report by Yonek et al. on the characteristics of high-performing healthcare organizations cited several best practices including: • Establish a systemwide strategic plan with measurable goals and track progress toward achieving them with system performance dashboards. • Create alignment across the health system with goals and incentives.
- 29. • Leverage data and measurement across the organization by, among other things, frequently sharing dashboards and national benchmarks with hospital leaders and staff to identify areas in need of improvement and taking immediate actions to get back on track.1 (http://content.thuzelearning.com/books/McNeill.2947.17.1/sect ions/ch19#ch19end01) To be effective, information must reach the people charged with improving performance, and must reach them in a timely and appropriate fashion. At the enterprise level, a global, measurable strategy will set direction for the organization. At an operational level, measures that support financial and capacity related activities should be readily available. And for measures related to patient care activities, reporting must reach caregivers in real-time. The challenge: How does a healthcare organization translate data into actionable information for every stakeholder across the enterprise? About the Organization Catholic Health Initiatives (CHI) is a national nonprofit health organization with headquarters in Denver. It is a faith-based system that includes 73 hospitals; more than 400 physician practices; 40 long-term care, assisted- and residential-living facilities; a home health agency; and two community health-services organizations in 19 states. Together, its facilities serve more than 60 rural and urban communities and provided nearly $500 million in community benefit in the 2010 fiscal year, including services for the poor, free clinics, education, and research. With
- 30. approximately 70,000 employees and annual revenues of more than $8 billion, CHI ranks as the nation’s third-largest Catholic healthcare system. It is ever moving toward its vision of Catholic healthcare as a vibrant ministry, ready to provide compassionate care of the body, mind, and spirit through the twenty-first century and beyond. Business intelligence (BI) is a relatively new function for CHI. It is responsible for providing a historical, current, and predictive view of business operations through an enterprise data warehouse. CHI’s patient data warehouse provides information for strategic reporting and core measures of regulatory compliance. The department is partnering with leadership across CHI to develop metric standards and define key performance indicators and best practices benchmarks. The goal is to reduce latency in decision making by having information readily available. Current Situation Because of the breadth and depth of services provided and geography covered, CHI represents a microcosm of the U.S. healthcare delivery system. The distributed nature of the organization, disparity of systems, and the sheer magnitude of data produced across the enterprise all contribute to the complexity of data standardization. For instance, CHI uses multiple vendors across the enterprise for hospital information and acute care billing systems, clinical decision support, compensation, revenue management, enterprise resource planning (ERP), productivity, and so on. In physician practices alone there are 14 different vendor solutions. To achieve an enterprise reporting model, CHI is leveraging
- 31. commercially available tools for BI, data marts, extract/transform and load (ETL), and enterprise data warehousing. Like Yonek et al., CHI recognizes a need for a strategic alignment of technology, information, and stewardship if the organization is to move up the analytics maturity curve. In the book Analytics at Work: Smarter Decisions, Better Results, Davenport et al., explains how organizations can use data and analysis to make better decisions.2 (http://content.thuzelearning.com/books/McNeill.2947.17.1/sect ions/ch19#ch19end02) Aimed at a broad, multidisciplinary audience, it speaks to employees across their organizations who want to know where they stand now and what they need to do to become more analytical over time. The DELTA3 (http://content.thuzelearning.com/books/McNeill.2947.17.1/sect ions/ch19#ch19end03) model outlines five key components for deploying and succeeding with analytical initiatives: • D for accessible, high-quality data • E for an enterprise orientation • L for analytical leadership • T for strategic goals or targets • A for analytical talent It is through this model that we describe CHI’s journey toward
- 32. enterprise intelligence. Data Data are the foundation for analytics, and CHI recognizes that managing data across the enterprise requires discipline. The organization has identified three critical steps to establishing an enterprise data model. https://content.uagc.edu/books/McNeill.2947.17.1/sections/ch19 #ch19end01 https://content.uagc.edu/books/McNeill.2947.17.1/sections/ch19 #ch19end02 https://content.uagc.edu/books/McNeill.2947.17.1/sections/ch19 #ch19end03 10/2/22, 9:25 PM Print https://content.uagc.edu/print/McNeill.2947.17.1?sections=ch18 ,ch19,ch20,ch21,ch22&content=all&clientToken=91e0f5df- a186-e33f-c66b-58e2e5a9… 8/18 Selection of the Standard At CHI, the lack of consistent definitions has, at times, led to false assumptions about an individual organization’s performance, creating barriers to an enterprise approach. To first agree on relatively simple definitions, such as whether to include day surgery or lab visits in volume measures, makes it easier to tackle more complex definitions such as adjusted patient days. CHI is designing this model operationally through its governance structure (discussed later in this chapter) and has started the standardization process with acute care, to be followed with
- 33. physician practices and home care. Of particular importance are the partnerships CHI has developed with its software vendors to standardize naming conventions within their products. This helps to ensure definitions are consistent even outside the enterprise data warehouse. Implementation Once standards are determined, the organization needs to ensure that they are implemented. CHI plans to use data governance to understand business requirements, design data definitions, develop and test metrics, and ensure effective implementation. A change control process that was started in BI will be adopted across all CHI reporting systems. This process begins with a gap analysis to evaluate new data definitions or changes to calculations and determines when those changes will be activated. To ensure accountability, CHI uses a RACI4 (http://content.thuzelearning.com/books/McNeill.2947.17.1/sect ions/ch19#ch19end04) matrix to assign people who are responsible, accountable, consulted, and informed for activities and decisions that impact implementation. Ongoing Monitoring It is critical to monitor data continuously to ensure its integrity, identify new measures, and assess the information behaviors of people who gather and use it. Administrative data are highly standardized, but as new metrics demand a higher level of data accuracy, it is necessary
- 34. to train people to collect data correctly. One example at CHI is the capture of patient race and ethnicity data. These are key data elements used for monitoring underserved populations and mitigating disparities in care, a critical component of health reform. There are national standards for this—no need to recreate the process—but the data are not always captured accurately upon admission. A high percentage of patient records at CHI wer e listed as “unable to determine.” Rather than take a punitive approach, the organization chose to address the issue as a function of behavior and ongoing process. Once admission personnel understood how these data were used and the importance to patient care, capture rates improved. Data Management in Action An example of a decision that impacts implementation is determining whether data must go to the warehouse for further normalization, aggregation, or modeling, or if they can be viewed directly through BI tools in transaction systems or other reporting systems like cost accounting. The decision is based on the frequency of data needs (e.g., real-time patient census supported by a single variable) and the complexity of analysis, such as projected payments requiring statistical models inherent in the data warehouse. Enterprise CHI aggregates financial and operational data supplied by each entity. However, it has not historically provided an enterprise reporting methodology
- 35. with a standard taxonomy for comparing key business practices. As the healthcare delivery model becomes more disparate— acute, ambulatory, home care, long-term care—it creates some interesting challenges for comparisons at an enterprise level. For example, the acceptable operating margin may be very different for long-term care than acute care, so it is important to understand the reason for the difference and recognize the unique contributions of each care setting. CHI’s objective is to view the two holistically, align around a model of shared accountability, and recognize that long- term care is an equal partner in the delivery model. As long- term care centers are added to the organization—40 centers at this writing—they are treated as part of the enterprise rather than independent enti ties. CHI’s mission is to achieve the best possible care for the community by ensuring appropriate handoffs and measuring effectiveness across the continuum. Leadership Becoming accountable for the care of a broad and diverse patient population means that strategic decisions must be made based on reliable data. CHI has structured its information management model to support an enterprise strategy for decision making (see Figure 19.1 (http://content.thuzelearning.com/books/McNeill.2947.17.1/sect ions/ch19#ch19fig01) ). https://content.uagc.edu/books/McNeill.2947.17.1/sections/ch19 #ch19end04 https://content.uagc.edu/books/McNeill.2947.17.1/sections/ch19 #ch19fig01
- 36. 10/2/22, 9:25 PM Print https://content.uagc.edu/print/McNeill.2947.17.1?sections=ch18 ,ch19,ch20,ch21,ch22&content=all&clientToken=91e0f5df- a186-e33f-c66b-58e2e5a9… 9/18 Figure 19.1 Simplified graphic of Catholic Health Initiatives data governance data structure In this model, senior leaders drive a top down directive for corporate alignment of strategic metrics with measurable action plans. At an operational level, the information management council is a multidisciplinary group of individuals selected by their senior operational leaders, representing all regions of CHI. The objective of this group is to define priority solutions that will provide stakeholders with timely data so they can make better decisions based on information rather than anecdote. CHI’s data governance structure is composed of functional vice presidents from across the enterprise. Their goal is to create accountability for standardized information that aligns with functional and operational priorities and external best practices. In addition, smaller workgroups aimed at specific business issues are designed to create an environment where participants can build relationships, have difficult conversations, and solve problems. Target or Goal
- 37. Standardized data definitions allow for meaningful comparisons. CHI is large enough to benchmark results both internally and externally. This allows the organization to define current achievement and set aspirational goals. CHI’s enterprise measurement dashboard is completely transparent, allowing each facility to view every other facility’s results. These open comparisons enable organizations to see who is doing better on various metrics and to share the possibilities. It is acceptable for entities to be different as long as they explore those differences and are driven to improve. BI’s goal is to create energy and power by providing information that facilitates learning. To drive that energy, CHI is shifting the analytics paradigm to include more exploratory analytics that empower local organizations to ask and answer difficult questions about their results. CHI recognizes two important aspects of this applied learning model: • Access to truly comparative information—Organizations can “drill” to comparisons on the dashboard at the market level and across all facilities with confidence in the results. • Collaboration—At a functional level, organizations know each other and ask questions to understand the results and create shared practices. This approach creates an internal consultancy of shared practices based on long-term relationships that can be leveraged as needed. By comparing outside its own organization, each entity can leverage the value of the collective enterprise knowledge.
- 38. Analysts Analytical talent is necessary to “connect the dots” from data source to end results to provide critical insights. Technology enables analysis, but it is human capital that most benefits organizations that compete based on analytics. Three levels of analysts are described by Davenport et al.5 (http://content.thuzelearning.com/books/McNeill.2947.17.1/sect ions/ch19#ch19end05) • Senior management sets the tone for analytical culture and makes decisions. • Professional analysts gather and analyze data and report results to decision makers. • Analytics “amateurs” use the outputs to perform their jobs. This is an area where CHI, like many healthcare organizations, continues to learn. At this point in the journey, CHI is on the cusp of Stage 3—still dependent on localized analytics but aspiring to become an analytical organization (see Figure 19.2 (http://content.thuzelearning.com/books/McNeill.2947.17.1/sect ions/ch19#ch19fig02) ) with leaders who are setting the analytics tone of the organization. The next steps are to start aligning analysts—both professional and “amateur”—around a common understanding of data and measurement and to “get everyone out of their silos.” As these capabilities mature, analysts will help build a framework of trust in both the data and shared practices that drive improvement.
- 39. https://content.uagc.edu/books/McNeill.2947.17.1/sections/ch19 #ch19end05 https://content.uagc.edu/books/McNeill.2947.17.1/sections/ch19 #ch19fig02 10/2/22, 9:25 PM Print https://content.uagc.edu/print/McNeill.2947.17.1?sections=ch18 ,ch19,ch20,ch21,ch22&content=all&clientToken=91e0f5df- a186-e33f-c66b-58e2e5a… 10/18 Figure 19.2 Five levels of analytics capability Conclusion The focus on coordination of care as an industry driver, the expansion of the care delivery model outside acute care, and pivotal leadership changes have created the “perfect storm” for CHI. As it moves into the next phase of analytics maturity, CHI will plan for additional milestones: • Evaluate the concept of incentives tied to improving performance by measuring the “return on information” investment. • Develop enterprise intelligence solutions that provide data in a more real-time manner. Ideally every stakeholder should have a common set of standardized information at her fingertips. • Define an analytics roadmap. CHI has engaged consultants to help the organization accelerate deployment of high-value analytics.
- 40. • Find those true areas that need to improve by deploying more advanced analytics. • Leverage meaningful use requirements as a baseline to create the next level of learning. CHI views this process as a journey that promises to weave information into its business practices and deliver against predictable milestones in the future. The organization has made significant progress in the last 14 months as its culture has shifted to support an enterprise model, but there is still much work to do. Notes 1 (http://content.thuzelearning.com/books/McNeill.2947.17.1/sect ions/ch19#ch19end01a) . J. Yonek, S. Hines, and M. Joshi, A Guide to Achieving High Performance in Multi-Hospital Health Systems, Health Research & Educational Trust, March 2010, http://www.commonwealthfund.org/Conte nt/Publications/Fund- Reports/2010/Mar/A-Guide-to-Achieving-High-Performance-in- MultiHospital-Health-Systems.aspx? utm_source=feedburner&utm_medium=feed&utm_campaign=Fe ed%3A+TheCommonwealthFund+%28The+Commonwealth+Fun d%29 (http://www.commonwealthfund.org/Content/Publications/Fund- Reports/2010/Mar/A-Guide-to-Achieving-High-Performance-in- MultiHospital-Health- Systems.aspx?utm_source=feedburner&utm_medium=feed&utm _campaign=Feed%3A+TheCommonwealthFund+%28The+Comm onwealth+Fund%29) .
- 41. 2 (http://content.thuzelearning.com/books/McNeill.2947.17.1/sect ions/ch19#ch19end02a) . Thomas H. Davenport, Jeanne G. Harris, and Robert F. Morison, Analytics at Work: Smarter Decisions, Better Results (Harvard Business School Press, 2010). 3 (http://content.thuzelearning.com/boo ks/McNeill.2947.17.1/sect ions/ch19#ch19end03a) . Davenport et al. DELTA is also the Greek letter that signifies “change” in an equation. 4 (http://content.thuzelearning.com/books/McNeill.2947.17.1/sect ions/ch19#ch19end04a) . RACI is an acronym that stands for responsible, accountable, consulted, and informed and deploys a matrix to assign. There are many references to RACI. This is one of them: http://www.projectsmart.co.uk/how-to-do-raci-charting-and- analysis.html (http://www.projectsmart.co.uk/how-to-do-raci- charting-and- analysis.html) . 5 (http://content.thuzelearning.com/books/McNeill.2947.17.1/sect ions/ch19#ch19end05a) . Thomas Davenport and Jeanne G. Harris, Competing on Analytics: The New Science of Winning (Harvard Business School Press, 2007). https://content.uagc.edu/books/McNeill.2947.17.1/sections/ch19 #ch19end01a http://www.commonwealthfund.org/Content/Publications/Fund- Reports/2010/Mar/A-Guide-to-Achieving-High-Performance-in-
- 42. MultiHospital-Health- Systems.aspx?utm_source=feedburner&utm_medium=feed&utm _campaign=Feed%3A+TheCommonwealthFund+%28The+Comm onwealth+Fund%29 https://content.uagc.edu/books/McNeill.2947.17.1/sections/ch19 #ch19end02a https://content.uagc.edu/books/McNeill.2947.17.1/sections/ch19 #ch19end03a https://content.uagc.edu/books/Mc Neill.2947.17.1/sections/ch19 #ch19end04a http://www.projectsmart.co.uk/how-to-do-raci-charting-and- analysis.html https://content.uagc.edu/books/McNeill.2947.17.1/sections/ch19 #ch19end05a 10/2/22, 9:25 PM Print https://content.uagc.edu/print/McNeill.2947.17.1?sections=ch18 ,ch19,ch20,ch21,ch22&content=all&clientToken=91e0f5df- a186-e33f-c66b-58e2e5a… 11/18 20 Analytics at the Veterans Health Administration Thomas H. Davenport The Veterans Health Administration (VHA), a unit of the U.S. Department of Veteran Affairs (VA), provides medical assistance to military veterans through 152 hospitals and medical centers, 784 outpatient clinics, and more than 100 long-term care facilities such as nursing homes. It serves a veteran population of more than 22 million and is the largest medical system in the United States. The VA had some historical issues with quality of care for
- 43. veterans, but for the last decade, it has performed well in that regard. Under its leader Dr. Kenneth Kizer, in the mid-1990s the VHA embarked on a major transformation in care quality and cost reduction. As one aspect of the transformation, the VA shifted resources from inpatient to outpatient care. At the same time, it decreased staffing while improving patient outcomes. For example, in only the four years from 1994 to 1998, the VA made the following changes in care programs: • Closed 54% of acute care beds. • Decreased bed-days by 62%. • Decreased staffing by 11%. • Increased the number of patients treated by 18%. • Increased ambulatory visits by 35%. • Instituted universal primary care. • Reduced morbidity rates by 30%. • Reduced mortality rates by 9%. • Eliminated 72% of all forms.1 (http://content.thuzelearning.com/books/McNeill.2947.17.1/sect ions/ch20#ch20end01) Veterans routinely rank the VA system as having better quality than other treatment alternatives, according to the American Customer Satisfaction Index. In 2008, the VA had a satisfaction rating of 85 for inpatient treatment, compared with 77 for private hospitals, and
- 44. VA outpatient care outscored private hospital outpatient care by three points.2 (http://content.thuzelearning.com/books/McNeill.2947.17.1/sect ions/ch20#ch20end02) The VA’s EMR System and Related Analytics The VA was one of the first large government care providers— or large providers of any type—to put a standard electronic medical record in place throughout the system. Originally known as the Decentralized Hospital Computer Program (DHCP), it was adopted in the 1980s. DHCP is still the core of the health information system in individual medical centers, though it has gained many new functions over the years. Renamed VistA (Veterans Health Information Systems and Technology Architecture) under Kizer in 1996, it was made available to other healthcare organizations under an open source arrangement. It included functionality such as wireless laptop access in patient rooms, bar coding of medications, electronic signatures for procedures, and access to online images. The VA had also recently added an online patient portal to VistA functionality. The portal reminded patients about allergies and medications, listed past and upcoming visits to VA facilities, and allowed e-mailed communications with care providers. Some patients had automated links between home monitoring devices and their VistA medical records. VistA and other VA patient data were also increasingly being used for analytical purposes. In VistA itself, clinicians could create, for example, a chart of risk factors and medications to decide treatments. They could also search VistA records to find out, for example, if veterans
- 45. were showing symptoms of diseases related to Agent Orange exposure.3 (http://content.thuzelearning.com/books/McNeill.2947.17.1/sect ions/ch20#ch20end03) When a VA hospital in Kansas City noticed an outbreak of a rare form of pneumonia among its patients, a quick search revealed that all the patients had been treated with a contaminated nasal spray.4 (http://content.thuzelearning.com/books/McNeill.2947.17.1/sect ions/ch20#ch20end04) In another example, VA researchers used VistA data to examine 12,000 medical records to explore treatment variations for diabetes across different VA doctors, hospitals, and clinics, and how patients fared under the different circumstances. The findings were then incorporated into clinical guidelines delivered by the VistA system. In the 1990s, the VA began using VistA data to identify underperforming and particularly successful surgical teams or hospital managers with regard to quality and safety benchmarks.5 (http://content.thuzelearning.com/books/McNeill.2947.17.1/sect ions/ch20#ch20end05) In addition, the VA made available a variety of SAS datasets for analysis by researchers. These were extracts from a large patient care data warehouse using VistA data, and they addressed topics such as inpatient care and procedures, and outpatient visits and events. The patient records were normally anonymized. The VA also maintained the Decision Support System, a
- 46. managerial cost accounting system based on commercial software. It combined clinical and cost data to allow cost allocation to patient care products and services. Fully implemented by 1999, it allowed the VA to integrate expenses, workload, and patient utilization and outcomes. There were also data warehouses for each regional Veterans Integrated Services Network (VISN), and a Pharmacy Benefits Management Services database of all prescriptions issued by the VA. To facilitate access to these tools by researchers and analysts, the VA maintained a VA Information Resource Center, an online portal that served as a guide to available research data, tools, and services. All of these systems and analytical tools are employed throughout the VA. They are evidence that the VA is a leader in both clinical informatics and the performance improvements based on them. Some of the specific groups who use the data and perform the analyses are described in the following sections, along with some of their analytical activities. https://content.uagc.edu/books/McNeill.2947.17.1/sectio ns/ch20 #ch20end01 https://content.uagc.edu/books/McNeill.2947.17.1/sections/ch20 #ch20end02 https://content.uagc.edu/books/McNeill.2947.17.1/sections/ch20 #ch20end03 https://content.uagc.edu/books/McNeill.2947.17.1/sections/ch20 #ch20end04 https://content.uagc.edu/books/McNeill.2947.17.1/sections/ch20 #ch20end05
- 47. 10/2/22, 9:25 PM Print https://content.uagc.edu/print/McNeill.2947.17.1?sections=ch18 ,ch19,ch20,ch21,ch22&content=all&clientToken=91e0f5df- a186-e33f-c66b-58e2e5a… 12/18 Analytical Groups and Initiatives In addition to the earlier VistA analytics efforts, many analytical initiatives involving patient care at the VA over the past several years have taken place in the office of the Under Secretary for Health for Quality and Safety. That office includes three units that perform analytical work for the VA: • Quality and Safety Analytics Center (QSAC)—This umbrella unit supports analysis and learning from the vast amount of patient data available from VistA. Not all of the data are useful for analytical purposes, so one of the tasks of QSAC is to determine which data elements are suitable for detailed analysis. QSAC has two specialized units under it: Inpatient Evaluation Center and Office of Productivity, Efficiency, and Staffing. • Inpatient Evaluation Center (IPEC)—IPEC houses more than 20 quantitative analysts. It focuses on analysis of data on inpatient care to improve patient outcomes. It provides data and analysis to care providers and managers, focusing initially on intensive care units (ICUs), and later on acute care more generally. One of its first activities was to develop risk-adjusted metrics of patient outcomes that could be used throughout the VA. The risk adjustment method was based on data from an extraction program run at each medical center. The
- 48. data were then analyzed to create reports that compared risk-adjusted mortality and length of stay to the medical center’s adherence to process measures. ICU performance was compared against “average” and “best” performance benchmarks. ICU reports were segmented by specific patient groups such as the type of intensive care unit, severity of illness, or admission diagnosis, or procedure. Using a Web-based database application created and supported by the VA IPEC, hospitals could also track their hospital-acquired infections in the intensive care units. IPEC also supports the identification of other evidence-based practices to improve the care of veterans and their families. It addresses practices related to central line infections and ventilator-assisted pneumonia, and also focuses on practices that avoid urinary tract infections. • Office of Productivity, Efficiency, and Staffing (OPES) —The OPES, which includes mathematicians and economists, undertook a variety of projects on the business side of VHA performance. It assesses such topics as clinical productivity, staffing levels, and overall efficiency. One key focus is the productivity of primary care physicians and some specialists, segmenting clinicians by teaching mission, practice setting, and patient complexity. Clinicians as well as VA system leaders are the primary audience for OPES analyses. Analytics is also performed in other VA groups, although the purpose of the analyses is often research and publication (as it sometimes is in IPEC and OPES) more than changes in medical processes and treatment
- 49. protocols. For example, the VA’s Health Service Research and Development organization conducts rigorous research and publishes it in medical journals. There is also an outcomes analysis group in the VA’s Surgery department, as well as other quantitative analysts in the Policy and Planning organization and a predictive modeling group in the Patient Treatment File organization. The VA Office of Information and Technology also maintains a series of data warehouses (both a centralized “corporate” data warehouse and several regional warehouses), and a Business Intelligence Service Line to help with field operations information needs. Quality Metrics and Dashboards A key component of the 1990s care transformation at the VA involved a new framework by which to measure quality, and holding senior managers accountable for improvements in performance measures. The quality care framework includes morbidity rates, mortality rates, longevity (for example, one-year survival rates), functionality scores, and performance indicators. Throughout the VA, patient function is measured by a version of the SF-12 Health Survey. Performance indicators include a prevention index (for example, vaccination rates, cancer screening) and chronic disease care indices (such as hypertension control). These metrics proliferated through multiple systems, displays, and dashboards. One of the early activities of the quality and safety analytics groups was to establish a single quality and safety dashboard for the VA. Called Links, it contains both process and outcome measures, with about seven
- 50. mortality metrics for each facility. In addition to Links, the VA’s analytics groups also experimented with a variety of other dashboards and displays. Quality information, for example, is presented on statistical process control charts. Different medical facilities are compared on a “variable life adjusted display.” The quality and efficiency levels of different facilities are compared in a “stochastic frontier analysis” displaying efficiency as a frontier of quality. Information in dashboards is often color-coded, and whenever possible the display shows trends and movement. The quality and safety analytics groups also worked with new metrics, including medical center readmission rates, mental health readmissions, and 12 different ambulatory care conditions. If the 12 conditions are present, patients should not be admitted to medical centers. IPEC also developed measures of patient case severity and tracked whether particular facilities were admitting the types of cases that they were prepared to address. Many of the metrics were presented using geographical comparisons. The researchers found a high degree of variation in quality and efficiency across the various VA facilities. The metrics and reports were intended to identify underperformers and best practices. One key challenge at the VA is the amount of data in the organization. Analysts work to provide not just more information, but greater insight. For example, VA analysts generated a comprehensive Brief Analytical Review of quality and safety findings. It includes a variety of data sources, from
- 51. internal quality data to peer reviews, surveys, and Joint Commission reports. All of the data go into a single report that “tells a story with data.” The goal of these analytical initiatives, of course, is to stimulate improvement in quality, safety, and efficiency—particularly in problematic facilities. In 2010 the VA began to post many of the measures on the Internet, including various death rates, intravenous line infection rates, ventilator-acquired pneumonia rates, and readmission rates. The VA mounted interventions for hospitals that fall into the bottom decile of national results, and some doctors and administrators can lose their jobs. One article mentioned: “The VA secretary pays attention to this,” says William E. Duncan, the agency’s associate deputy undersecretary for health quality and safety. “Unless people in the VA system have an organizational death wish, they will pay attention to this, too.”6 (http://content.thuzelearning.com/books/McNeill.2947.17.1/sect ions/ch20#ch20end06) https://content.uagc.edu/books/McNeill.2947.17.1/sections/ch20 #ch20end06 10/2/22, 9:25 PM Print https://content.uagc.edu/print/McNeill.2947.17.1?sections=ch18 ,ch19,ch20,ch21,ch22&content=all&clientToken=91e0f5df- a186-e33f-c66b-58e2e5a… 13/18
- 52. These efforts show clear payoffs. Central line infections, for example, were reduced by two-thirds. Similar reductions were achieved in the incidence of ventilator-associated pneumonia. Possible Future Uses of Analytics at the VA Much of the past work of analytics groups at the VA involved reporting of the organization’s various metrics. However, analysts are beginning to focus on ways to predict and optimize important phenomena in the care of veterans. For example, in 2011 the analytics groups at the VA, particularly the IPEC, were exploring the use of a neural network to predict the most likely high- risk sites. Four or five percent of facilities fall into that category each quarter, and analysts want to predict and address poor outcomes ahead of the problem. More broadly, the analytics groups at the VA want to get into greater use of predictive modeling and optimization. In addition to inpatient and outpatient care, the VA’s analytics groups are also beginning to address “fee care,” or care provided by non-VA facilities and clinicians for a fee. The VA spends more than $4 billion each year in external fee-based care. In general, research found that VA care is less expensive than that provided externally for a fee, and the VA analysts wanted to learn who the outliers are in buying fee care, under what circumstances fee care is used, and how effective it is. Many of the VA’s future analytical activities likely involve analyses involving people and the human skills to do analytical decision making. One approach might involve exploring the relationships between a
- 53. facility’s employee attitudes and leadership behaviors, and health outcomes at those facilities. There is already some evidence that facilities with poor leadership scores and low psychological safety levels among employees have poor health outcomes. In the near future, the VA’s analytical leaders hope to convert these research findings into intervention strategies. There might also be future initiatives to nurture the analytical skills of VHA managers and clinicians. The quality and safety organization established an Analytics Academy, which offers quarterly training sessions around the country. Average attendance has grown from 25 to 80 per class, and these efforts might expand in the future. The new analytics organization also promises greater collaboration between analytics providers within the VHA on the key problems and decisions of the organization. While the VA has made considerable strides with analytics and is clearly among the most aggressive users of clinical analytics in the United States, there is no complacency among analytical leaders. Pockets of the organization still resist evidence-based change, and analytical executives discuss helping the VHA overcome the “five stages of data grief.” The goal, of course, is to get past any grief about poor performance and fix the problem. This attitude continues to serve the VA well as it moves toward a more analytical future. Notes 1 (http://content.thuzelearning.com/books/McNeill.2947.17.1/sect ions/ch20#ch20end01a) . Speech by Kenneth Kizer,
- 54. “Reinventing Government- Provided Healthcare: The ‘New VA,’” Leonard Davis Institute of Health Economics, University of Pennsylvania, 30 April 1999. 2 (http://content.thuzelearning.com/books/McNeill.2947.17.1/sect ions/ch20#ch20end02a) . “Vets Loving Socialized Medicine Show Government Offers Savings,” Bloomberg, October 2, 2009. 3 (http://content.thuzelearning.com/books/McNeill.2947.17.1/sect ions/ch20#ch20end03a) . Gary Hicks, “A. O. Miner: Speeding Benefits to Vietnam Vets,” Vanguard, U.S. Dept. of Veterans Affairs, Nov./Dec. 2010, p. 6. 4 (http://content.thuzelearning.com/boo ks/McNeill.2947.17.1/sect ions/ch20#ch20end04a) . Phillip Longman, “The Best Care Anywhere,” Washington Monthly, Jan./Feb. 2005, online at http://www.washingtonmonthly.com/features/2005/0501.longma n.html (http://www.washingtonmonthly.com/features/2005/0501.longm an.html) . 5 (http://content.thuzelearning.com/books/McNeill.2947.17.1/sect ions/ch20#ch20end05a) . Phillip Longman, “Code Red,” Washington Monthly, July- August 2009, online at http://www.washingtonmonthly.com/features/2009/0907.longma n.html (http://www.washingtonmonthly.com/features/2009/0907.longm
- 55. an.html) . 6 (http://content.thuzelearning.com/books/McNeill.2947.17.1/sect ions/ch20#ch20end06a) . William M. Burton, “Data Spur Changes in VA Care,” The Wall Street Journal, March 29, 2011. https://content.uagc.edu/books/McNeill.2947.17.1/sections/ch20 #ch20end01a https://content.uagc.edu/books/McNeill.2947.17.1/sections/ch20 #ch20end02a https://content.uagc.edu/books/McNeill.2947.17.1/sections/ch20 #ch20end03a https://content.uagc.edu/books/McNeill.2947.17. 1/sections/ch20 #ch20end04a http://www.washingtonmonthly.com/features/2005/0501.longma n.html https://content.uagc.edu/books/McNeill.2947.17.1/sections/ch20 #ch20end05a http://www.washingtonmonthly.com/features/2009/0907.longma n.html https://content.uagc.edu/books/McNeill.2947.17.1/sections/ch20 #ch20end06a 10/2/22, 9:25 PM Print https://content.uagc.edu/print/McNeill.2947.17.1?sections=ch18 ,ch19,ch20,ch21,ch22&content=all&clientToken=91e0f5df- a186-e33f-c66b-58e2e5a… 14/18 21 The Health Service Data Warehouse Project at the Air Force Medical Service (AFMS) Albert Bonnema and Jesus Zarate
- 56. The Air Force Medical Service (AFMS) works in close coordination with the Assistant Secretary of Defense for Health Affairs, the major air command surgeons, the Departments of the Army, Navy, and other government agencies to deliver medical services for more than two million eligible beneficiaries. Beneficiaries include active duty, family members, and retirees, during both peacetime and wartime. The AFMS consists of approximately 38,000 officers, enlisted and civilian personnel, plus an additional 15,000 members assigned to the Air Force Reserves and the Air National Guard. The AFMS has an annual budget of approximately $5.4 billion and runs 75 military treatment facilities, including 16 hospitals and medical centers. Vision and Mission The AFMS’s vision is to provide quality, world-class healthcare and health service support to eligible beneficiaries anywhere in the world at any time. The AFMS’s mission is to provide seamless health service support to the United States Air Force (USAF) and combatant commanders. The AFMS assists in sustaining the performance, health, and fitness of every airman. It promotes and advocates for optimizing human performance for the war fighters, including the optimal integration of human capabilities with systems. The AFMS operates and manages a worldwide healthcare system capable of responding to a full spectrum of health requirements. This ranges from providing care in forward-deployed locations to comprehensive preventive care.
- 57. The AFMS Office of the CIO Under the direction of the AFMS Surgeon General, the AFMS Office of the CIO (OCIO) manages the strategic vision, implementation, delivery, and interdependence of all AFMS information management (IM) and information technology (IT) programs, including clinical information systems and healthcare informatics. Informatics responsibilities include portfolio and program management, budgeting, and stakeholder leadership, as well as oversight of project execution. The OCIO addresses daily tactical challenges born of multiple concurrent projects to modernize the AFMS’s information management and information technology. The OCIO is focused on creating next-generation capabilities and infrastructure while ensuring business continuity. Efforts are currently under way to reshape the OCIO, bringing in new skill sets and creating an infrastructure and architecture that can support the AFMS for the long term. AFMS’s Modernization Challenges The AFMS already meets many “meaningful use” mandates and has done so for years. But to operate more efficiently and cost effectively, the AFMS’s IM/IT infrastructure must become modernized and integrated. Among AFMS’s key challenges are • Data integration—The AFMS has had electronic capabilities since the 1990s and has used electronic health records (EHRs) since the early 2000s. The amount of data that the AFMS has is astounding.
- 58. Currently the AFMS receives 400 different data feeds and near real- time data from 101 sites around the world. These data feeds include roughly eight million transactions each day. However, data acquisition and integration has been developed organically and on a solution-by-solution basis, without alignment to any common standards or platforms. Data has been siloed in a wide range of legacy systems, some of which are difficult or impossible to support due to a lack of resources, documentation, or skill sets. The lack of data centralization and data integration limits the value of the data and creates significant costs to maintain the databases and legacy systems. A few years ago, the AFMS decided that it had to modernize its data infrastructure to centralize and integrate its data. • Information deliverables—Users of AFMS data sometimes feel they lack access to important data or must spend a significant amount of time finding, acquiring, improving, and personally integrating data to build the information artifacts they need. Not all information is delivered in a user-friendly way, it may take too long to access, and it is often designed just for a single-solution purpose. In addition, there is a lack of capacity (both technological and resource capacity) to support what customers want or need. As a result, many key consumers must be turned away to seek out other solutions. • Economies of scale—Current tools lack the capabilities that are needed to quickly answer queries and create presentation-
- 59. quality deliverables. The complexity of data has long and steep learning curves. The variety of technologies employed in data integration prevents economies of scale and hinders the development and institutionalization of standards and best practices. • Lag times from idea conception to realization—Currently the total lag time from an idea for an analytical undertaking until a final output can take three to five years, sometimes longer. This long lag occurs as data has to be aggregated, resources are allocated, development and testing occur, information assurance (the government’s term for data security) is performed, and implementation takes place. • Creating a skilled workforce—A key part of modernization is growing a next-generation workforce that has the technical skills to use the data that is available. • Strategic alignment—The OCIO faces the challenge of ensuring that all vendors, contractors, and key AF resources are aligned to a consistent, clear, and widely communicated IM/IT strategy and are empowered to succeed in the missions the AFMS has tasked them with. 10/2/22, 9:25 PM Print https://content.uagc.edu/print/McNeill.2947.17.1?sections=ch18 ,ch19,ch20,ch21,ch22&content=all&clientToken=91e0f5df- a186-e33f-c66b-58e2e5a… 15/18
- 60. Analytics at the AFMS As with many large organizations, the ability to leverage data from disparate systems to provide usable information for operational and analytical reporting is an ever-growing challenge. Along with the general data explosion that has occurred, the healthcare industry has the unique challenge of standardizing data across health systems to enhance “point-of- care” delivery and use data for research analytics. For over a decade, the AFMS has provided business intelligence (BI) services via two separate offices: the Health Informatics Division (HID) and the Health Informatics Suite (HIS). By providing registries and action lists, the HID enables clinicians to manage their complex and chronic patient population for effective disease management. The HIS develops solutions to assist the Healthcare Integrator (HCI) with initiatives such as provider schedule management, cost of care, and business planning. The Health Service Data Warehouse Project The Health Service Data Warehouse Project (HSDW) was driven by the challenges and pain points described previously. These challenges dictated the need for this data warehouse project to follow the approach of data infrastructure first and information delivery second, which focuses data integration resources on modernizing the HID’s data acquisition and processing functions. This “urban renewal” effort enhanced the HID’s capabilities with the implementation of best-of-breed data integration software and more robust data architecture and infrastructure designed to scale for future growth and needs.
- 61. Previous attempts to modernize the AFMS’s information assets focused heavily on consolidation and virtualization without focusing on data integration. While the colocation of database assets is important, it’s equally (if not more) important to devote the time and resources to truly integrate the data. Without focused modeling and integration of the data, the organization will simply have all of its redundant information assets in one place without realizing economies of scale and the benefits of having one source of information. The most critical factors for this project were • Data acquisition and transformation—Previous data- acquisition processes used disparate technologies, were often antiquated, performed poorly, and were undocumented. Key knowledge workers to support the code have departed the HID, and the mix of technology skills required to sustain the current operations is too varied, increasing resource cost and hindering the creation of common technology standards. The solution involves transformation of the enterprise’s data- acquisition processes to a centralized, completely integrated data warehouse. • Management—Historically, business rules, metadata, and system documentation have not been centrally managed. HID capacity issues and varied technology have retarded the documentation process. Change management has frequently not been formalized, creating a moving target when process remediation projects are undertaken. And formal service level agreements for batch windows, performance, and
- 62. system/data availability have not existed. In creating the HSDW, managerial processes have been revised to address each of these issues. • Information delivery—Delivery of information has consisted largely of relatively static “push reports” or creations from analysts derived from hands-on data scripting and SQL Queries. Self-service BI has not existed. Along with the HSDW, the AFMS is creating specific data marts for various purposes (like the patient-centered medical home) and has created a portfolio of dashboards. Implementation A key to the success of the HSDW was having a champion in the organization who articulated a vision for BI and evangelized that vision. It shows the importance of having strong leadership support. The HSDW implementation process took 12 months and consisted of the following steps: • Requirements • Design • Development • Test and Configuration • Deployment • Sustainment Any data warehousing or BI project requires the right talent
- 63. throughout the project life cycle. The key role facilitating the disparate groups involved in implementation is the analysts who bridge the invested parties: business, clinical, and technical. The many roles involved in the implementation process include a DW/BI lead; a work streams and requirements coordinator; lead and senior information architects; data modelers and analysts; SAS BI architects and developers; an SAS Center of Excellence lead and administrator; code and GUI developers; extract, transform, and load (ETL) architects, admins, and developers; and training, metadata documentation, and subject matter experts. Results and Benefits From a technology perspective, the architecture that has been developed is flexible enough to support both simple queries and complex analytics. The data now available can be accessed in near realtime. Users can analyze summary data and granular details. The HSDW acquires, integrates, and stores the data once so that they can be repurposed. The logical components of a mature data architecture that support enterprise data warehousing and business intelligence include • Integrated HSDW—Data are modeled and related according to business process and workflow. 10/2/22, 9:25 PM Print https://content.uagc.edu/print/McNeill.2947.17.1?sections=ch18
- 64. ,ch19,ch20,ch21,ch22&content=all&clientToken=91e0f5df- a186-e33f-c66b-58e2e5a… 16/18 • Data marts—Data are contextualized and accessible in a user- friendly form. • Operational data store (ODS)—Data are persisted in near real- time for operational needs. This has the added benefit of streaming, which limits periodic batch extractions of significant size. • Data presentation/reporting—There is a first tier of canned reports, charts, and tables to support simple users with frequent and recurring artifacts (SAS Enterprise Business Intelligence (EBI)). • Advanced analytics—This includes a multitier BI tool capable of servicing complex queries and ad hoc data exploration and analysis (SAS EBI). In addition to these technical benefits, having integrated data will enable clinical improvement, increase the satisfaction of users, and lower costs by reducing manual support time for disparate databases. It will also lead to greater efficiency through automation and will serve as a valuable asset for clinical research. Lessons Learned • In the AFMS, convincing all of the stakeholders to give up their information assets was a two-year process that eventually required an executive directive. An organization cannot underestimate the sensitivity associated with giving up control of data.
- 65. • Tool and technology selection becomes much easier when you realize that the talent acquisition to use the tool and/or technology is much more difficult. • “Cyber warfare” will be a major technological trend to overcome. • You can never do enough project planning, but too much planning is a threat to stakeholder perseverance, especially when they just gave up their information. • The biggest mistake in planning occurred during the deployment of the HSDW’s historical data load. This process exposed critical gaps within the existing architecture and infrastructure in the areas of r ole augmentation, storage capacity, and performance. Next Steps The focus of the HSDW on data acquisition, integration, and storage is critically important. However, to realize the full potential of data integration, the AFMS is focusing on data presentation, visualization, and delivery. The following actions are under way to deploy the “next level” BI to the AFMS: • Using Informatics. • Developing and delivering a platform for measuring clinical quality. • Standing up an analyst-friendly SAS capability that allows analysts to focus on analysis rather than coding or data acquisition/integration.
- 66. • Developing a baseline for analyzing and delivering meaningful clinical research on de-identified data sets. Also, developing plans to support public/private access to data for research purposes. • Providing intuitive user-friendly access to providers and managers to measure and improve their own performance. • Creating reusable, repeatable processes and best practices around BI, and creating a BI Center of Excellence for sharing and developing AFMS- focused methodologies. • Developing infrastructure and adopting new technologies to meet growing data, data warehouse, and BI needs. • Integrating additional data into the HSDW. 10/2/22, 9:25 PM Print https://content.uagc.edu/print/McNeill.2947.17.1?sections=ch18 ,ch19,ch20,ch21,ch22&content=all&clientToken=91e0f5df- a186-e33f-c66b-58e2e5a… 17/18 22 Developing Enterprise Analytics at HealthEast Care System Thomas Davenport HealthEast Care System, an integrated provider network based in St. Paul, Minnesota, is the largest provider of healthcare services to the eastern metropolitan area of the Twin Cities. Consisting of three short- term, general acute care hospitals and one long-term acute care
- 67. facility, it was created in a 1986 merger of several faith-based hospitals and home care organizations. In 2011 HealthEast had 7,000 employees and 1,400 physicians on staff. In 2005, HealthEast embarked on a multiyear plan to become the benchmark for quality care in the Twin Cities. “The HealthEast Quality Journey,” as the institution referred to its plan, was focused on making improvements in a variety of industry-standard clinical quality metrics, as well as internal metrics of process, operational, and workforce excell ence. The HealthEast Quality Institute (directed by Dr. Craig Svendsen, Vice President and Chief Medical Quality Officer) was responsible for establishing goals and metrics. The institution’s Informatics Department (directed by Dr. Brian Patty, Vice President and Chief Medical Informatics Officer) worked on incorporating improvements into everyday practice through the use of clinical information systems. The Medical Executive Committee addressed the topic of physician engagement with quality measures and care processes. By 2010 and 2011 these steps had begun to result in substantial quality improvements. On almost all metrics, HealthEast had shown distinct improvement, and the provider led others in the market on key quality and patient satisfaction criteria. HealthEast focused particular attention on specific medical problems, such as ventilator-associated pneumonia (VAP). After implementing a set of process metrics and related order sets (the “VAP bundle”), VAP incidence improved dramatically. There were no incidents of VAP in 2010 in any HealthEast hospital.
- 68. In 2010, Thomson Reuters ranked HealthEast one of the top ten U.S. health systems based on a collection of clinical performance and patient care metrics. McKesson, a provider of information systems to HealthEast, gave the organization one of only two Distinguished Achievement Awards in 2010. According to the text of the award: Two years ago, HealthEast created a centralized command center using electronic tracking boards to help monitor patient flow in real-time 24/7 throughout the HealthEast hospitals. As a result, in less than a year, patient waiting times dropped in the emergency departments, patient satisfaction scores jumped 36 percent, and ambulance diversion hours decreased 63 percent.1 (http://content.thuzelearning.com/books/McNeill.2947.17.1/sect ions/ch22#ch22end01) The HealthEast leadership was proud of its quality improvement achievements, but felt that there were additional areas to address if the organization were to continue its upward trajectory in care quality and patient satisfaction. One key area to address was enterprise analytics—the analysis and reporting of data across the entire enterprise, with a focus on prediction and not just reporting. It would also be increasingly important in the near future to integrate clinical, operational, and financial information. The pressure on U.S. providers to become accountable care organizations (ACOs) meant that clinical decision support and financial decision support would both need to influence patient care decisions. These capabilities existed
- 69. independently at HealthEast and were difficult to integrate. Therefore, executives at HealthEast had been discussing the need to create an enterprise analytics capability. Assessing and Integrating Enterprise Analytics Capabilities The Informatics Department at HealthEast had begun to assess the organization’s analytical capabilities as early as 2008. The department’s leader, Dr. Brian Patty, believed that analytics were critical to HealthEast’s continuing quality journey. He asked Skip Valusek, an industrial and systems engineer with considerable experience in process improvement and analytics, to assess analytical capabilities across the organization. Valusek conducted a survey of IT and managerial employees, and found that on a five-point scale of analytical capabilities, most respondents thought HealthEast was in the middle at Stage 3.2 (http://content.thuzelearning.com/books/McNeill.2947.17.1/sect ions/ch22#ch22end02) The surveyed group felt the organization had strengths in management sponsorship for analytics, analytical culture, and the analytical skills of HealthEast staff. The greatest weaknesses were judged to be in the data and information technology support for analytics. Valusek conducted another survey in 2010 and found similar results. Patty and Valusek presented the results of the surveys at a regular monthly meeting of HealthEast’s senior management team in early 2010. There seemed to be widespread agreement that the issue was important. Comments at the meeting included, “Enterprise analytics should be a component of
- 70. our strategy,” and “This is critical.” In terms of implementation, someone pointed out that, “This requires a vision and steps.” The ownership of the enterprise analytics issue, however, was not firmly established at the meeting. Dr. Patty had initiated the discussion, but his organization was busy finishing the implementation of an electronic health record (EHR) for HealthEast. After the management meeting, Patty met informally with several senior executives who might have some interest in owning and managing enterprise analytics. None seemed to want to own the function. Patty concluded that it should be housed within his Informatics Department but that the establishment of an enterprisewide analytics organization would have to wait until the EHR had been fully implemented. Designing the Enterprise Analytics Organization By mid-2011, Dr. Patty felt the time was right to design and implement the new analytics organization. The EHR project was nearing completion, and in another executive session in July 2011 the executive team reiterated its support for enterprise analytics. However, the climate was somewhat less receptive for creating a new organization. Because of continuing pressure on reimbursements and the need for greater efficiencies in its care of patients, HealthEast needed to cut $50 million from its 2012 budget. A substantial number of new hires in analytics would be difficult to justify. Therefore, Dr. Patty planned that most of the analytics staff would transfer into the department from other parts of the organization. This was feasible given that there were pockets of analytical expertise all around