Beyond Boundaries: Leveraging No-Code Solutions for Industry Innovation
An alma survey
1. Draft version April 3, 2013
Preprint typeset using L TEX style emulateapj v. 12/16/11
A
AN ALMA SURVEY OF SUBMILLIMETER GALAXIES IN THE EXTENDED CHANDRA DEEP FIELD
SOUTH: SOURCE CATALOG AND MULTIPLICITY
J. A. Hodge1 , A. Karim2 , I. Smail2 , A. M. Swinbank2 , F. Walter1 , A. D. Biggs4 , R. J. Ivison5,6 , A. Weiss7 , D. M.
Alexander2 , F. Bertoldi8 , W. N. Brandt9 , S. C. Chapman10 , K. E. K. Coppin11 , P. Cox12 , A. L. R. Danielson2 , H.
Dannerbauer13 , C. De Breuck4 , R. Decarli1 , A. C. Edge2 , T. R. Greve14 , K. K. Knudsen15 , K. M. Menten7 ,
H.–W. Rix1 , E. Schinnerer1 , J. M. Simpson2 , J. L. Wardlow16 , and P. van der Werf17
Draft version April 3, 2013
ABSTRACT
We present an Atacama Large Millimeter/submillimeter Array (ALMA) Cycle 0 survey of 126 sub-
millimeter sources from the LABOCA ECDFS Submillimeter Survey (LESS). Our 870µm survey with
ALMA (ALESS) has produced maps ∼3× deeper and with a beam area ∼200× smaller than the
original LESS observations, doubling the current number of interferometrically–observed submillime-
ter sources. The high resolution of these maps allows us to resolve sources that were previously
blended and accurately identify the origin of the submillimeter emission. We discuss the creation
of the ALESS submillimeter galaxy (SMG) catalog, including the main sample of 99 SMGs and a
supplementary sample of 32 SMGs. We find that at least 35% (possibly up to 50%) of the detected
LABOCA sources have been resolved into multiple SMGs, and that the average number of SMGs per
LESS source increases with LESS flux density. Using the (now precisely known) SMG positions, we
empirically test the theoretical expectation for the uncertainty in the single–dish source positions. We
also compare our catalog to the previously predicted radio/mid–infrared counterparts, finding that
45% of the ALESS SMGs were missed by this method. Our ∼1.6 resolution allows us to measure a
size of ∼9 kpc×5 kpc for the rest–frame ∼300µm emission region in one resolved SMG, implying a
star formation rate surface density of 80 M yr−1 kpc−2 , and we constrain the emission regions in the
remaining SMGs to be <10 kpc. As the first statistically reliable survey of SMGs, this will provide
the basis for an unbiased multiwavelength study of SMG properties.
Key words: galaxies: starburst – galaxies: high-redshift – submillimeter – catalogs
1. INTRODUCTION Since their discovery over a decade ago, it has been
known that submillimeter–luminous galaxies (SMGs;
hodge@mpia.de Blain et al. 2002) are undergoing massive bursts of
1 Max–Planck Institute for Astronomy, K¨nigstuhl 17, 69117
o star formation at rates unheard of in the local universe
Heidelberg, Germany (∼1000 M yr−1 ). One thousand times more numer-
2 Institute for Computational Cosmology, Durham University,
ous than local ultra–luminous infrared galaxies (ULIRGs;
South Road, Durham, DH1 3LE, UK
4 European Southern Observatory, Karl–Schwarzschild Sanders & Mirabel 1996), they could host up to half of
Strasse 2, D–85748 Garching, Germany the star formation rate density at z ∼ 2 (e.g. Chapman
5 UK Astronomy Technology Center, Science and Technology
et al. 2005). They are thought to be linked to both QSO
Facilities Council, Royal Observatory, Blackford Hill, Edinburgh activity and the formation of massive ellipticals in the lo-
EH9 3HJ, UK
6 Institute for Astronomy, University of Edinburgh, Blackford cal universe, making them key players in models of galaxy
Hill, Edinburgh EH9 3HJ, UK formation and evolution.
7 Max–Planck Institut f¨ r Radioastronomie, Auf dem H¨ gel
u u Previous surveys identifying submillimeter sources
69, D–53121 Bonn, Germany have used telescopes such as the JCMT, IRAM 30m,
8 Argelander–Institute of Astronomy, Bonn University, Auf
dem H¨gel 71, D–53121 Bonn, Germany
u and APEX single dishes equipped with the SCUBA,
9 Department of Astronomy & Astrophysics, 525 Davey Lab, MAMBO, and LABOCA bolometer arrays (Smail et al.
Pennsylvania State University, University Park, Pennsylvania, 1997; Barger et al. 1998; Hughes et al. 1998; Eales
16802, USA et al. 1999; Bertoldi et al. 2000; Greve et al. 2004; Cop-
10 Institute of Astronomy, University of Cambridge, Mading-
ley Road, Cambridge CB3 0HA, UK pin et al. 2006; Weiß et al. 2009). The main limita-
11 Department of Physics, McGill University, 3600 Rue tion of single–dish submillimeter surveys is their angu-
University, Montreal, QC H3A 2T8, Canada lar resolution (∼15 –20 FWHM), leading to multiple
12 IRAM, 300 rue de la piscine, F–38406 Saint–Martin
d’H´res, France
e issues with the interpretation of the data. In particu-
13 Universit¨t
a Wien, Institut f¨r
u Astrophysik, lar, one of the most challenging issues is the identifica-
T¨rkenschanzstrasse 17, 1180 Wien, Austria
u tion of counterparts at other wavelengths. Because of
14 University College London, Department of Physics &
the large uncertainties on the submillimeter source posi-
Astronomy, Gower Street, London, WC1E 6BT, UK
15 Department of Earth and Space Sciences, Chalmers Uni- tion, and the presence of multiple possible counterparts
versity of Technology, Onsala Space Observatory, SE–43992 within the large beam, these studies rely on statistical
Onsala, Sweden
16 Department of Physics & Astronomy, University of Cali-
associations. Most studies attempt to identify SMGs
by comparing the corrected Poissonian probabilities (P –
fornia, Irvine, CA 92697, USA
17 Leiden Observatory, Leiden University, PO Box 9513, 2300 statistic; Browne & Cohen 1978; Downes et al. 1986)
RA Leiden, Netherlands for all possible radio/mid–infrared counterparts within a
2. 2 Hodge et al.
TABLE 1
Summary of ALESS Observations
SBa Date Antennasb Fieldsc Notes
SB1 18 Oct 2011 15 16 No flux calibrator; used flux scale solutions from SB3
SB2 18 Oct 2011 15 15 Science fields observed at low elevation (20◦ –40◦ )
SB3 20 Oct 2011 15 16 –
SB4 20 Oct 2011 15 15 No flux calibrator; used flux scale solutions from SB3
SB5 20 Oct 2011 15 16 Science fields observed at low elevation (20◦ –40◦ )
SB6 21 Oct 2011 13 16 Flux calibrator unusable (20◦ elevation); used flux scale solutions from SB5
SB7 21 Oct 2011 12 13 Science fields observed at low elevation (20◦ –30◦ )
SB8 03 Nov 2011 14 15 –
a Scheduling block
b Number of antennas in that SB; 12–m only
c Number of LESS fields observed in that SB
given search radius. However, the underlying correlation state–of–the–art prior to ALMA, emphasize the impor-
between submillimeter and radio emission from SMGs is tance of interferometric observations for a complete and
poorer than expected (from local studies – e.g. Dunne unbiased view of SMGs. However, the interpretation of
et al. 2000), possibly due to the presence of radio–loud their results is complicated by the mix of millimeter– and
AGN and cold dust which is not as strongly associated submillimeter–selected sources and small sample sizes.
with massive star formation. A recent study has sug- With the Atacama Large Millimeter/submillimeter Ar-
gested that only ∼50% of the single–dish detected SMGs ray (ALMA) now online, the situation is fundamentally
have correctly–identified counterparts assigned with this changed. Even with the limited capabilities offered in
method (although the results are complicated by the Cycle 0, it has the resolution and sensitivity necessary to
use of both millimeter/submillimeter–selected sources; double the total number of interferometrically observed
Smolˇi´ et al. 2012a). Moreover, the radio/mid–IR do
cc submillimeter sources in a matter of hours. We there-
not benefit from the negative K–correction like the sub- fore used ALMA in Cycle 0 to observe a large sample
millimeter does, meaning that these studies are biased of submillimeter galaxies in the Extended Chandra Deep
against the faintest/highest redshift SMGs. Field South (ECDFS), a 30 × 30 field with deep, multi–
Another related issue is blending in fields with multiple wavelength coverage from the radio to the X–ray (Giac-
SMGs within the beam. For example, Ivison et al. (2007) coni et al. 2001; Giavalisco et al. 2004; Lehmer et al. 2005;
found that many single–dish submillimeter sources have Beckwith et al. 2006; Luo et al. 2008; Miller et al. 2008;
multiple “robust” radio counterparts, suggesting a signif- Weiß et al. 2009; Devlin et al. 2009; Scott et al. 2010;
icant fraction are interacting pairs on scales of a few arc- Ivison et al. 2010a; Miller et al. 2013). The 126 submil-
seconds. The existing millimeter/submillimeter interfer- limeter sources we target were previously detected in the
ometry also suggests some sources are resolved into mul- LABOCA ECDFS Submillimeter Survey (LESS; Weiß
tiple SMGs at ∼arcsecond resolution (e.g., Wang et al. et al. 2009), the largest, most homogenous, and most
2011), though it is not always clear whether the SMGs sensitive blind 870µm survey to date. We call our 870µm
are interacting, companions, or entirely unrelated. Fi- ALMA survey of these 126 LESS sources ‘ALESS’.
nally, multiplicity in the single–dish beam is also ex- The ALESS data have already been used in part in a
pected from evidence of strong clustering among SMGs number of papers (Swinbank et al. 2012; Coppin et al.
(e.g.; Blain et al. 2004; Scott et al. 2006; Weiß et al. 2012), including a new study constraining the 870µm
2009; Hickox et al. 2012). Whatever their relation, mul- number counts (Karim et al. 2012). Here, we present
tiple SMGs blended into one source can further com- the overarching results of the survey and the full cat-
plicate the identification of counterparts as mentioned alog of SMGs. We begin in §2 by describing the ob-
above. They can also contribute additional scatter/bias servations, our data reduction strategy, and presenting
to the far–IR/radio correlation at high redshift. Most the final maps. §3 describes the creation of the ALESS
crucially for galaxy formation modeling, it can confuse SMG sample, including source extraction and charac-
the observed number counts, mimicking a population of terization, the associated completeness and reliability,
brighter sources and affecting the slope of, e.g., flux ver- and checks on the absolute flux scale and astrometry.
sus redshift diagrams. The ALESS SMG catalog is described in §4, including
A number of interferometric submillimeter observa- the definition of the samples and some notes on using
tions of SMGs have been carried out, achieving reso- the catalog. §5 contains our results, including details of
lutions of a few arcseconds or less, but the sensitivity the SMG sizes, a discussion of LESS sources which have
of existing interferometers has generally been too poor been resolved into multiple SMGs and those which have
to observe more than a handful of sources in a reason- no detected ALMA sources, an empirical calibration of
able amount of time (e.g., Gear et al. 2000; Frayer et al. the LABOCA source positional offsets, and a comparison
2000; Lutz et al. 2001; Dannerbauer et al. 2002; Wang with previously–identified radio and mid–infrared coun-
et al. 2004, 2007; Iono et al. 2006; Younger et al. 2007; terparts. We end with a summary in §6.
Dannerbauer et al. 2008; Younger et al. 2008, 2009; Ar-
2. THE ALMA DATA
avena et al. 2010; Wang et al. 2011; Smolˇi´ et al. 2012b;
cc
Barger et al. 2012). Two notable exceptions are the re- 2.1. Observations
cent PdBI/SMA surveys by Smolˇi´ et al. (2012a) and
cc The ALMA observations were taken between 18
Barger et al. (2012). These studies, which show the Oct 2011–03 Nov 2011 as part of Cycle 0 Project
3. An ALMA survey of SMGs in ECDFS 3
#2011.1.00294.S. The targets were the 126 submillime- spected the uv–data, flagging shadowed antennas, the
ter sources originally detected in LESS, which had an autocorrelation data, and any other obvious problems.
angular resolution of ∼19 FWHM and an rms sensitiv- A clean model was used to set the flux density of the
ity of σ870µm = 1.2 mJy beam−1 . The 126 LESS sources flux calibrator. Prior to bandpass calibration, we deter-
were selected above a significance level of 3.7σ, with the mined phase–only gain solutions for the bandpass cali-
estimate that ∼5 of the sources are false detections. brator over a small range of channels at the center of
We observed the LESS sources with ALMA’s Band 7 the bandpass. This step prevents decorrelation of the
centered at 344 GHz (870µm) – the same frequency as vector–averaged bandpass solutions. We then bandpass–
LESS for direct comparison of the measured flux densi- calibrated the data and inspected the solutions for prob-
ties. These ALMA LESS observations (ALESS) utilized lems, flagging data as needed.
the “single continuum” spectral mode, with 4 × 128 dual We applied the bandpass solutions on–the–fly during
polarization channels over the full 8 GHz bandwidth, 7.5 the phase calibration. Phase–only solutions were deter-
GHz of which was usable after flagging edge channels. mined for each integration time and applied on–the–fly
The observations were taken in ALMA’s Cycle 0 com- to derive amplitude solutions for each scan. A separate
pact configuration, which had a maximum baseline of phase–only calibration was also run over the scan time
125m (corresponding to an angular resolution FWHM of for application to the targets. All phase and amplitude
∼1.5 FWHM at 344 GHz). The 126 sources were split solutions were examined, and any phase jumps or re-
into eight scheduling blocks (SBs), each of which was gions of poor phase stability were flagged. The calibra-
observed once (Table 1). To ensure our survey was unbi- tion solutions were then tied to the common flux scale
ased if it was not fully completed, targets were assigned and applied to the data. If the calibration was deemed
to these SBs in an alternating fashion. Table 1 also in- inadequate (based on inspection of the calibrated cali-
cludes details for each SB on how many 12–m antennas brators) then more data was flagged and the process was
were present, how many fields (i.e., LESS sources) were repeated. The flux density of the primary phase cali-
observed, and whether that SB was taken at low eleva- brator B0402-362 varied from ∼1.23–1.58 Jy, indicating
tion and/or is missing the flux calibrator observation. variability. The secondary phase calibrator ranged from
At the frequency of our observations, ALMA’s primary ∼0.20–0.23 Jy, and the bandpass calibrator ranged from
beam is 17.3 (FWHM). The beam was centered on the ∼2.0–2.2 Jy. The absolute flux calibration has an uncer-
catalogued positions of the LESS sources (Weiß et al. tainty of ∼15%, and this uncertainty is not included in
2009), and each field was observed for 120 seconds. The the error bars for individual SMG flux densities.
beam size matches that of the LESS beam, making it pos- The uv–data were Fourier–transformed and the result-
sible to detect all SMGs contributing to the submillime- ing “dirty” image was deconvolved from the point spread
ter source. The phase stability/weather conditions were function (i.e. the “dirty beam”) using the clean algo-
good, with a PWV < 0.5 mm. Three of the scheduling
∼ rithm and natural weighting. The images are 25.6 (128
blocks were observed at low elevation (<30◦ ), affecting pixels) per side and have a pixel scale of 0.2 . The depth
the rms and resolution achieved. In particular, the rms of of the clean process was determined iteratively and de-
the QA2–passed delivered data products for ∼20 sources pends on the presence of strong sources in the field. To
are substantially worse than the requested 0.4 mJy bm−1 begin with, we created a dirty image of each target field
(Figure 1). Four fields of the 126 were never observed using the entire 7.5 GHz bandpass. These images were
(LESS 52, 56, 64, and 125). used to calculate the initial rms noise for each field. All
Depending on the SB, either Mars or Uranus served to images were then cleaned to a depth of 3σ over the en-
set the absolute flux density scale. The quasar B0537-441 tire image, and a new rms noise value was calculated.
was used for bandpass calibration. In three SBs, the flux We then used the task BOXIT to automatically iden-
calibrator observation was missing or unusable, in which tify significant (>5σ) sources. The average number of
case we used the flux solutions from the next available >5σ sources per field was 0.6. If a field did not contain
SB with a reliable planetary observation. The primary any >5σ sources, the image produced from the previous
phase calibrator (the quasar B0402-362) was observed clean was considered to be the final one. If a field did
for 25 seconds before and after every target field, and a contain any sources >5σ, tight clean boxes were placed
secondary phase calibrator (the quasar B0327-241) was around these sources and the image was cleaned down to
observed after every other target field. The secondary 1.5σ using these clean boxes. Note that the 5σ threshold
phase calibrator was closer to our target field but six was chosen to ensure we only cleaned real sources, and
times weaker and was used to check the phase referencing the 1.5σ clean threshold was chosen to thoroughly clean
and astrometric accuracy of the observations. those sources. The image produced from this cleaning
was then considered to be the final one. No sources were
2.2. Data Reduction deemed bright enough to reliably self–calibrate.
The data were reduced and imaged using the Common
2.3. Final Maps
Astronomy Software Application (casa) version 3.4.017 .
The initial part of data reduction involved, for each SB, The final cleaned ALESS images are shown in order
converting the native ALMA data format into a mea- of their LESS field number in Figure 9 of the Appendix.
surement set (MS), calibrating the system temperature These maps have not been corrected for the response of
(Tsys calibration), and applying these corrections along the primary beam, which increases the flux density scale
with the phase corrections as measured by the water va- away from field center. The field of view of the primary
por radiometers on each antenna. We then visually in- beam (17.3 FWHM) is indicated by the large circles,
and not only matches the LABOCA beam, but is suffi-
17 http://casa.nrao.edu cient to encompass the error–circles of the SMGs from
4. 4 Hodge et al.
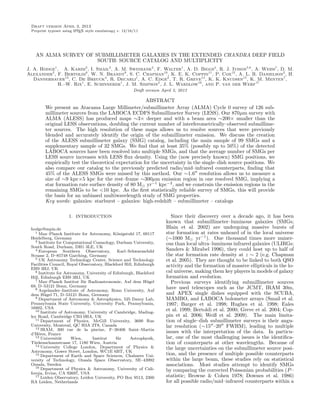
Fig. 1.— Plots showing the properties of the final maps. Left: Histogram showing the rms noise achieved (logarithmic x–axis) in all 122
fields observed. The dashed line shows the cumulative distribution function Σ(N). The median rms noise of the maps is 0.4 mJy beam−1
(vertical line), equivalent to the requested sensitivity. Right: RMS noise versus beam axis ratio for all 122 fields observed. Fields with
elongated beam shapes were observed at low elevation and tend to have high values of rms noise. The boundaries defining good quality
maps (i.e. rms < 0.6 mJy beam−1 , axis ratio < 2) are indicated with the dashed box and were chosen to include as many fields as possible
with relatively round beam shapes and low rms noise.
the LESS maps, < 5 (Weiß et al. 2009) even in confused
∼ 3.1. Source Extraction and Characterization
situations. The ellipses in the bottom left–hand corner We used custom–written idl–based source extraction
of each map indicate the angular resolution achieved. software to identify and extract sources from the final,
Note that every fourth LABOCA source on the first few cleaned ALMA maps. We started by identifying indi-
pages is noisier because of the distribution of sources into vidual pixels with flux densities above 2.5σ in descend-
scheduling blocks. ing order of significance. At each position found, and
The properties of the final cleaned maps, including rms within a box of 2 × 2 , we determined the elliptical
noise and beam shape, are listed by LESS ID in Table 2. Gaussian that best described the underlying signal dis-
The rms noise measurements were derived from the non– tribution using an idl-implemented Metropolis-Hastings
primary–beam–corrected maps by averaging over sev- Markov chain Monte Carlo (MH-MCMC) algorithm. In
eral rectangular apertures and will describe the rms at the simplest case, and as most ALMA sources appeared
field center in the primary–beam–corrected maps. A his- to be unresolved, each Gaussian was described by a sim-
togram of these rms noise values is shown in Figure 1, ple point–source model with only three free parameters:
where we also show the cumulative distribution function. its peak flux density, and its position. The values of the
The median rms noise (at field center) of the maps is major axis, minor axis, and position angle were held fixed
σ = 0.4 mJy beam−1 , or ∼3× deeper than the original to the clean beam values for the given map. To account
LABOCA data. We find that 85% of the maps achieve for any extended sources, we also repeated the fitting
an rms noise of σ < 0.6 mJy beam−1 . Also plotted in Fig- process using a six–parameter fit (including axial ratio,
ure 1 is rms noise versus beam axis ratio, defined as the major axis size, and orientation). We discuss which fits
ratio of major to minor axis of the synthesized beam. The are preferred in §5.1.
median axis ratio of all of the maps is 1.4, corresponding For each parameter, the mean of the posterior distribu-
to a median angular resolution of 1.6 ×1.15 . This reso- tion determines its best fit value. The full set of parame-
lution corresponds to a physical scale of ∼13 kpc × 9 kpc ters obtained in this way is used as a flux density model
at z ∼ 2.5 and is >10× better than the LABOCA maps. to be subtracted off the initial map before proceeding
In terms of beam areas, the improvement is ∼200×. Fig- to the next signal peak within the map. This process
ure 1 also demonstrates that fields with more elongated is repeated until the 2.5σ threshold is reached, with an
beam shapes tend to be noisier. These fields were ob- average of 12 such sources per map. The end result is
served at very low (<20–30◦ ) elevation, and many are of a combined model as well as a residual map. The flux
poor quality. We therefore define ‘good quality’ maps as densities resulting from both the 3– and 6–parameter fits
the subset of maps having relatively round beam shapes are listed in Table 3 – See §5.1 for more details.
(corresponding to axis ratios ≤ 2) and an rms noise at As a check on our source extraction routine, we also
field center within 50% of the requested rms (i.e. an ob- used casa’s imfit task to fit all bright (>4σ) sources.
served rms noise of <0.6 mJy beam−1 , and note that this Overall, we find good agreement between our best–
condition naturally follows from the first). While we fit parameters and those returned by imfit, confirm-
will concentrate on these maps for the quality checks in ing our results. A comparison of the integrated flux
Sections 3.2–3.4, all of the maps are used for the cre- densities derived by both methods yields (SIMFIT −
ation of the final SMG catalog, though with the neces- SSOURCE )/SSOURCE = 0.001 ± 0.09, and all flux density
sary caveats. We will discuss the catalog samples further estimates are in agreement within the error bars. Our
in §4. quoted errors are, however, slightly larger, as they take
3. THE ALESS SMG SAMPLE into account the correlated nature of the noise. We will
5. An ALMA survey of SMGs in ECDFS 5
Fig. 2.— Plots showing the results of a flux comparison between the integrated emission from SMGs in ALMA maps and the (deboosted)
LABOCA flux density. Left: Histograms of the flux density ratio SALMA /SLABOCA calculated by including SMGs in the ALMA maps
down to a source threshold of 3.5σ and 3σ. Right: Plot of (SALMA -SLABOCA )/SLABOCA versus SLABOCA for ALMA maps including all
SMGs down to a S/N threshold of 3σ and convolved with the LABOCA primary beam. We also show the running median, and the shaded
region indicates the 1σ uncertainty expected from the error in the LABOCA flux densities. The ALMA and LABOCA flux scales are
overall in good agreement for a 3σ threshold.
therefore use the parameters derived from our software To test the absolute flux scale, we compared our re-
for the remainder of the paper. For further information sults to those of the original LABOCA survey taken at
on the source extraction and characterization, error de- the same frequency (Weiß et al. 2009). Here (and in the
termination, integrated flux densities, and beam decon- rest of the paper) we refer to the deboosted LABOCA
volution, see the Appendix. flux densities, as these are the best estimates of the ‘true’
LABOCA flux density. There is a significant difference
3.2. Completeness and Reliability between the ALMA and LABOCA bandwidths (2×4
GHz versus 60 GHz), so we should expect to see a small
To determine the completeness and reliability of ex- systematic difference for SMGs with a steep Rayleigh–
tracted sources above a given S/N threshold, we carried Jeans tail. A more immediate complication is the vastly
out two different tests. In the first test, we extracted different angular resolutions of the two surveys, which
all sources down to 2.5σ in a given map, producing a may cause fainter and/or more extended emission to be
residual map. We then inserted five fake sources per resolved out in the ALMA maps. We therefore mod-
map, a number chosen to build up a significant sample eled the ALMA maps as idealized distributions of per-
of false sources with separations typical of the final sci- fect point sources using only good quality ALMA maps
ence sources without overcrowding the field. The peak with at least one bright (>4σ) source and including all
flux densities follow a steeply declining flux density dis- sources in such maps down to our source threshold of
tribution and with S/N ∼ 2–20. We repeated this process 3.5σ. To accurately represent the true sky distribution,
16 times per map, re–running our source extraction algo- we used the primary beam–corrected ‘best’ flux density
rithm each time and deriving the recovered fraction and values for the sources (see §4.2), and we also included the
spurious fraction as a function of S/N. The result, pre- negative peaks exceeding our source threshold. We then
sented in a companion paper (Karim et al. 2012), is that determined what flux would be measured by a telescope
the source extraction recovers ∼99% of all sources above with a 19 beam, the FWHM of LABOCA, by convolv-
3.5σ, with a spurious fraction of only 1.6% (Karim et al. ing the maps to the LABOCA resolution. This method
2012). allows for a fairer flux comparison while ensuring that
As a second test, we ran the source extraction algo- the large–scale noise properties of the ALMA maps do
rithm on the regular and inverted ALMA maps. In the not dominate the convolved images.
simplified case of uncorrelated, Gaussian noise, compar- The method outlined above results in a me-
ing these results at a given threshold would allow us to dian ALMA–to–LABOCA flux density ratio of
estimate the reliability for a source above that thresh- SALMA /SLABOCA = 0.83±0.09 . A histogram of the
0.04
old. Using a source threshold of 3.5σ, we determined a values for different fields is shown in Figure 2, exhibiting
reliability of ∼75%. This estimate rises to ∼90% for a a strong peak below one. The obvious implication is that
4σ detection threshold and nearly ∼100 for 5σ (Karim et a 3.5σ threshold is not low enough, in general, to capture
al. 2012). Since the noise in the maps is more complex all of the true flux in the maps. The specific threshold
in nature, these reliability estimates are likely lower lim- chosen for including ALMA SMGs in the model maps
its. The choice of threshold is, as always, a compromise obviously affects the peak flux densities measured in the
between excluding real sources and including noise. We final, convolved maps. Using a lower threshold ensures
will therefore take 3.5σ as our source detection threshold that fainter SMGs are accounted for, but the chance
in the good quality maps – see §4.1). of including random noise in the model ALMA maps
increases. We have attempted to counter this effect by
3.3. Absolute Flux Scale including both the positive and negative peaks in the
6. 6 Hodge et al.
counterparts (see §5.5). The original 1.4 GHz map of
the ECDFS that was used for counterpart identification
of LESS sources by Biggs et al. (2011) was presented in
Miller et al. (2008). Matching this data to the ALMA
data, we measure a scatter of 0.3 in both RA and Dec-
lination, and mean offsets of 0.15 ±0.03 in RA and
0.01 ±0.04 in Dec (in the sense VLA – ALMA). A scat-
ter plot of the offsets for individual SMGs in shown in
Figure 3, where the significant systematic offset in RA is
visible.
The same radio data were also re–reduced by Biggs
et al. (2011), including slight changes to the modeling
of the phase calibrator field to account for its resolved
structure as well as an additional source in the field. The
Biggs et al. reduction achieved an rms just below 7µJy
at its deepest point (versus 6.5µJy for the Miller et al.
reduction) and the flux density scale of the two reduc-
tions differed by <1% (Biggs et al. 2011). In Figure 3, we
overplot the offsets measured between the ALMA SMGs
and the radio counterparts extracted from this map. Us-
ing the Biggs et al. reduction, the significant systematic
Fig. 3.— Plot showing the astrometric offset between the VLA offset seen in the RA coordinate with the Miller et al.
1.4 GHz data and the ALMA data. The Miller et al. (2008) reduc-
tion of the VLA data shows a significant offset in RA, while the reduction is no longer present. However, it has been re-
Biggs et al. (2011) re–reduction of the same data shows a signif- placed by a significant systematic offset in Dec. We mea-
icant offset in Declination. The mean offsets for both reductions sure mean offsets of 0.04 ±0.04 in RA and -0.13 ±0.04
are indicated with the large, solid symbols.
in Dec (in the sense VLA – ALMA). We also measure a
(smaller) scatter of 0.2 in both RA and Declination,
maps. We therefore decreased the threshold to 3.0σ,
though we caution that fewer ALMA SMGs have radio
deriving a median flux density ratio of SALMA /SLABOCA
matches.
= 0.97±0.07 , consistent with equality of the flux scales.
0.04 Recently, Miller et al. (2013) also released another re–
To determine if these results are biased by extended reduction of the Miller et al. (2008) data, which they refer
emission in the SMGs, we performed two further tests. to as the second data release (DR2). Using this new
Although the majority of the SMGs appear unresolved re–reduction, we again recover a significant systematic
(see §4.2), leading us to use the peak flux density as the offset in RA (0.12 ±0.04 ) with no significant offset in
best flux density estimate, we tried modeling the SMGs Declination (-0.05 ±0.06 ). Thus comparison to Miller
using their (primary beam corrected) integrated flux den- et al. (2008) and Miller et al. (2013) yields similar results,
sity estimates. We also tried tapering all of the ALMA and both are contrary to the re–reduction of Biggs et al.
maps to a lower resolution (i.e. increasing the beam area (2011).
by a factor of a ∼few), re–running the source extraction Since it appears that the astrometry of the 1.4 GHz
algorithm, and using the (primary beam corrected) peak radio data is extremely sensitive to the details of the
flux density values from these maps in our model maps. calibration, we take the systematic offsets measured as
Neither test changed the results of the flux comparison being entirely due to the radio data. We conclude that
significantly, indicating that we are not ‘missing’ flux by the ALMA SMG positions are accurate to within 0.2 –
taking the majority of the SMGs to be point sources. 0.3 . For comparison, the expected astrometric accuracy
Figure 2 compares the ALMA and LABOCA flux den- is usually estimated as ∼ Θ/(S/N), or 0.17 using the
sities using a 3σ threshold for individual fields as a median resolution and S/N of the matched sample.
function of LABOCA S/N. Also shown are the run- In addition to the VLA data, we also compared the
ning median and the expected 1σ uncertainty based ALMA SMG positions to the positions of the (confirmed)
on the typical error in LACOBA flux density estimates 24µm MIPS and 3.6µm IRAC counterparts presented in
(1.2 mJy). The running median shows a preference for Biggs et al. (2011) and discussed further in §5.5. For the
higher ALMA flux densities/lower LABOCA flux densi-
24µm data, we measure mean offsets of −0.16 ±0.08 in 0.11
ties for the faintest LABOCA sources, and lower ALMA 0.06
flux densities/higher LABOCA flux densities for the RA and 0.15 ±0.05 in Dec (in the sense 24µm – ALMA).
brightest LABOCA sources. This may indicate that Similarly, the 3.6µm data show offsets of −0.10 ±0.05
there are additional, faint (<3σ) SMGs that are be- in RA and 0.42 ±0.05 in Dec (in the same sense). A
0.04
ing missed from our models of the brightest LABOCA systematic offset between the radio and 24µm data was
sources, a theory which we will come back to in Sec- previously noted by Biggs et al. (2011), who measured
tion 5.2. Nevertheless, Figure 2 demonstrates that there mean offsets of −0.25 in RA and +0.29 in Dec (in the
is no overall systematic bias between the ALMA and sense MIPS – radio), in agreement with what we measure
LABOCA flux density scales. here.
3.4. Astrometry
4. THE CATALOG
To confirm our astrometry, we looked at all >3.5σ 4.1. Sample Definitions
ALESS SMGs in good quality maps with VLA 1.4 GHz
7. An ALMA survey of SMGs in ECDFS 7
We define the MAIN ALESS SMG sample as consist- • LESS ID: LESS source ID in order of appearance
ing of all SMGs satisfying the following criteria: the rms in the S/N–sorted Weiß et al. (2009) catalog.
of the ALMA map is less than 0.6 mJy beam−1 ; the ratio
of the major and minor axes of the synthesized beam is • ALESS ID: Official IAU short ID for ALESS SMGs
less than two; the SMG lies inside the ALMA primary (ALESS XXX.X), based on LESS ID and rank-
beam FWHM; and the S/N ratio of the SMG (defined ing in S/N of any subcomponents. Note that
as the ratio of the best fit peak flux density from the 3– higher S/N subcomponents will not make it into
parameter point source model18 to the background rms) the MAIN catalog if they are outside the primary
is greater than 3.5. The SMGs in the MAIN sample are beam FWHM.
indicated in the catalog with the flag ALESS SAMPLE • ALMA Position: Right Ascension and Declination
= 1. These 99 SMGs are the most reliable SMGs, com- (J2000) of the SMG, based on the 3–parameter
ing from within the primary beam FWHM of the good– point source model fit.
quality maps (Figure 1).
In addition to the MAIN sample, we define a sup- • δRA/δDec: The 1σ uncertainty on the ALMA po-
plementary sample comprised of two different selections sition in arcseconds. Please see the Appendix for a
(Table 4). The first component of the supplementary detailed discussion of its calculation.
sample consists of SMGs satisfying the following criteria:
the rms of the ALMA map is less than 0.6 mJy beam−1 ; • Spk : The non–primary–beam–corrected best fit
the ratio of the major and minor axes of the synthesized peak flux density in mJy beam−1 based on 3–
beam is less than two; the SMG lies outside the ALMA parameter point source model fit. For details of
primary beam FWHM; and the S/N ratio of the SMG the error estimation, see the Appendix.
is greater than 4. This selection consists of SMGs that
– like the MAIN sample – come from the maps desig- • Sint : The non–primary–beam–corrected best fit in-
nated as good–quality (Figure 1), but they lie outside tegrated flux density in mJy from the 6–parameter
the primary beam FWHM. Because the telescope sensi- model fit.
tivity in this region is <50% of the maximum, leading
• S/Npk : Signal–to–noise ratio calculated using Spk .
to a higher fraction of spurious sources, we have raised
the S/N threshold slightly. The 18 SMGs which satisfy • SBEST,pbcorr : The primary–beam–corrected best
these criteria are indicated in the catalog with the flag flux determination in mJy. This is the flux den-
ALESS SAMPLE = 2 and should be used with care. sity estimate that we recommend for use in any
The second component of the supplementary sample analysis, and it is equal to the primary–beam–
consists of SMGs satisfying the criteria: the rms of the corrected peak flux density from the 3–parameter
ALMA map is greater than 0.6 mJy beam−1 OR the ra- point source model fit for all SMGs except ALESS
tio of the major and minor axes of the synthesized beam 007.1 (see §5.1).
is greater than two; the SMG lies inside the ALMA pri-
mary beam FWHM; and the S/N ratio of the SMG is • Sample: Corresponding to ALESS SAMPLE in the
greater than 4. These SMGs are found in maps which online catalog, this column is only shown for the
range in quality from just slightly worse than the good Supplementary sources (Table 4), as all MAIN sam-
quality maps to significantly worse. Because of this, we ple sources have ALESS SAMPLE = 1 by defini-
have (again) raised the S/N threshold to 4. SMGs which tion. As described in §4.1, ALESS SAMPLE =
come from maps of just slightly worse quality than the 2 sources come from outside the primary beam
‘good quality’ maps are likely reliable, while those from in good quality maps, and ALESS SAMPLE = 3
the noisiest maps (Figure 9) should be used with ex- sources come from poor quality maps.
treme care, as even SMGs near the phase center may be
spurious. The 14 SMGs which satisfy these criteria are • Biggs et al. ID: A flag indicating whether the SMG
indicated in the catalog with the flag ALESS SAMPLE confirms the position of a robust (r) or tentative (t)
= 3. counterpart in the catalog of radio/mid–infrared
counterparts of Biggs et al. (2011). Sources that
4.2. Using the Catalog do not correspond to either a robust or tentative
The ALESS catalog can be found accompanying this counterpart are indicated with ‘–’. See §5.5 for fur-
paper or from the ALESS website19 . For a detailed de- ther details.
scription of the data columns in the catalog, see the
README file accompanying the catalog. Some of the 5. RESULTS
relevant columns for the MAIN and Supplementary sam-
ples are also listed in Tables 3 and 4 and described below. 5.1. Source sizes
Note that while we list both the observed and primary Based on the source catalog, we have first tried to esti-
beam corrected flux densities for reference, the primary mate which (if any) of the SMGs may be extended. While
beam corrected flux densities should always be used for there is some evidence that a number of sources may be
science applications. marginally–extended, the error bars produced by the de-
18 Note that since the S/N ratio from the model fit is used to convolution algorithm are generally too large to make
identify SMGs in the catalog, there may be SMGs in Figure 9 which any conclusive statements. In addition, many sources
appear to be fainter than 3.5σ (based on the number of contours) are not bright enough to reliably measure a significant
but which which are identified as MAIN SMGs (and vice versa). source extension in the current data. We therefore con-
19 http://www.astro.dur.ac.uk/LESS
clude that all of the SMGs except one are best described
8. 8 Hodge et al.
Fig. 4.— Histograms of LABOCA/ALMA flux density values in mJy. Left: The LABOCA flux density values for all LESS sources with
good quality (i.e. rms < 0.6 mJy beam−1 , axis ratio < 2) ALMA maps. The black filled histogram shows the subset of fields which have
been resolved by ALMA into multiple SMGs within the primary beam (i.e., in the MAIN sample). The gray filled histogram shows the
additional LESS sources that are resolved into multiples if we include supplementary SMGs outside the primary beam FWHM in these
maps. The brightest LABOCA sources have a high fraction of multiples. Center: Here we show the LABOCA flux densities for the
subset of LESS sources which are non–detections with ALMA. These sources tend to lie on the fainter end of the LABOCA flux density
distribution. Right: ALMA flux density values for all SMGs in the MAIN sample. All LESS sources above 9 mJy have been resolved into
multiple SMGs or are fainter in the ALMA maps. We also show the subset of SMGs which confirm previously identified radio/mid–infrared
robust counterparts proposed by Biggs et al. (2011), and (independently) the subset of SMGs which confirm tentative counterparts. The
radio/mid–infrared counterparts correctly predict a large percentage of the bright sources but miss 55% of the SMGs overall.
as point sources, and we have set the “best” flux deter- measurements for SMGs via indirect means like high–J
mination (SBEST ) equal to the peak flux density from the CO (∼80 M yr−1 kpc−2 ; e.g., Tacconi et al. 2006).
3–parameter point–source fit for all SMGs in the catalog
(except one – see below). 5.2. Multiplicity
The fact that the majority of the ALESS SMGs are un-
resolved suggests that their rest–frame ∼300µm emission One of the main results from this survey is that a large
is arising in a region with a size <10 kpc. This upper fraction of the LESS sources have been resolved into mul-
limit agrees with observations of high–J (J > 2) CO tiple SMGs. Considering LESS sources with at least one
transitions, which typically report sizes in the range 4–6 detection in the MAIN ALESS SMG sample, we find
kpc (FWHM; Tacconi et al. 2006, 2008; Bothwell et al. that 24 of 69 LESS sources split into two or more MAIN
2010; Engel et al. 2010; Bothwell et al. 2012). Some ob- ALESS SMGs. If we also consider as reliable the SMGs
servations of lower–J CO transitions and radio contin- which lie outside the primary beam in these maps (i.e.
uum emission, on the other hand, have found extended ALESS SAMPLE = 2), then we find that the major-
gas reservoirs of >10 kpc (e.g., Chapman et al. 2004; ity of these SMGs lie in maps which had at least one
Biggs & Ivison 2008; Ivison et al. 2010b, 2011; Riechers MAIN SMG, while only two SMGs lie in maps with no
et al. 2011a,b; Hodge et al. 2012). MAIN sources. This brings the total number of LESS
Assuming a ∼10 kpc upper limit on the (median) size sources considered to 71, of which we find that 32 split
of the ALESS SMGs corresponds to a lower limit on the into multiple SMGs. We therefore find that for the good
(median) SFR surface density of >14 M yr−1 kpc−2 . quality maps with at least one SMG somewhere in the
Here, we have assumed the median SFR of the LESS map, ∼35%–45% consist of multiple SMGs.
SMGs (1100 M yr−1 ; Wardlow et al. 2011). Using the Despite the large fraction of detected multiples, it is
interquartile range on SFR of 300–1900 M yr−1 results important to note that the median number of detected
in SFR surface densities of >4–24 M yr−1 kpc−2 , still SMGs per good quality map is only one. This is true
well below the limit for Eddington–limited star formation whether or not we also include supplementary sources
in a radiation pressure supported starburst (1000 M outside the primary beam FWHM in these fields. For this
calculation, we have also included those maps (discussed
yr−1 kpc−2 ; Thompson et al. 2005).
in the next section) which are of good quality but devoid
Only a single SMG (ALESS 007.1) is bright enough to
of any detected SMGs. If we consider that a portion of
reliably resolve and appears to be significantly extended
the non–detections are also due to LESS sources resolved
along both axes (i.e. even within the error margins, the
into multiple SMGs, then the true fraction of single–dish
intrinsic major and minor axes are inconsistent with a
sources consisting of multiple SMGs may be even higher.
point source model). For ALESS 007.1, the best flux den-
In the extreme case, the fraction of multiple SMGs may
sity estimate (SBEST ) is set to the integrated flux density
increase to 50% (see §5.3).
from the 6–parameter model fit. This fit produced an
That some of the single–dish sources are multiples is
intrinsic source size of (1.1 ±0.3 )×(0.7 ±0.2 ). Tak-
not unexpected theoretically and has also been reported
ing this SMG’s photometric redshift estimate of zphot =
in some of the first interferometric submillimeter stud-
2.81±0.18 (Wardlow et al. 2011), this corresponds to a
0.07 ies. For example, Smolˇi´ et al. (2012a) presented in-
cc
physical size of ∼9 kpc × 5 kpc, implying that the star terferometric millimeter observations of submillimeter–
formation is spread out over many kpc. Its SFR of selected sources in COSMOS. In their 870µm–selected
2800±400 (Wardlow et al. 2011) implies an SFR surface
700 sample of 27 LABOCA sources observed interferomet-
density of ∼80 M yr−1 kpc−2 , consistent with previous rically, 22% turned out to be blended. However, their
9. An ALMA survey of SMGs in ECDFS 9
sum of the SMGs). Also indicated is the average frac-
tional contribution per component in a given total flux
bin, which can be inverted to give the average number
of SMGs in that bin (e.g., a fractional contribution of
0.33 implies three SMGs). From this figure, it appears
that as the total flux increases, the average fractional
contribution decreases, indicating an increasing number
of SMGs per field. However, because of our sensitivity
limit, we can only detect individual SMGs above 3.5σ, so
it is less likely that we would detect multiple SMGs from
a fainter LESS source. Moreover, our observations specif-
ically target sources which were bright in the single–dish
(i.e., low–resolution) map. This strategy would prefer-
entially target regions with multiple SMGs within the
single–dish beam, even if SMGs were not thought to be
strongly–clustered (Williams et al. 2011).
Fig. 5.— Component flux for MAIN sample SMGs versus total
A separate but related question is whether the multi-
flux, where total flux is defined as the sum of the ALESS SMGs. ple SMGs are physically associated. A number of studies
The points show the component flux of individual SMGs. When a have concluded that SMGs are strongly–clustered (e.g.,
point falls on the diagonal line, it means it was the only SMG in Blain et al. 2004; Weiß et al. 2009; Hickox et al. 2012),
that field (and therefore the component flux equals the total flux). although other studies have questioned whether this can
The histogram shows the average ratio of component to total flux
for a given total flux bin, with values indicated on the right–hand be explained entirely by the low resolution of single–
axis. As the total flux increases, the average fractional contribution dish surveys (Williams et al. 2011). An interferomet-
decreases, indicating a larger average number of SMGs. ric study by Wang et al. (2011) presented two examples
of submillimeter sources that were resolved into multi-
results are complicated by the fact that their interfero- ple, physically–unrelated galaxies. Based on the ALESS
metric observations were taken at a different waveband number counts alone (Karim et al. 2012), such a coin-
from the original submillimeter source selection. A more cidence would seem unlikely, although it is difficult to
reliable analysis by Barger et al. (2012) of 16 SCUBA–2 quantify given that a chance coincidence would also be
identified sources with the SMA at the same wavelength brighter and thus more easily detectable for a single–dish
suggested that 40% of bright sources are actual blends, telescope.
though they cautioned that their results relied on small Assuming that the nearby SMGs are physically–
number statistics. Both results are in agreement with related, we can measure their projected separations. Do
what we find with our larger sample. the multiple SMGs tend to be closely grouped together,
Figure 4 shows a histogram of LABOCA flux density or do they span the full range of possible separations
values for the fields with multiple ALESS SMGs com- within the beam? The predominant theory for SMG for-
pared to that of all good quality maps. If we only treat mation is that the majority of such sources are starburst-
as reliable those SMGs detected within the primary beam ing major mergers (e.g., Chapman et al. 2003; Engel et al.
FWHM (i.e., MAIN SMGs), then the brightest two LESS 2010; Narayanan et al. 2010; Hayward et al. 2011, 2012).
sources are resolved into multiples. If we also include the In the merger scenario, the gravitational torques induced
supplementary SMGs from outside the primary beam are thought to be efficient at funneling cold gas to the
FWHM, then we find that the brightest three LESS galaxy’s center (Barnes & Hernquist 1996), thereby in-
sources are resolved into multiples. The fluxes for all ducing a nuclear starburst and boosting the submillime-
distinct SMGs in the ALESS MAIN sample are shown in ter flux observed. If these gravitational torques are ef-
Figure 4, where there are now no SMGs with flux den- fective at boosting the submillimeter flux on the scales
sities above 9.0 mJy (the brightest ALESS SMG). All probed here, we might expect to see an increasing num-
LESS sources which previously had S > 9 mJy have ei- ber of SMG pairs with smaller separations.
ther been resolved into multiple, fainter SMGs, or ap- We have plotted the measured separations for the
pear to be single SMGs but with slightly lower (S < MAIN ALESS SMGs in Figure 6. The upper axis con-
9 mJy) flux densities in the ALMA observations. This is verts these separations to projected distance in kpc as-
also reflected in Figure 2 (right) and may indicate that suming a typical SMG redshift of z = 2.5. The upper
these LESS sources consist of multiple SMGs as well, but limit on separation is set (by definition) by the FWHM of
that the additional components are below our detection the primary beam. For comparison, we have also calcu-
threshold. lated the separations observed for a simulated catalog of
It is interesting to speculate on whether Figure 4 im- SMGs with the same flux density and multiplicity as the
plies that bright sources are more likely to be multiples. MAIN ALESS SMGs, but randomly placed within the
The brightest LESS source, LESS 1, is actually a triple, primary beam FWHM. As with the actual data, simu-
and if you count the faint submillimeter emission in LESS lated SMGs could not be closer than 1.5 apart. We
2 that is coincident with a 24µm source but just be- repeated this simulation 100 times to increase statistics,
low the 3.5σ detection threshold (see Figure 9 in the and the results are shown along with the MAIN sample.
Appendix), then LESS 2 may be a triple as well. An- The drop in simulated number density at larger separa-
other way to visualize the sample multiplicity is shown tions is due to the decreasing sensitivity of the telescope
in Figure 5, which plots component flux for MAIN sam- with distance from the phase center. This affects our
ple SMGs against total flux (defined, in this case, as the ability to detect large separations, as (for example) two
10. 10 Hodge et al.
There are several possible reasons why we may not
have detected an SMG with ALMA. The first possibility
is that the LESS source was spurious. According to Weiß
et al. (2009), only ∼5 of the 126 LESS sources are ex-
pected be false detections. In our sample of 88 good qual-
ity maps, we might therefore expect 5×(88/126) = 3.5 of
the ALMA maps to target spurious LESS sources. The
large majority of the apparent non–detections therefore
cover sources which we expect to be real.
Alternately, very extended/diffuse SMGs could fall be-
low the detection threshold of the ALMA observations.
While the ALMA observations are ∼3 times deeper than
the LABOCA data, the angular resolution is also >10
times higher. If a 4 mJy LESS source were a single SMG
extended over three or more ALMA beams (≥15–20 kpc
in diameter) as is observed in some SMGs in low–J CO
transitions (Ivison et al. 2010b, 2011; Riechers et al.
2011a,b; Hodge et al. 2012), it would be too extended
Fig. 6.— Number of MAIN SMG pairs with a given separa-
tion and normalized by annular area. The separations seen in the to detect in a map with our median rms sensitivity of
MAIN sample are limited to within the primary beam FWHM 0.4 mJy beam−1 . Of the SMGs we do detect, however,
by definition. We also show the simulated result for SMGs with the majority are consistent with point sources (§5.1),
the same multiplicity and flux density distribution as the MAIN making this scenario difficult to believe unless the SMG
sources and placed randomly within the primary beam FWHM.
The dot–dashed line indicates the typical ALESS resolution. Both population is a heterogeneous mix of submillimeter mor-
samples are affected by the decreasing sensitivity of the telescope phologies (but see Hayward et al. 2012).
for large separations, and the ALESS SMGs show no evidence for Finally, the LESS source may have been resolved into
an excess of sources at small separations. multiple distinct SMGs which are too faint to be de-
tected individually. If all 17 non–detections are actu-
MAIN sample SMGs spaced 17 apart will both be at ally undetected multiples, then the fraction of multiple
the 50% sensitivity contour, and will thus be harder to sources rises to ∼50%. The number of components would
detect. not need to be very large for a faint LESS source to be-
Figure 6 shows that, for the scales we are sensitive to, come undetectable in these ALMA data. For example,
the number density of ALESS SMGs as a function of if a 4 mJy LESS source were composed of three 1.3 mJy
separation is consistent with what we would expect from SMGs, these SMGs would be below the detection thresh-
a uniformly–distributed population. This holds true for old for the maps achieving our target sensitivity. As an
projected separations from ∼13 kpc (our resolution limit experiment, we have taken the LESS source flux densities
at z ∼ 2.5) out to > 140 kpc. If we bin all points and rms noise values of the maps with non–detections
within 7 (60 kpc), where there appears to be a trend and calculated how many SMGs would be required for
toward higher number densities than in the simulation, the S/N of each SMG to fall right at the 3.5σ detec-
we find that the slight excess is not statistically signifi- tion threshold for that map. We have simply rounded
cant. Therefore, the ALESS SMGs show no evidence for to the nearest integer number of SMGs, as the differ-
an excess of sources at small separations. ence between this estimate and the LESS flux density
is always ≤50% of the 1.2 mJy uncertainty in LESS flux
5.3. Non–detections
density. We have then used the number of SMGs per
There are 88 ALMA maps in total which meet map (for which we find a median of 4) and the flux den-
the first two criteria for the MAIN sample (rms < sities of these hypothetical sources to put a lower limit
0.6 mJy beam−1 , axis ratio < 2) and thus are considered on the faint–end number counts of SMGs, finding that
to be of good quality. However, only 69 of these fields at S870µm ∼1.3 mJy, >500 SMGs mJy−1 deg−2 would
contain SMGs from the MAIN ALESS sample. If we re- be required to explain our non–detections. This num-
lax our criteria slightly and also include SMGs from the ber is consistent with the faint–end extrapolation of the
good quality maps in the Supplementary sample (§4), ALESS number counts presented in Karim et al. (2012).
then we find an additional two maps (LESS 91 and 106) There is even some tentative observational evidence that
which contain a >4σ SMG just outside the primary beam this may be the case in at least one of the ALESS SMGs.
FWHM. We therefore find that 17/88 (∼19%±4%) of For example, in LESS 27 (a blank map) there are three
the LESS sources with high–quality ALMA coverage are 3σ sources lying exactly on top of three radio/mid–IR–
non–detections. A histogram of the LESS flux densities predicted counterparts, suggesting they may be real de-
for these fields is shown in Figure 4 compared to the dis- spite the fact that they are all below our adopted detec-
tribution for all good quality maps. The blank maps may tion threshold. Future, deeper observations with ALMA
be slightly fainter, in general, than the rest of the LESS will reveal whether all of the undetected LESS sources
sources. The average flux of the undetected LESS sources are indeed multiple, faint SMGs.
is 5.0±0.2 mJy versus 5.9±0.2 mJy for all LESS sources,
and a Komolgorov–Smirnov test returns a probability of 5.4. LABOCA Positional Offsets
80% that the blank maps are drawn from a different par- Prior to the existence of large, interferometrically–
ent distribution. In particular, there are no sources with observed SMG samples such as that presented here, the
SLABOCA > 7.6mJy that are undetected with ALMA. identification of counterparts at other wavelengths re-
11. An ALMA survey of SMGs in ECDFS 11
Fig. 7.— Radial offsets between ALESS SMGs and LESS sources as a function of observed (smoothed) LABOCA S/N. Left: Individual
offsets are shown for all ALESS SMGs in good quality maps. Right: Offsets are shown only for ALESS SMGs that constitute the lone source
in the field. For both panels, we also show the median offsets in bins of S/NLABOCA . The dotted line shows the theoretical expectation
for the positional uncertainty (Ivison et al. 2007) assuming the LESS resolution of 19.2 . The solid line shows a fit of the same form.
The fitted function is consistent with the theoretical prediction, indicating that there are no additional sources of astrometric error in the
LABOCA source positions. The median offsets, however, show a systematic bias toward larger offsets than predicted at high S/N, bringing
into question the use of S/N–derived search radii in counterpart searches where blending and confusion are significant.
lied on statistical methods to estimate the likelihood of expectation using this FWHM.
particular associations (e.g., Biggs et al. 2011). In such Note that many maps have ≥2 SMGs over the S/N
cases, the positional offsets between the submillimeter threshold which are blended into one brighter source in
source and wavelength of interest are dominated by the the LABOCA maps. The theoretical prediction, on the
uncertainty in the (single–dish) submillimeter positions, other hand, describes the positional offset expected for a
and this uncertainty, in turn, is thought to be primar- single source of the given S/N. If we limit the comparison
ily a function of S/N of the single–dish submillimeter to maps with only a single ALESS SMG (Figure 7, right),
source (e.g., Ivison et al. 2007). Specifically, in the limit then the fitted function shifts down slightly, giving k =
where centroiding uncertainty dominates over systematic 0.61 ± 0.06, consistent with the theoretical prediction.
astrometry errors, and for uncorrelated Gaussian noise, We therefore find that there are no additional sources of
the theoretical expectation for the positional uncertainty astrometric error for the LESS sources.
in single–dish submillimeter sources is Although the fitted function is consistent with theory,
the normalization of the function is largely constrained
∆α = ∆δ = k θ[(S/Napp )2 − (2β + 4)]−1/2 (1) by the data points at the low–S/N end. At higher S/N,
where ∆α and ∆δ are the rms positional errors in right we see in Figure 7 that the median offsets measured are
ascension and declination, respectively, the constant k = systematically higher than the predicted offsets. This is
0.6, θ is the FWHM of the single–dish primary beam likely to be a consequence of our finding earlier that a
(19.2 ), S/Napp is the apparent, smoothed signal–to– larger fraction of bright submillimeter sources are mul-
noise ratio before correcting for flux boosting, and the tiples. Hence, although recent searches for counterparts
β term provides the correction to intrinsic S/N (Ivison at other wavelengths have employed a S/N–dependent
et al. 2007). Some counterpart searches, such as that search radius, Figure 7 implies that a fixed search radius
done by Biggs et al. (2011) for LESS, have used this fact based on the typical S/N of the data may be just as good
to vary the search radius based on the S/N of the sub- or even better than a S/N–dependent radius.
millimeter source.
Now that we have both single–dish LABOCA and 5.5. Radio/MIR IDs
ALMA observations of a large number of submillime- Previously, Biggs et al. (2011) used radio and mid–
ter sources, we are in a position to empirically calibrate infrared data from the Very Large Array and Spitzer
the positional uncertainties of the LABOCA sources, to identify potential counterparts to the LESS sources.
and thus the search radius needed to recover SMGs Using their radio and/or 24µm emission along with the
from multiwavelength comparisons. Figure 7 (left) shows corrected Poissonian probability (p–statistic; Browne &
radial offset between the ALMA and LABOCA posi- Cohen 1978; Downes et al. 1986) and a S/N–dependent
tions (where the latter correspond to phase center in search radius (discussed in the previous section), they
the ALMA maps) as a function of apparent (smoothed) identified statistically robust counterparts to 62 of the
S/N for all ALESS SMGs in the good quality maps (i.e., 126 submillimeter sources in the LESS survey. (Note
MAIN and Supplementary sample 2). Also shown are that they did not correct for the small systematic off-
the median offsets in bins of S/Napp . Fitting a function set between the radio and MIPS data discussed in Sec-
to the median data points of the form given in Equa-
√ tion 3.4, as they concluded that the effect was miniscule.)
tion 1 (with a 2 correction to radial offset), we find Biggs et al. then used a color–flux cut on IRAC 3.6µm
k = 0.66 ± 0.03, or ∼10% worse than the theoretical and 5.8µm sources (chosen to maximize the number of
12. 12 Hodge et al.
secure radio and 24µm counterparts) to identify 17 addi-
tional sources whose IRAC colors suggest they are likely
counterparts. In total, they identified robust counter-
parts to 79 LESS sources, some of which have multiple
radio/mid–infrared identifications (Figure 10 in the Ap-
pendix).
With our interferometric submillimeter imaging, we
are now in a position to test how many of the ALESS
SMGs were correctly predicted by these radio/mid–
infrared identifications. Taking the 99 ALESS SMGs
in the MAIN sample, we find that 45 have robust
radio/mid–infrared counterparts. These SMGs are in-
dicated with a boldface ‘r’ in Tables 3 and 4. Note that
a counterpart was considered ‘robust’ by Biggs et al. if it
had a corrected Poissonian probability p ≤ 0.05 in either
the radio, MIPS, or IRAC data, or a value 0.05 < p < 0.1
in two separate wavelengths. If we also include tentative
counterparts (defined as having 0.05 < p < 0.1 in just Fig. 8.— Cumulative distribution function of 1.4 GHz flux den-
one wavelength), then we find an additional 9 ALESS sity values extracted from the map of Miller et al. (2013) at the
SMGs. These SMGs are indicated with a ‘t’ in Tables 3 positions of the MAIN ALESS SMGs. The dashed vertical line
shows the 3σ detection limit at the deepest part of the map, which
and 4. The remaining 45 ALESS SMGs have neither ro- is therefore a lower limit. Despite reaching an rms of 6µJy at its
bust nor tentative counterparts. The radio/mid–infrared deepest point, at least 55% of the ALESS SMGs are still unde-
counterpart identification is therefore ∼55% complete if tected in the radio data. Our stacking analysis indicates that the
we include both robust and tentative counterparts. median 1.4 GHz flux density of the ALESS SMGs is 15±1 µJy.
From Figure 10, it is immediately obvious that a sig-
nificant number of maps have ALESS SMGs outside the deep (rms= 2.7 µJy) radio map. Despite our high rate
search radius used by Biggs et al. (2011) to predict these of non–detections in the radio, the radio data still help
counterparts. Of the four brightest LESS sources with to identify a larger fraction of ALESS counterparts over-
good quality ALMA maps (LESS 1, 2, 3, and 5), all four all than the MIPS or IRAC data. If we categorize the
have at least one SMG outside the search radius, and results based on wavelength, we find that 28% of the
in two of these cases, it is the brightest source in the correctly predicted counterparts were based on the radio
map. In total, 21 out of 88 good–quality fields have at data alone, 13% were based on the MIPS data alone, and
least one ALESS SMG outside the search radius, whereas 31% were based on IRAC data alone, with an additional
Biggs et al. (2011) estimated that only 1% of all the LESS 28% based on either radio+MIPS (26%) or radio+IRAC
SMGs (i.e., 1.3 of 126 sources) would have counterparts (2%).
missed for this reason. The LESS sources with counter- The 55% overall completeness quoted above refers to
parts outside the search radius tend to be the brighter the percentage of all ALESS SMGs predicted, regard-
sources, meaning that they had a smaller adopted search less of whether some of the SMGs correspond to the
radius. This implies, as we already indicated in §5.4, that same LESS source (i.e. are multiples). While there may
the S/N–dependent search radius may not be the most also be multiple radio/mid–infrared IDs per field, it may
effective means to identify counterparts. be interesting to look at what fraction of LESS sources
Another possible issue with the counterpart identifi- have at least one correct ID. In total, of the 69 LESS
cation is the depth of the multiwavelength data used. sources covered by the MAIN ALESS sample, 52 (75%)
This could result in missed counterparts no matter what have at least one correct robust or tentative radio/mid–
the search radius. The 1.4 GHz data used for the LESS infrared ID. We find that for those LESS sources with
source counterpart identification had an rms of ∼6.5µJy multiple ALESS SMGs, 80% have at least one SMG that
at its deepest point (Miller et al. 2008), resulting in a was correctly predicted. The brightest ALESS SMG is
3σ detection threshold of 19.5µJy or higher. We used among the predicted SMGs for the majority (80%) of
the map from the second data release (DR2; Miller et al. those cases. Therefore, while the radio/mid–infrared ID
2013) to extract cutouts at the positions of all the ALESS process only predicts 55% of SMGs in total, it has a
SMGs in the MAIN sample. Stacking these cutouts gives higher success rate if we consider only the brightest SMG
a median flux density of 15±1 µJy (a 15σ detection), with in each field.
a statistical error of 2.7µJy. The cumulative distribution The flux density distributions of the confirmed ro-
function of the peak flux densities is shown in Figure 8, bust/tentative counterparts are shown in Figure 4. The
where we see that at least 55% of the ALESS SMGs are robust IDs clearly favor the brighter ALESS SMGs, with
still undetected. In comparison, Barger et al. (2012) re- 75% of the SMGs above 5 mJy matching previously pre-
cently took 16 interferometrically–observed SMGs and dicted radio/mid–infrared counterparts (versus only 35%
looked for counterparts in a deeper 1.4 GHz image (rms of the SMGs below 5 mJy). If we include tentative coun-
of 2.5µJy), detecting all 16 SMGs at >5σ. This differ- terparts, then the flux density above which the pre-
ence may be explained largely by the relative brightness dictions are 75% complete drops to only 3 mJy, below
of their detected SMGs (S860µm > 3.2 mJy), though at which only 25% of the SMGs were predicted with ro-
least two of their SMGs fall below our nominal 1.4 GHz bust/tentative radio/mid–infrared counterparts.
detection limit. Lindner et al. (2011) also report a very We can also test how many of the total number of
high radio–detection rate for submillimeter sources in a predicted counterparts are now confirmed (i.e. the reli-
13. An ALMA survey of SMGs in ECDFS 13
ability). Considering only robust IDs, there are a to- be regarded as reliable, though these estimates should be
tal of 57 distinct proposed radio/mid–infrared counter- regarded as lower limits due to the complex and corre-
parts in maps covered by the ALESS MAIN sample. lated nature of the noise in the maps.
Of these counterparts, 45 are confirmed by the ALMA To test the absolute flux scale, we model the true
maps. Therefore, 80% of the robust radio/mid–infrared sky distribution using both positive and negative sources
IDs have been confirmed by the ALMA maps, and 20% down to 3σ and convolving with the resolution of
have been shown to be incorrect. Although formally the LABOCA for a more meaningful comparison. We
robust IDs should have a >95% chance of being correct, find SALMA /SLABOCA = 0.97±0.07 , confirming that the
0.04
a reliability of 80% is still encouraging given the uncer- ALMA and LABOCA flux density scales are in reason-
tainties. Moreover, our results really only give a lower able agreement. An analysis of the astrometry indicates
limit on the reliability, since there may be some coun- that the ALMA SMG positions are accurate to within
terparts with submillimeter emission just below our de- 0.2 –0.3 .
tection threshold. For example, in LESS 2, there is a We discuss the creation of the catalog, including a
predicted counterpart at the position of a ∼3σ submil- MAIN sample of 99 ALESS SMGs and a supplemen-
limeter peak, which is just below our detection thresh- tary sample of 32 SMGs. The MAIN sample SMGs are
old but (given this alignment) likely real. If we consider the most reliable, while the supplementary sample SMGs
both robust and tentative IDs, then there are a total of should be used with care.
85 radio/mid–infrared counterparts (57 robust + 28 ten- Using this catalog, we put constraints on the sizes of
tative) falling in MAIN sample maps. Of these, 54 are the SMGs in submillimeter continuum. We find that
confirmed by the ALMA maps (∼65%). all but one SMG are consistent with point sources, sug-
Note that we did not include the blank maps in the gesting sizes <10 kpc and a median SFR surface density
above analysis, even though they are also of high qual- >14 M yr−1 kpc−2 . The resolved SMG (ALESS 007.1)
ity, since the positions of the SMG(s) in those maps re- has an intrinsic source size of (1.1 ±0.3 ) × (0.7 ±0.2 ),
main unconstrained. Of the 17 blank maps, 11 have at corresponding to ∼9 kpc × 5 kpc at its estimated red-
least one predicted radio/mid–IR counterpart. In several shift of zphot = 2.8. Its SFR surface density is ∼80 M
cases – e.g., LESS 27, LESS 47, LESS 95 (slightly offset), yr−1 kpc−2 , consistent with previous measurements for
and LESS 120 – these counterparts coincide with a ∼3σ SMGs from high–J CO lines and well below the limit for
submillimeter peak, indicating that the predicted SMG Eddington–limited star formation.
may be correct but just below our detection threshold. With our ∼1.6 resolution, we find that many of the
In the case of LESS 27, there are actually three predicted LESS sources are resolved into multiple distinct SMGs.
counterparts, and all three coincide with ∼3σ sources in Of the good quality maps with at least one detection,
the ALMA map. This case in particular supports the ∼35%–45% contain multiple SMGs. This is likely due to
proposal put forward in §5.3 that these maps are blank the low resolution of the original LESS survey and/or the
because they have been resolved into multiple SMGs with clustering of SMGs. We find that the brighter sources are
flux densities too faint to detect. preferentially affected, though this may be an artifact of
To summarize, if we consider only robust counterparts, the single–dish selection and sensitivity limitations. An
then the radio/mid–infrared identification process has a analysis of the separation between multiple SMGs yields
completeness of only ∼45%, but a reliability of ∼80%. no evidence for a significant excess of SMGs with small
If we include tentative counterparts as well, then the (<60 kpc) projected separations.
completeness rises to ∼55% and the reliability drops to We report that 17 out of 88 good–quality maps (∼20%)
∼65%. This process therefore still misses ∼45% of SMGs, have no detected SMGs, even though only ∼3.5 of the
and of those it claims to find, approximately one–third LESS sources are expected to be spurious. It may be that
are incorrect. We conclude that submillimeter interfer- the emission from these LESS sources has been spread
ometry is really the best and only way to obtain accurate out into diffuse or multi–component morphologies below
identifications for SMGs. our detection threshold. Assuming it is the latter, we
calculate the number of SMGs necessary in each map
6. SUMMARY
for the flux densities of the SMGs to be just below the
We have presented an ALMA Cycle 0 survey of SMGs detection threshold. We find that at S870µm ∼ 1.3 mJy,
in the Extended Chandra Deep Field South. These >500 SMGs mJy−1 deg−2 would be necessary in order to
SMGs were originally detected with the (single–dish) explain our non–detections, a number which is consistent
LESS survey on the APEX telescope, the single largest, with the faint end extrapolation of the ALESS number
most homogenous 870µm survey to date. Our ALMA ob- counts (Karim et al. 2012). If all 17 blank–map sources
servations utilize the Cycle 0 compact array in Band 7 to are actually multiple SMGs, the total fraction of multiple
map 122 of the 126 SMGs at the same central frequency SMGs in the survey rises to ∼50%.
as LESS. In just two minutes per source, we reach a me- We use the ALESS catalog to empirically calibrate the
dian rms noise of 0.4 mJy beam−1 , three times as deep as uncertainty in the LABOCA positions as a function of
the LESS observations. Our median angular resolution signal–to–noise. We find that the observed positional
(1.6 × 1.15 ) represents an improvement in beam area offsets are consistent with the theoretical prediction, in-
of ∼200 times, allowing us to precisely locate the origin dicating no additional sources of astrometric error for
of the submillimeter emission from the SMGs. the LESS sources. However, the median offsets mea-
We identify and extract sources from the final maps. sured are systematically higher than predicted offsets at
recovering 99% of all SMGs above 3.5σ with a spurious large values of S/N, implying that counterpart searches
fraction of 1.6%. From an analysis of the inverted maps, may be better off using a fixed search radius than a S/N–
we estimate that 75%/90% of SMGs above 3.5σ/4σ may
14. 14 Hodge et al.
dependent search radius. in prep).
Finally, we use the precise submillimeter positions
for our SMGs to test the reliability/completeness of
radio/mid–IR counterparts previously predicted using The authors wish to thank George Bendo and the
a probabilistic method. We find that overall, the Manchester ALMA ARC node for their support. AK
radio/mid–infrared ID process only correctly predicts acknowledges support from STFC, and AMS and TRG
∼55% of ALESS SMGs. It has a higher success rate gratefully acknowledge STFC Advanced Fellowships.
for the brighter LESS sources, or if we only consider IRS acknowledges support from STFC and a Leverhume
the brightest ALESS SMG in fields with multiple SMGs. Fellowship. KEKC acknowledges support from the en-
The depth of the radio data may be one limiting fac- dowment of the Lorne Trottier Chair in Astrophysics
tor, although there are also a significant number of cases and Cosmology at McGill, the Natural Science and En-
where the SMG falls outside the (S/N–dependent) search gineering Research Council of Canada (NSERC), and a
radius, again bringing its effectiveness into question. Of L’Oreal Canada for Women in Science Research Excel-
the counterparts predicted by the radio/mid–IR method, lence Fellowship, with the support of the Canadian Com-
we also find that one–third are incorrect, further high- mission for UNESCO. TRG acknowledges the IDA and
lighting the importance of submillimeter interferometry DARK. This paper makes use of the following ALMA
for obtaining accurate identifications for SMGs. data: ADS/JAO.ALMA#2011.1.00294.S. ALMA is a
In conclusion, we have completed the first statistically– partnership of ESO (representing its member states),
reliable survey of SMGs by combining a wide–field NSF (USA) and NINS (Japan), together with NRC
single–dish 870µm survey using LABOCA with targeted (Canada) and NSC and ASIAA (Taiwan), in coopera-
interferometric 870µm observations of detected sources tion with the Republic of Chile. The Joint ALMA Ob-
with ALMA. This study provides the basis for the un- servatory is operated by ESO, AUI/NRAO and NAOJ.
biased multiwavelength study of the properties of this This publication also makes use of data acquired with
population, including the high–resolution number counts the APEX under program IDs 078.F-9028(A), 079.F-
of SMGs (Karim et al. 2012), constraints on the number 9500(A), 080.A-3023(A) and 081.F-9500(A). APEX is a
density of z ∼ 4 SMGs (Swinbank et al. 2012), the prop- collaboration between the Max–Planck–Institut f¨r Ra-
u
erties of AGN in SMGs (Coppin et al. 2012, Wang et al. dioastronomie, the European Southern Observatory and
in prep), and their redshift distribution (Simpson et al. the Onsala Space Observatory.
APPENDIX
DETAILS OF THE SOURCE EXTRACTION AND CHARACTERIZATION
As discussed in §3.1, we used custom–written idl–based source extraction software to identify and fit SMGs in
the ALMA maps. We already demonstrated that casa’s imfit task returns comparable values for the fits, verifying
our results. Nevertheless, for completeness, we now elaborate further on our source extraction and characterization
process.
For each of the fits (three– and six–parameters), we determined the step size for each parameter that best balanced
fast convergence and good mixing of the Markov chain by looking at individual maps. On average, we reached an
acceptance probability of 30% after an initial and sufficiently long thermalization phase. This value is within the
optimal range for a multi-dimensional MH-MCMC algorithm. The box size was optimized to ensure that all visually
apparent double sources in the maps were individually recovered while minimizing the number of clear fitting artifacts.
There are physical prior constraints for a valid model description of the flux density distribution of an elliptical
source model in an interferometry map. In order not to violate the detailed balance condition and to ensure ergodicity
of the Markov chain, however, it is important not to constrain the random walk through the six-dimensional parameter
space which is consequently chosen to follow a symmetric attempt distribution about the previous value for a given
parameter. We do not violate the MH-MCMC principles if we constrain the actual move acceptance which therefore
underlies the following constraints:
1. The minor extent of a given source cannot be smaller than the clean beam minor axis.
2. The ratio of major to minor axis must not exceed twice the corresponding axis ratio of the clean beam.
3. The peak flux density must be a positive value.
For each parameter, the mean of the posterior distribution determined its best fit value. The full set of parameters
obtained in this way was used as a flux density model to be subtracted off the initial map before proceeding to the
next signal peak within the map. This process was repeated until the threshold was reached, and the end result was
a combined model as well as a residual map.
ERROR DETERMINATION, INTEGRATED FLUX DENSITIES, AND BEAM DECONVOLUTION
In the presence of correlations in the Markov chain, effectively only N/2θA statistically independent measurements
of the parameter A have been performed, where θA denotes the data autocorrelation length and N is the number of
MCMC steps after the equilibration phase. In practice, we therefore monitor the autocorrelation of the Markov chain
and bin the data in NB = N/NL blocks of length NL > θA . We then calculate for each bin the mean value: