3. I. Current ratio
Current ratio = current Assets / Current liabilities
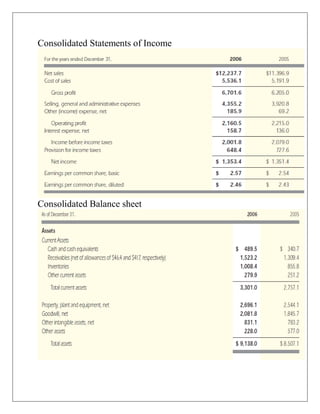
Current ratio2005 = 2757.1$ / 2743.0$ = 1.005
Current ratio 2006 = 3301.0$ / 3469.1$ = 0.95
Years 2005 2006
Current Ratios 1.005 0.95
interpretation:
In 2005 the company ability to pay its current Liabilities with current assets was
1.005 in 2006 the current ratio goes down from 1.005 to 0.95 which means that the
company has not ability to pay its Liabilities, Higher the ratio higher the ability of
the company to pay its bills. the ratio in 2006 tells that the Colgate company not
improving their liquidity and efficiency, because their current ratio is not improving
it goes down from previous year.
II. Acid-Test (Quick Ratio)
Quick ratio = (current assets - inventory) / current liabilities
Quick ratio 2005 = 2757.1$ -1008.4$ / 2743.0$ = 0.63
Quick ratio 2006 = 3301.0$ -1008.4$ / 3469.1$ = 0.66
Years 2005 2006
Quick ratios 0.63 0.66
interpretation:
According to the definition of Acid Test Ratio, the company should have the ability
to pay its liabilities through its most liquid assets. The Colgate company Quick ratio
in 2005 is 0.63. then in 2006 it goes up from 063 to 0.66. So we can figure out from
the ratios that Colgate still cannot pay its debts without its inventory.
4. III. Inventory Turnover
Inventory Turnover = Sales / inventory
Inventory Turnover 2005= 11396.9$/855.8$ = 13.31
Inventory Turnover 2006=12237.7$/1008.4$ = 12.13
Years 2005 2006
In. Turnover ratio 13.31 12.13
interpretation:
Inventory turnover ratios goes down from 2005to 2006, which means that its ability
to sell inventory has relatively come down. Higher inventory turnover ratios are
considered a positive sign of effective inventory management. Inventory turnover is
a measure of the company's ability to sell its products for cash.
IV. Average Collection Period
ACP = Receivables / Average sales per day
ACP = Receivables / Sales/365
ACP 2005= 1309.4$/ 11396.9/365$ = 42 days
ACP2006= 1523.2$ /12237.7$/365 = 45 days
Years 2005 2006
ACP ratios 42 days 45 days
Interpretation
An average collection period shows the average number of days necessary to convert
business receivables into cash.in 2005 the Colgate company ACP was 42 days.in
2006 the ratio increase from 42 to 45 days. the increase in ratio shows that the
company cash receiving department not work efficiently. Low average collection
period is good and favorable for the company.
5. V. Total Assets Turnover
TA Turnover = Sales / Total Assets
TA Turnover 2005 = 11396.9$/8507.1$ = 1.33
TA Turnover 2006 = 12237.7$/9138.0$ = 1.33
Years 2005 2006
TA turnover ratio 1.33 1.33
interpretation:
The asset turnover ratio is an efficiency ratio that measures a company ability to
generate sales from its assets by comparing net sales with average total assets. higher
ratio is always more favorable. Higher turnover ratios mean the company is using its
assets more efficiently. In 2005 & 2006 TA assets turnover ratio is same, its means
that the company generate more revenue per dollar investment the asset turnover
ratio is based on company performance. Some companies use assets more efficiently
than others.
VI. Fixed Assets Turnover
FA turnover = Sales / Net fixed assets
FA turnover 2005=11396.9$/5950$ = 1.91
FA turnover 2006=12237.7$/5837$ = 2.09
Year 2005 2006
FA turnover ratio 1.91 2.09
Interpretation:
Fixed asset turnover measures how well a company is using its fixed assets to
generate revenues. The Colgate company FA turnover ratio in 2005 is 1.91 in 2006
it goes up to 2.09. the increase ratio indicates that a company spent less money in
fixed assets for each dollar of sales revenue.
6. VII. Debt Ratio
Debt ratio = Total liabilities / Total assets
Debt ratio 2005 =7157.0$/8507.1$ = 0.84%
Debt ratio 2006 =7727.1$/9138.0$ = 0.84%
Years 2005 2006
Debt ratios 0.84% 0.84%
Interpretation:
The ratio shows the company’s ability to cover its debts through its total assets.
There is no difference in ratio in 2005 & 2006.
VIII. Times-Interest-Earned (TIE) Ratio
TIE = EBIT / Interest expense
TIE ratio 2005 =2079.0$/136.0$ = 15.28
TIE ratio 2006= 2001.8$/158.7$= 12.61
Years 2005 2006
TIE ratio 15.28 12.61
Interpretation:
In 2005 the TIE ratio is 15.28 in 2006 it goes down from 15.28 to 12.61. which is
not favorable for the company Times interest earned (TIE) is used to measure a
company's ability to meet its debt obligations. the larger ratios are considered more
favorable than smaller ratios.
7. IX. Gross Profit Margin
Profit Margin = Gross profit/ sales
Profit Margin 2005 = 6205.0$/11396.9= 54%
Profit Margin 2006= 6701.6$/12237.7= 54%
Years 2005 2006
Profit Margin ratio 54% 54%
Interpretation:
The ratio should be high according to the definition. Because higher the ratio, higher
will be the firm’s ability to produce goods and services at low cost with high sales.
Here in this table there is no difference between the ratios in two years, but it’s still
high, which means it is favorable.
X. Operating Profit Margin
Operating Profit Margin = EBIT/Sales
OPM 2005= 2079.0$/11396.9$=18%
OPM 2006=2001.8$/12237.7$= 16%
Years 2005 2006
OPM ratio 18% 16%
Interpretation:
operating profit margin has decreased in 2006 the profit ratio 1n 2005 is 18%. The
low ratio in 2006 reflects that the Colgate company is not more efficient in cost
management Operating margin ratio shows whether the fixed costs are too high for
the production or sales volume. High or increasing operating margin is preferred
because if the operating margin is increasing, the company is earning more per dollar
of sales.
8. XI. Net Profit Margin
Net Profit Margin = Net income /Sales
NPM ratio 2005=1351.4$/11396.9$= 11%
NPM ratio 2006=1353.4$/12237.7$= 11%
Years 2005 2006
NPM ratio 11% 11%
Interpretation:
According to the definition, higher the ratio, higher will be the firm’s ability to pay
its taxes. The Colgate NPM ratio in 2005 & 2006 is 11% there is no difference
between the ratios in two years. Company is more efficient at converting sales into
actual profit and its cost control is good.
XII. Return on total assets (ROA)
ROA = Net income /Total Assets
ROA 2005 =11396.9$/8507.1$ =33.9%
ROA 2006=12237.7$/9138.0$= 33.9%
Years 2005 2006
ROA ratio 33.9% 33.9%
Interpretation:
The return on assets ratio measures how effectively a company can earn a return on
its investment in assets. Colgate ROA ratio 1n 2005 & 2006 are equal. There is no
increase decrease in Return on Assets indicates that the company is generating
more profits from all of its resources