1. Assessment of Obesity and Classification of Patients; Historical Perspectives and Current Practice.pdf
•
0 likes•7 views

Obesity and Classification of Patients; Historical Perspectives and Current Practice.pdf

Recommended
More Related Content
Similar to 1. Assessment of Obesity and Classification of Patients; Historical Perspectives and Current Practice.pdf
Similar to 1. Assessment of Obesity and Classification of Patients; Historical Perspectives and Current Practice.pdf (20)
Recently uploaded
Recently uploaded (20)
1. Assessment of Obesity and Classification of Patients; Historical Perspectives and Current Practice.pdf
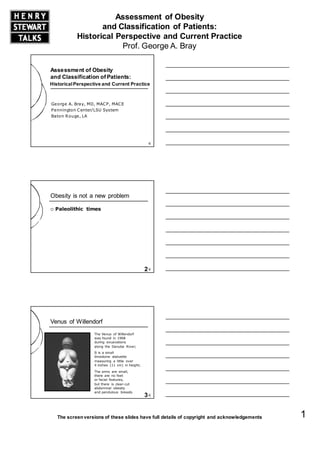
- 1. Assessment of Obesity and Classification of Patients: Historical Perspective and Current Practice Prof. George A. Bray The screenversions of these slides have full details of copyright and acknowledgements 1 Assessment of Obesity and Classification of Patients: George A. Bray, MD, MACP, MACE Pennington Center/LSU System Baton Rouge, LA HistoricalPerspective and Current Practice 2 Obesity is not a new problem Paleolithic times 3 Venus of Willendorf The Venus of Willendorf was found in 1908 during excavations along the Danube River; It is a small limestone statuette measuring a little over 4 inches (11 cm) in height; The arms are small, there are no feet or facial features, but there is clear-cut abdominal obesity and pendulous breasts
- 2. Assessment of Obesity and Classification of Patients: Historical Perspective and Current Practice Prof. George A. Bray The screenversions of these slides have full details of copyright and acknowledgements 2 4 Map showing locations of Venuses across Europe 5 Diagram of several figurines 6 Obesity is not a new problem Paleolithic times Neolithic times
- 3. Assessment of Obesity and Classification of Patients: Historical Perspective and Current Practice Prof. George A. Bray The screenversions of these slides have full details of copyright and acknowledgements 3 7 Venus of Catalhoyuk (Turkey) Baked clay figure from the first half of the 6th millennium BCE; The female figure is sitting on a leopard throne Very heavy buttocks, thighs and arms 8 Obesity is not a new problem Paleolithic times Neolithic times MesoAmerican times 9 Mayan figurine This baked decorated clay figure of a Mayan man shows the large protuberant abdomen of central adiposity
- 4. Assessment of Obesity and Classification of Patients: Historical Perspective and Current Practice Prof. George A. Bray The screenversions of these slides have full details of copyright and acknowledgements 4 10 Obesity is not a new problem Paleolithic times Neolithic times MesoAmerican times Historical times to 1500 AD 11 Historical cultures Mesopotamian Egyptian Chinese Tibetan Indian Greco-Roman 12 Hippocrates on treatment of obesity Hippocrates (460-370 BC) is called the “Father of Medicine”; Born on the Island of Cos; His major achievements were to Separate medicine from Philosophy, to give a scientific base for clinical care and to give physicians high moral aspirations
- 5. Assessment of Obesity and Classification of Patients: Historical Perspective and Current Practice Prof. George A. Bray The screenversions of these slides have full details of copyright and acknowledgements 5 13 Hippocrates on treatment of obesity Obese people and those desiring to lose weight should perform hard work before food Meals should be taken after exertion and while still panting from fatigue and with no other refreshment before meals except only wine, diluted and slightly cold 14 Obesity is not a new problem Paleolithic times Neolithic times MesoAmerican times Historical times to 1500 AD Modern times from to 2000 AD 15 Malcolm Flemyng on obesity as a disease - 1760 Corpulency, when in an extraordinary degree, may be reckoned a disease, as it in some measure obstructs the free exercise of the animal functions; and has a tendency to shorten life, by paving the way to dangerous distempers
- 6. Assessment of Obesity and Classification of Patients: Historical Perspective and Current Practice Prof. George A. Bray The screenversions of these slides have full details of copyright and acknowledgements 6 16 William Wadd - 1810 Title of his 1810 monograph: “Cursory Remarks on Corpulence; or Obesity Considered as a Disease” 17 William Wadd – 1810 “If the increase of wealth and refinement of modern times, have tended to banish plague and pestilence from our cities, they have probably introduced the whole train of nervous disorders, and increased the frequency of corpulence” 18 William Wadd’s patient - 1810 Indeed, inactivity somnolency, depression of spirits, and an inaptitude for study, were symptoms sufficient to produce anxiety; By an abstemious mode of living, and a vegetable diet, he became lighter, more capable of mental exertion, and in every respect improved in health but whenever he resumed his former habits, his complaints returned in full force
- 7. Assessment of Obesity and Classification of Patients: Historical Perspective and Current Practice Prof. George A. Bray The screenversions of these slides have full details of copyright and acknowledgements 7 19 Modern themes Metabolism is like a burning candle 20 Picture of Lavoisier Antoine-Laurent Lavoisier (1743-1794) demolished the phlogiston theory and replaced it with the oxygen theory of metabolism “He and he alone discovered the meaning of oxygen in metabolism” 21 Modern themes Metabolism is like a burning candle Not all obesity is the same
- 8. Assessment of Obesity and Classification of Patients: Historical Perspective and Current Practice Prof. George A. Bray The screenversions of these slides have full details of copyright and acknowledgements 8 22 Picture of Cushing Harvey Williams Cushing (1869-1939) was the father of neurosurgery He identified the basophil of the pituitary as one cause of obesity, hypertension, and pigmented skin changes 23 Not all obesities are the same: classifications 1900-1950 Author Year Classes Noorden 1900 Exogenous Endogenous Zondek 1926 Alimentary (gluttony) Endocrine Localized (lipomatosis) Jarlov 1932 Hypertrophic – diffuse Plethoric Myxematoid Lipomatoid Rony 1940 Specific forms (endocrine) Essential Mixed 24 Author Year Classes Vague 1956 Gynoid Android Mayer 1960 Metabolic Regulatory Hirsch 1970 Hypercellular Normocellular Bray York 1971 Genetic Hypothalamic Dietary Physical inactivity Endocrine Not all obesities are the same: classifications 1950-1970
- 9. Assessment of Obesity and Classification of Patients: Historical Perspective and Current Practice Prof. George A. Bray The screenversions of these slides have full details of copyright and acknowledgements 9 25 Modern themes Metabolism is like a burning candle Not all obesity is the same Body mass index and risk to health 26 Quetelet and the body mass index Lambert-Adolphe-Jacques Q uetelet (1796-1874) Introduced the concept of the body mass index as a tool to assess differences among human beings in 1835 In addition to statistics, Q uetelet taught mathematics, astronomy and physics 27 Quetelet - a treatise on man and the development of his faculties 1835 “If we compare two individuals who are fully developed and well-formed with each other, to ascertain the relations existing between the weight and stature, we shall find that the weight of developed persons, of different heights, is nearly as the square of the stature Whence it naturally follows, that a transverse section, giving both the breadth and thickness, is just proportional to the height of the individual; We furthermore conclude that, proportion still being attended, width predominates in individuals of small stature”
- 10. Assessment of Obesity and Classification of Patients: Historical Perspective and Current Practice Prof. George A. Bray The screenversions of these slides have full details of copyright and acknowledgements 10 28 Distribution curve for body weight 0.00 0.05 0.10 Body weight groups Probability density -15 -10 -5 0 5 10 15 20 25 30 35 40 45 29 Relative risk of mortality in average or underweight insured people - 1913 Deviation Weight in lbs Actual Deaths Expected Deaths Mortality Ratio -25 to –30 9,873 9,442 1.04 -15 to –20 7,997 7,481 1.07 -10 1,574 1,637 .96 -5 1,480 1,529 .97 Average 1,381 1,422 .97 Medico-Actuarial Mortality Investigation NY 1913;2:5-9,44-47 All Ages at Entry and Policy Years Combined 30 Relative risk of mortality for overweight people - 1913 Medico-Actuarial Mortality Investigation NY 1913;2:5-9,44-47 All Ages at Entry and Policy Years Combined Mortality Ratio Expected Deaths Actual Deaths Deviation in Weight in lbs .97 1,422 1,381 Average 2.23 106 236 + 85 and more 1.65 695 1,144 +65 to + 80 1.44 2,563 3,697 +50 to + 60 1.31 3,876 5,061 +35 to +45 1.13 1,122 1,267 +25 to +30 1.04 1,443 1,497 +15 to +20 .97 999 970 + 10 .99 1,188 1,176 + 5 Mortality Ratio Expected Deaths Actual Deaths Deviation in Weight in lbs .97 1,422 1,381 Average 2.23 106 236 + 85 and more 1.65 695 1,144 +65 to + 80 1.44 2,563 3,697 +50 to + 60 1.31 3,876 5,061 +35 to +45 1.13 1,122 1,267 +25 to +30 1.04 1,443 1,497 +15 to +20 .97 999 970 + 10 .99 1,188 1,176 + 5
- 11. Assessment of Obesity and Classification of Patients: Historical Perspective and Current Practice Prof. George A. Bray The screenversions of these slides have full details of copyright and acknowledgements 11 31 Insurance data 1913 Medico-Actuarial Mortality Investigation NY 1913;2:5-9,44-47 -30 -20 -10 0 10 20 30 40 50 60 70 80 90 1.0 1.5 2.0 2.5 Percent Deviation Relative Risk of Mortality Men W omen 32 Framingham study - women 90 0 100 100 110 120 130 140 200 300 400 500 600 700 Metropolitan relative weight Deaths per 1000 6 12 18 24 30 33 Cohort size, duration of follow-up and risk of mortality with increased BMI Adapted from Sjostrom AJCN 1992 0 10 20 30 40 10 2 Years of Follow-up 10 3 10 4 10 5 10 6 10 7 10 8 Population Size (log Scale) Positiv e Negativ e
- 12. Assessment of Obesity and Classification of Patients: Historical Perspective and Current Practice Prof. George A. Bray The screenversions of these slides have full details of copyright and acknowledgements 12 34 Mortality ratios as a function of time Mortality Ratios by Duration of Policy Years 1-5 6-10 11-15 16-22 Men aged 15-69 25 % underweight 1.27 1.19 1.14 1.05 Men 15-25 % overweight 1.06 1.14 1.23 1.31 Women aged 15-69 25 % underweight 1.67 1.28 1.34 0.90 Women 15-25 % overweight 1.06 1.03 1.13 1.12 Sjostrom AJCN 1992;55:16S-23S 35 Is overweight a risk to your health? T he authorities say obesity is a disease that increases dysfunction as it gets more severe Population studies show heavier people have higher risk of death than average weight ones Underweight people have high early risk T he discrepancies occur when short-term or small size studies are used 36 Very High Risk High Risk Moderate Risk Very Low Risk Low Risk Body mass index cut-points based on life insurance data 15 20 25 30 35 40 Body Mass Index (Kg/(m)2) Mortality Ratio 300 250 200 150 100 50 0 20-29 30-39 Age at Issue Digestive Pulmonary Disease Cardiovascular Gall Bladder Diabetes Mellitus
- 13. Assessment of Obesity and Classification of Patients: Historical Perspective and Current Practice Prof. George A. Bray The screenversions of these slides have full details of copyright and acknowledgements 13 37 Clinical History Clinical Classification Vital Signs Laboratory Measures Evaluation 38 Evaluation: clinical history Previous weight • At 18-20 years of age • One year earlier Activity level • Since age 18-20 • Recent Nutrition history • Foods consumed • Changes in diet When did the problem start? • Recent • Long term 39 Clinical History Vital Signs Laboratory Measures Clinical Classification Evaluation
- 14. Assessment of Obesity and Classification of Patients: Historical Perspective and Current Practice Prof. George A. Bray The screenversions of these slides have full details of copyright and acknowledgements 14 40 Vital signs Body mass index 41 Permits population-based studies of trends in obesity and is used for clinical guidelines Does not correlate well with fat mass in both over-muscled (athletic) and under-muscled (sarcopenic) patients Does not reveal differences in fat distribution (visceral vs. subcutaneous) Does not measure fat directly but correlates with body fat over thousands of average patients At any given BMI, women have about 12% more fat than men Utility and limitations of the BMI A T able of Body Mass Index (BMI) Copyright 1997 George A. Bray 91 94 97 100 104 107 110 114 118 121 125 128 132 136 140 144 148 152 156 96 99 102 106 109 113 116 120 124 127 131 135 139 143 147 151 155 160 164 100 104 107 111 115 118 122 126 130 134 138 142 146 150 154 159 163 168 172 105 109 112 116 120 124 128 132 136 140 144 149 153 157 162 166 171 176 180 110 114 118 122 126 130 134 138 142 146 151 155 160 165 169 174 179 184 189 115 119 123 127 131 135 140 144 148 153 158 162 167 172 177 182 186 192 197 119 124 128 132 136 141 145 150 155 159 164 169 174 179 184 189 194 200 205 124 128 133 137 142 146 151 156 161 166 171 176 181 186 191 197 202 208 213 129 133 138 143 147 152 157 162 167 172 177 182 188 193 199 204 210 216 221 134 138 143 148 153 158 163 168 173 178 184 189 195 200 206 212 218 224 230 138 143 148 153 158 163 169 174 179 185 190 196 202 208 213 219 225 232 238 148 153 158 164 169 175 180 186 192 198 203 209 216 222 228 235 241 248 254 167 173 179 185 191 197 204 210 216 223 230 236 243 250 258 265 272 279 287 191 198 204 211 218 225 232 240 247 255 262 270 278 286 294 302 311 319 328 38 39 143 148 153 158 164 169 174 180 186 191 197 203 209 215 221 227 233 240 246 153 158 163 169 175 180 186 192 198 204 210 216 222 229 235 242 249 256 263 158 163 168 174 180 186 192 198 204 211 216 223 229 236 242 250 256 264 271 162 168 174 180 186 191 197 204 210 217 223 230 236 243 250 257 264 272 279 172 178 184 190 196 203 209 216 223 230 236 243 250 257 265 272 280 287 295 177 183 189 195 202 208 215 222 229 236 243 250 257 265 272 280 287 295 304 181 188 194 201 207 214 221 228 235 242 249 257 264 272 279 288 295 303 312 186 193 199 206 213 220 227 234 241 249 256 263 271 279 287 295 303 311 320 BMI 4’10” 4’11” 5’ 5’1” 5’2” 5’3” 5’4” 5’5” 5’6” 5’7” 5’8” 5’9” 5’10” 5’11” 6’” 6’1” 6’2” 6’3” 6’4” 25 30 35 40 Good W eights Increasing Risk Height 19 20 21 22 23 24 26 27 28 29 31 32 33 34 36 37
- 15. Assessment of Obesity and Classification of Patients: Historical Perspective and Current Practice Prof. George A. Bray The screenversions of these slides have full details of copyright and acknowledgements 15 43 Classification using BMI *Note that these values are age-independent and the same for both sexes; However, BMI may not correspond to the same degree of fatness across different populations (see section 2.3.2); **Note that both BMI and a measure of fat distribution (waist circumference or waist hip ratio etc.) are important in calculating the risk of obesity co-morbidities; BMI 18.5 kg/m2 signifies an increased risk of developing other clinical problems Classification Underweight Normal range Overweight Obese Class I Class II Class III BMI (kg/m2 )* 18.5 18.5 - 24.9 25.0 - 29.9 30.0 30.0 - 34.9 35.0 - 39.9 40.0 Risk of co-morbidities** Low Very Low Low Moderate High Very High 44 Vital signs Body mass index Waist circumference 45 Intra-abdominal Fat Abdominal Muscle Layer Subcutaneous Fat AbbottLaboratories Measure waist between iliac crest and lower ribs Waste circumference and visceral adiposity
- 16. Assessment of Obesity and Classification of Patients: Historical Perspective and Current Practice Prof. George A. Bray The screenversions of these slides have full details of copyright and acknowledgements 16 46 Type 2 Diabetes Normal Courtesy of Wilfred Y . Fujimoto, MD. Visceral fat distribution normal vs. type 2 diabetes 47 Waist Circumference – Measure only for patients with BMI between 25 and 34.9 Abdominal obesity: risk factor for CV D Measure abdomen horizontally at level of iliac crest 40” (102 cm) male 35” (88 cm) female Body Mass Index weight (kg) ÷ height (cm)2 OR weight (lb) x 703 ÷ height (in)2 Definitions BMI 25 kg/m2 = Overweight BMI 30 kg/m2 = Obesity Summary – two new vital signs Definitions 48 National Institutes of Health. Obes Res. 1998;6(suppl 2):51S–209S High Waist Circumference: Men 40˝ Women 35˝ This is correlated with visceral fat mass Obesity Waist Circumference BMI Class Low High Overweight 25.0 - 29.9 Increased High Obesity 30.0 - 34.9 I High V ery High Obesity 35.0 - 39.9 II Very High V ery High Extreme ≥ 40 III Extremely Extremely Obesity High High Risk Category BMI classification of overweight and obesity
- 17. Assessment of Obesity and Classification of Patients: Historical Perspective and Current Practice Prof. George A. Bray The screenversions of these slides have full details of copyright and acknowledgements 17 49 Vital signs Body mass index Waist circumference Blood pressure 50 Blood pressure categories from JNC VII ADA. Diabetes Care. 2002;25(suppl 1):S33-S49 Normal 120/80 Prehypertension 120-139/80-89 Hypertension 140/90 Stage 1 140-159/90-99 Stage 2 160/100 51 Clinical History Vital Signs Laboratory Measures Clinical Classification Evaluation
- 18. Assessment of Obesity and Classification of Patients: Historical Perspective and Current Practice Prof. George A. Bray The screenversions of these slides have full details of copyright and acknowledgements 18 52 Laboratory measurements Body Composition Lipids Instrumental methods for body composition Methods Hydrodensitometry Air Displacement Plethysmography Dual x-rayabsorptiometry (DXA) Isotope Dilution Impedance (BIA) 40K Counting Conductivity (TOBEC) CT Scan MRI Scan Neutron Activation Ultrasound Cost $$ $$$$ $$$ $$ $$ $$$$ $$$ $$$$ $$$$ $$$$+ $$ Ease of Use Easy Easy Easy Moderate Easy Difficult Difficult Difficult Difficult Difficult Moderate Can Measure Regional Fat No No + No + No ± ++ ++ No + External Radiation tr ++ +++ * Special Equipment; $=Inexpensive;$$=Some expense;$$$=Expensive;$$$$=Very Expensive;tr+trace E=Easy;M=Moderate Experience Needed;D=Difficult 54 Lev el I (Whole Body) Five levels of body composition Lev el III (Cellular) Lev el II (Tissue and Organ-System) Lev el IV (Molecular) Lev el V (Atomic) Other Blood Skeletal Muscle Skeleton Adipose Tissue ECF ECS CellMass (connective tissue,neural, muscle, epithelial) Fat Cell Mass Glycogen Protein Water Lipid Minerals Other Other Hydrogen Oxygen Carbon Calcium Nitrogen
- 19. Assessment of Obesity and Classification of Patients: Historical Perspective and Current Practice Prof. George A. Bray The screenversions of these slides have full details of copyright and acknowledgements 19 55 BodyComposition Lean Obese Weight (kg) Fat Protein Water Other 100 80 60 40 20 0 40 80 120 160 200 240 280 320 360 Lean Obese Energy Content ( kcal x 10 3 ) Body composition and energy content with weight gain EnergyContent 56 0 20 40 60 80 100 10-19 20-29 30-39 40-49 50-59 60-69 70-79 Relative segmental fat volume (%) Head Fore-arm Upper arm Chest Abdomen (subcutaneous) Abdomen (visceral) Thigh Calf MEN Age (years) Changes in different fat volumes with age in men 57 0 20 40 60 80 100 10-19 20-29 30-39 40-49 50-59 60-69 70-79 Relative segme ntal fat volume (%) Head Fore-arm Upper arm Chest Abdomen (subcutaneous) Abdomen (visceral) Thigh Calf W OMEN Age (years) Changes in different fat volumes with age in women
- 20. Assessment of Obesity and Classification of Patients: Historical Perspective and Current Practice Prof. George A. Bray The screenversions of these slides have full details of copyright and acknowledgements 20 58 Prevalence of obesity 10.4 11.8 12.3 22.0 27.5 15.0 16.2 16.5 24.9 33.5 0 5 10 15 20 25 30 35 Percent Obese (BMI 30 kg/m 2 ) Men W omen 1960-62 1971-74 1976-80 1988-91 1999-02 59 Prevalence of obesity in different ethnic groups MEN WOMEN White White Black Mexican- American Black Mexican- American 12 15 20 21.3 25.4 15.4 0 10 20 30 40 Prev alence of Ov erweight (BMI 30 kg/m 2 ) 22 30 34.2 14.8 21.3 25.4 2nd survey 1st survey 60 Laboratory measurements Body Composition Lipids
- 21. Assessment of Obesity and Classification of Patients: Historical Perspective and Current Practice Prof. George A. Bray The screenversions of these slides have full details of copyright and acknowledgements 21 61 Lipid targets in diabetes 1. ADA. Diabetes Care. 2002;25(suppl 1):S33-S49. 2. Expert Panel on Detection, Evaluation, and T reatment of High Blood Cholesterol in Adults. JAMA. 2001;285:2486-249 7 ADA Target1 mg/dL NCEP Guidelines2 mg/dL Total cholesterol 200 LDL cholesterol 100 100 HDL cholesterol 45 men 60 women 60 Triglycerides 150 Normal 150 Borderline 150-190 62 Laboratory measurements Body Composition Lipids Glucose 63 Diagnosis of diabetes: plasma glucose cutoff points Category mg/dL mmol/L mg/dL mmol/L Normal 100 5.5 140 7.8 IFG 110 to 126 5.5 to 6.9 _ _ IGT _ _ 140 to 200 7.8 to 11.1 Diabetes ≥126 ≥7.0 ≥200 ≥11.1 Fasting Plasma Glucose 2-Hour on OGTT Data from The Expert Committee on the Diagnosis and Classification of Diabetes Mellitus. Diabetes Care. 1997;20:1183-1197
- 22. Assessment of Obesity and Classification of Patients: Historical Perspective and Current Practice Prof. George A. Bray The screenversions of these slides have full details of copyright and acknowledgements 22 64 NCEP: ATPIII clinical diagnosis of the metabolic syndrome* Risk Factor Defining Measures Abdominal obesity Waist circumfere nce Men 40 in (102 cm) Women 35 in (88 cm) TG ≥150 mg/dL HDL-C Men 40 mg/dL Women 50 mg/dL Blood pressure ≥130/85 mm Hg Fasting glucose ≥110 mg/dL * ≥3 risk factors comprise a diagnosis of the metabolic syndrome; Expert Panel on Detection, Evaluation, and T reatment of High Blood Cholesterol in Adults; JAMA. 2001;285:2486-2497 65 Laboratory measurements Body Composition Lipids Glucose C-reactive protein 66 Clinical History Vital Signs Laboratory Measures Clinical Classification Evaluation
- 23. Assessment of Obesity and Classification of Patients: Historical Perspective and Current Practice Prof. George A. Bray The screenversions of these slides have full details of copyright and acknowledgements 23 67 Clinical classification Genetic Hypothalamic Dietary Physical inactivity Endocrine Summary 68 Genetic causes of obesity Monogenic Obesities Melanocortin-4 receptor defects Leptin deficiency Leptin receptor deficiency POMC deficiency Proconvertase-1 deficiency PPAR-γ Syndromic Obesities (Prader-Willi Syndrome) Polygenic Obesities (Others) Heritability of body weight Twins: Bjoreson Identical Fraternal
- 24. Assessment of Obesity and Classification of Patients: Historical Perspective and Current Practice Prof. George A. Bray The screenversions of these slides have full details of copyright and acknowledgements 24 70 Type of Studies Heritability Nuclear Families 30 - 50% Adoption 10 - 30% Twin Studies 50 - 80% Combined Strategy 25 - 40% Heritability of obesity 71 Clinical classification Genetic Hypothalamic Dietary Physical inactivity Endocrine Summary 72 Hypothalamic obesity Pathological Lesion 1. Tumors 2. Inflammation 3. Trauma Clinical Features Endocrine Disturbances 1. Amenorrhea/Impotence 2. Impaired growth 3. Diabetes insipidus 4. Thyroid/Adrenal insufficiency Increased Intracrani al Pressure 1. Papilledema 2. Vomiting Neurological Disturbances 1. Thirst 2. Somnolence
- 25. Assessment of Obesity and Classification of Patients: Historical Perspective and Current Practice Prof. George A. Bray The screenversions of these slides have full details of copyright and acknowledgements 25 73 Patient with hypothalamic obesity 100 90.9 81.8 72.7 63.6 54.5 Body W eight (kg) Onset 6 12 18 24 30 36 120 140 160 180 200 220 Body W eight (lbs) Duration of Illness (months) Amenorrhea C. Age 18 - F Diabetes Insipidus Lethargy, headache Decreased memory Galactorrhea + 74 Clinical classification Genetic Hypothalamic Dietary Physical inactivity Endocrine Summary 75 Some dietary factors Trigger Foods Large Portion Sizes High Energy Dense Food
- 26. Assessment of Obesity and Classification of Patients: Historical Perspective and Current Practice Prof. George A. Bray The screenversions of these slides have full details of copyright and acknowledgements 26 76 Clinical classification Genetic Hypothalamic Dietary Physical inactivity Endocrine Summary 77 Physical inactivity New Job with Less Activity Injury with Hospitalization Aging 78 Clinical classification Genetic Hypothalamic Dietary Physical inactivity Endocrine Summary
- 27. Assessment of Obesity and Classification of Patients: Historical Perspective and Current Practice Prof. George A. Bray The screenversions of these slides have full details of copyright and acknowledgements 27 79 Cushings syndrome Central Obesity Hypertension Plethoric Facies Amenorrhea Virilism (Hirsutism) Edema of Low er Extremities Hemorrhagic Features 80 Polycystic ovary syndrome Oligomenorrhea/Amenorrhea Hirsutism Poly cy stic Ovaries LH/FSH Testosterone/ SHBG Insulin Resistance Normal IGF-I IGF-I Binding Protein 81 Clinical classification Genetic Hypothalamic Dietary Physical inactivity Endocrine Summary
- 28. Assessment of Obesity and Classification of Patients: Historical Perspective and Current Practice Prof. George A. Bray The screenversions of these slides have full details of copyright and acknowledgements 28 82 Summary: Obesity has been a growing clinical problem for a long time The BMI, waist circumference, laboratory measurements provide a frame of reference of evaluating the risk Overweight and obesity are risks to health