SlideShare a Scribd company logo
1 of 8
Download to read offline
Q1 2014 » Putnam Perspectives

Capital Markets Outlook
Jason R. Vaillancourt, CFA®
Co-Head of Global Asset Allocation

Investment themes

Key takeaways

No bubble trouble; stocks are still
reasonably priced.

•	No bubble trouble; stocks are still reasonably priced.

As the S&P 500 closed 2013 at a record
high — after setting more than 20 previous
record highs during the past year — many
investors pondered whether stock valuations
might be getting excessive. Some pundits
have gone so far as to utter aloud the dreaded
B-word — bubble.

•	This credit cycle has unique characteristics that continue
to make high-yield bonds attractive.

l

U.S. small cap
EQUITY

U.S. large cap

l

U.S. value

l

U.S. growth

l

Europe

l

Japan

l
l

U.S. government
FIXED INCOME

Emerging markets

l

U.S. tax exempt

l

U.S. investment-grade corporates

l

U.S. mortgage-backed

l

U.S. floating-rate bank loans

l

U.S. high yield

l

Non-U.S. developed country

l

Emerging markets

l

COMMODITIES

l

CASH

l

CURRENCY SNAPSHOT

Dollar vs. euro: Neutral (from favor euro last quarter)
Dollar vs. pound: Neutral
Dollar vs. yen: Dollar (from neutral last quarter)

PROUD
SPONSOR

Overweight

Small overweight

Asset class

Neutral

Arrows in the table indicate the change
from the previous quarter.

Underweight

Putnam’s outlook

Small underweight

•	Interest-rate volatility poses greater risk than higher
rates themselves.

At Putnam our analysis indicates no cause
for alarm, but rather, we believe stocks may
continue to advance. The current valuation
of the market is just about normal relative
to long-term history, based on one of our
preferred valuation metrics: FCF yield (free
cash flow to price).
We believe it is also important to recognize
that in the broader context of capital markets
today, valuation is not the only thing that
matters. It certainly matters at extremes, but
even if stocks were moderately overvalued,
the market could still continue on an upward
trajectory for some time, as stocks tend to
overshoot in one direction or the other without
quickly reverting.
One of our chief reasons for optimism comes
from our monitoring of pent-up corporate
demand. As we described in recent quarters,
we have been studying the level of capital
investment by businesses, which has lagged
considerably during this recovery compared
with past cycles. During 2013, we noticed
some firming of capital investment, and more
recently we have started to see indications of
an improving trend in the data, particularly
with respect to non-defense ex-aircraft capital
goods orders. This uptick is corroborated by
the ISM survey’s new-orders component.
Q1 2014 |  Capital Markets Outlook

Figure 1. Stock valuations are near the

average of the past quarter century.

The current
valuation of the
market is just about
normal relative to
long-term history.

— Free cash flow yield 
— Average yield 1990–2013

12%

8

4

0
1/31/90

1995

2000

2005

2010

It appears businesses have finally gained adequate
confidence to sustain an increase in spending, which
can help GDP growth accelerate. The situation is similar
in other developed markets, particularly in Europe and
Japan, and we believe both regions have the capacity to
help drive global growth.

12/31/13

Source: Bloomberg. The graph shows
valuations of stocks in the SP 500
as measured by their free cash flow
yield. This is the amount of a company’s
operating cash flow minus the amount
of its capital expenditures, divided by
its stock’s price.

In Japan, the question continues to be the need for
material progress on Prime Minister Shinzō Abe’s “Third
Arrow” policies targeting structural reform. One of these
policies, a large sales tax increase, will take effect in April
and threatens to be a new drag on growth.
However, we continue to hold out hope for many of
Abe’s structural reforms to start to take shape in 2014. We
are closely monitoring the multilateral talks surrounding
the Trans-Pacific Partnership free trade agreement, which
is a key barometer of Abe’s ability to accomplish his policy
agenda. Abe was elected on a platform of returning Japan
to regional prominence, as a counterbalance to China, and
internal economic policy is one part of this larger political
project. At the same time, we recognize that policy
change follows different timelines in Japan than in the
United States, and a temporary setback for Abe might not
be definitive.

While we have a constructive outlook for Europe and
Japan, neither one is free of risks. In Europe, the underlying causes of poor credit conditions remain a major
question and still require greater clarity before we favor
an overweight to the region. Europe is recovering, but the
pace is anemic. Signs of insufficient credit demand mean
that we cannot yet assign this sluggish pace solely to a
lack of credit availability in the private sector. It could also
be caused by a tepid pace of new business creation and
innovation.
Remember that the United States showed similar
ambiguity in the early days of the recovery starting in mid
2009. Ultimately, credit availability improved once sufficient evidence emerged that demand was growing. We
are now looking for similar evidence for Europe. Our analysis is taking into account one of the important differences
between Europe and the United States: European credit
flows through banks, while U.S. credit flows primarily
through capital markets.

Outside of developed-market economies, the marginal
tightening (or in Fed-speak, “less accommodation”)
of U.S. monetary policy as the Fed begins reducing
its purchases of bonds in January will likely weigh on
growth in emerging markets, but without dragging down
developed markets. Countries with high current account
deficits and those reliant on external financing will be
hardest hit.

2
PUTNAM I NVESTM ENTS |  putnam.com

This credit cycle has unique characteristics
that continue to make high-yield bonds
attractive.

In the current cycle, we have seen only a partial
narrowing of valuations and credit spreads, and
corporations still sensitive to the pain of the 2008 financial
crisis have been somewhat slower to turn to merger and
acquisition activity. Also, the current cycle stands out from
most predecessors by virtue of its extremely low interest
rates and a dearth of nominal yields available to investors
around the world. The hunt for yield that has been a
hallmark of capital markets for several years is likely to be
another factor extending the length of this credit cycle.

The current economic recovery started in June 2009
according to the National Bureau of Economic Research.
Today, more than four years into the recovery, capital
market opportunities are shifting, with conditions in credit
sectors such as high-yield corporate debt becoming less
attractive. However, the current cycle has different characteristics that suggest investors should not abandon
credit strategies just yet.

Interest-rate volatility poses greater risk
than higher rates themselves.

First, let’s consider a typical cycle. By this point, the
valuations of high-yield credit relative to investmentgrade bonds, which were separated by a wide chasm in
2008 and 2009, have narrowed considerably. At the same
time, credit spreads have tightened, leaving credit sectors
with a less impressive yield advantage over higher-quality
issues. Third, we have begun to see a change in corporate
behavior that often emerges to diminish the attractiveness of credit, as companies begin to issue debt in order to
finance mergers and acquisitions. Greater debt issuance
tends to weaken balance sheets, even as buying pressure
supports equity prices.

The yield of the 10-year Treasury rose above 3% in the last
week of December, in the wake of the Fed’s announcement that it would reduce bond purchases beginning in
January. While rising yields are consistent with a strengthening economic recovery, they also prompt the concern
among businesses and investors that higher interest
expenses could become a drag on continued expansion.
We take a relatively positive view of rising rates, which,
on their own, should not be a cause for worry. Rather they
should be seen as a symptom of better growth prospects.
Indeed, longer-term real interest rates — as measured by
the difference between bond yields and inflation — have

Figure 2. Rising new manufacturing orders indicate

stronger corporate demand.

It appears businesses have
finally gained adequate
confidence to sustain
an increase in spending,
which can help GDP
growth accelerate.

70
60
50
40
30
20
1/2005

1/2007

1/2009

1/2011

1/2013

3

1/2014

Source: ISM Manufacturing Report on Business:
New Orders Component.
Q1 2014 |  Capital Markets Outlook

Figure 3. Treasury volatility increased sharply
in 2013 and could continue in 2014.

We see real risks ahead
as the Fed grapples with
communication challenges.

— MOVE Index of Treasury Option Volatility Index

200
180
160
140
120
100
80
60
40
1/2009

1/2010

1/2011

1/2012

1/2013

1/2014

Source: Merrill Options Volatility Index
reports the average implied volatility
across a wide range of outstanding
options on the two-year, five-year,
10-year, and 30-year U.S. Treasury
securities (with a total weight of 40
percent on the 10-year Treasury and
total weights of 20 percent each on the
other maturities).

Asset class views

been moving higher for almost two years. During the past
six months, long-term real rates even moved from negative levels to positive territory, yet economic growth and
employment gains have remained steady.

Equity
U.S. equity A strong fourth quarter and continued
economic growth helped U.S. equities extend their rally
and deliver their best annual performance since the
1990s. The market advance had a brief pause in October
when investors were distracted by the U.S. congressional budget debate and the 16-day partial shutdown of
the federal government. While ongoing concerns about
Federal Reserve policy weighed on equities somewhat,
the market responded favorably in late December when
the Fed announced its first modest reduction in asset
purchases. Throughout 2013, U.S. equity indexes achieved
and surpassed their all-time highs several times, with relatively low volatility.

While a continued glacial pace of rate increases does
not alarm us, we nevertheless see real risks ahead for the
Fed as it grapples with communication challenges. We
highlighted last quarter that the Fed is employing forward
guidance in an attempt to smoothly exit its extraordinary
policy initiatives: A mix of bond purchases and holding
short-term rates near 0%.
The Fed owns over $4 trillion in fixed-income securities, and how its policy goals influence its actions with this
portfolio has major consequences for the market. Investors may come to doubt the Fed’s forward guidance given
the central bank’s spotty record in economic forecasting.
These doubts could contribute to rate volatility across
the yield curve. Investors should be prepared to navigate
more interest-rate volatility as the Fed seeks to chart a
difficult course ahead.

U.S. equity performance in 2013 was top quartile by
historic measures, and our outlook is more tempered
heading into 2014. At the close of the year, equity valuations were in the middle of their historic range; with stocks
at average valuations, our expectation should be for
average returns. Also worth noting is the fact that most
stocks are trading at a price–earnings ratio of around 15x
earnings, meaning that valuations are essentially the same
across all market sectors. With considerably less disparity
in multiples, we believe U.S. equity investors should pay
closer attention to growth potential than to valuation.

4
PUTNAM I NVESTM ENTS |  putnam.com

Market trends
Q4 13

10.22%

29.65%

MSCI EAFE (ND)

5.71

22.78

MSCI Emerging Markets (ND)

1.83

-2.60

MSCI Europe (ND)

7.88

25.23

MSCI World (ND)

8.00

26.68

Nasdaq

12.03

36.92

Russell 1000

10.23

33.11

Russell 2000

8.72

38.82

10.25

34.23

9.95

32.69

10.51

32.39

4.60

23.96

Barclays Government Bond

-0.69

-2.60

Barclays MBS

-0.42

-1.41

0.33

-2.55

-0.14

-2.02

0.02

For example, as European countries gradually reduce
the intensity of their fiscal-austerity programs, there will
be less fiscal drag. This could result in better GDP growth,
improved revenue growth for corporations, and better
margins for companies that streamlined their operations
through the austere fiscal regimes instituted by European
governments.

12 months
ended
12/31/13

0.07

Index name (returns in US$)

EQUITY INDEXES

Dow Jones Industrial Average

Russell 3000 Growth
Russell 3000 Value
SP 500
Tokyo Topix
FIXED INCOME INDEXES

Barclays Municipal Bond
Barclays U.S. Aggregate Bond
BofA ML 91-day T-bill
CG World Government Bond ex-U.S.

-1.24
3.75

8.42

JPMorgan Emerging Markets
Global Diversified

1.53

-5.25

JPMorgan Global High Yield

3.64

7.41

SP LSTA Loan

1.70

5.29

-0.33

Emerging markets, we believe, will continue to grow,
but in our view are not likely to be the primary drivers of
global growth as 2014 gets under way. Having said that,
the multi-year underperformance of emerging markets
does open the door to certain investment opportunities. China, for example, is clamping down on corruption
and pollution, as well as slowing its headlong multi-year
investment in fixed assets. As it shifts its economy in the
direction of domestic consumption and the improvement
of its citizens’ quality of life, we think China could offer
interesting opportunities for investors.

-4.56

JPMorgan Developed High Yield

In Japan, we think government policy will continue
to put downward pressure on the yen; consequently,
we think earnings growth will continue to accelerate
among Japanese companies. There is also the potential
upside from Japanese structural reform, which includes
a list of politically challenging items, such as raising the
consumption tax, making changes to employment laws,
forging a transpacific trade pact, and reforming key
domestic industries. Markets are not yet giving credit
for significant progress on these issues, so based on the
extent to which the administration of Prime Minister Abe
delivers on its ambitions, we think markets are likely to
respond positively.

-1.22

COMMODITIES

SP GSCI

Fixed income
U.S. fixed income The fourth quarter of 2013 continued
to be a favorable environment for taking credit risk and
liquidity risk. In addition, strategies oriented toward
prepayment risk — such as investments in interest-only
collateralized mortgage obligations — generally performed
well. The fourth major risk we analyze — interest rates —
offered less attractive investment opportunities, in our
view, particularly against the backdrop of rising rates.

In the years following the 2008 financial crisis,
equity correlations rose to record highs. More recently,
correlations have declined dramatically and stocks are
performing more independently. As share prices deviate
from each other, fundamentals begin to matter more.
This is an environment, we believe, that demands a more
focused, bottom-up approach to portfolio construction.

The U.S. macroeconomic picture continued to show
signs of health, which contributed to a rising rate environment, but also pointed the way toward a more robust
economic recovery in the United States. In particular, the
Federal Reserve’s December decision to modestly reduce
its bond-buying program offered a degree of confirmation
that the economy continues to heal. Bond yields spiked
on the news, with the yield on the benchmark 10-year U.S.
Treasury breaching the 3% level by year-end.

Non-U.S. equity In our view, international stocks
offer broad opportunities to investors at the present time.
Earnings recoveries, restructuring opportunities, and
emerging-market rebound potential are all brightening
the horizon for international stocks.

5
Q1 2014 |  Capital Markets Outlook

As 2014 begins, we are focused on several key policyrelated and macroeconomic risks. First, the Fed is faced
with a delicate balancing act as it seeks to communicate
about further reductions in its bond-buying program
without destabilizing the financial markets or the U.S.
economy. This will bear watching as economic data
emerge in the months ahead. The second risk is the potential for wage inflation. As the unemployment rate moves
downward, we believe wage inflation could develop earlier
than the Fed is anticipating, in which case we could see
the central bank reducing its stimulus efforts much earlier
than the markets are currently forecasting.

isolated credit situations have diverted investor attention
from the overall health of the municipal bond market.
However, we believe that the underlying fundamentals
in the market are quite strong. And while the backdrop in
2014 may create some headwinds, we continue to think
that the attractive tax-free yields of municipal bonds
remain a valuable part of a diversified portfolio for longterm investors seeking income.
In our view, technical factors in the market are the big
wild card. Tax-exempt municipal fund outflows for 2013
topped $60 billion (Source: JPMorgan) — the most in
20 years — and have put downward pressure on prices.
Although we have seen some value-conscious retail and
institutional buyers come into the market to help support
prices, we think it is unlikely that we will see volatility
subside until outflows and rate volatility diminish. The
overall fundamental credit outlook of municipal bonds
appears solid. With regard to tax policy, many issues
remain unresolved, including the debt ceiling and the
potential for broader tax reform — both of which could
affect the value of municipal bonds.

Lastly, it is possible that economic growth in 2014
could be stronger than forecast, particularly during the
second half of the year. If that occurs, real interest rates —
prevailing interest rates minus the rate of inflation — which
have been negative since 2008, could significantly rise.
That said, we don’t believe rates are likely to rise so quickly
that the shift will undermine the markets.
Non-U.S. fixed income In concert with improving
economic data in the United States, Japan’s economy
strongly rebounded through the end of 2013, while core
European economies performed better than we expected.
All told, a supportive global economic backdrop encouraged investors to put capital to work in the credit markets.

Commodities
We continue to have a negative outlook for commodities.
Most of our signals remain unchanged from the beginning
of the previous quarter, with momentum, emergingmarket weakness, and the performance of currencies of
commodity-exporting countries continuing to contribute
to our pessimism. There have been significant outflows
from commodity markets over the course of 2013, and this
remains an unfavorable environment. Geopolitical risk also
remains diminished. While there are increasing tensions
in important oil producers Libya and Iraq right now, we
continue to feel that the potential softening of sanctions in
Iran represents more of a downside risk for oil prices.

By contrast, the rise in U.S. rates led many investors
to move money out of emerging-market sovereign and
corporate debt (EMD), which were perceived to be too
risky relative to “safer” developed-market debt securities offering higher-trending yields. Also, many investors
moved out of emerging-market equities, which put
downward pressure on emerging-market currencies and
amplified the decline in EMD.
Looking forward, we see potential opportunities in
select areas of higher-yielding sovereign debt. While these
positions may be perceived as riskier in terms of credit
risk, they are generally short-term bonds, implying a lower
exposure to the negative effects of rising interest rates.
Assuming the market is not caught up in a risk-aversion
trend that leads to another widespread sell-off of EMD,
we believe this approach to sovereign debt can potentially
provide EMD portfolios with a yield advantage.

Within the asset class, energy has performed stronger
than non-energy commodities and the futures curve is
more supportive. Where we have policy-driven investments
in commodities, we would continue to favor energy-heavy
indices such as the SP/GSCI Index. But where there is no
policy position, we do not favor long positions.
As the year progresses, we will continue to evaluate the
extent to which the global economy has recovered and
potential support from emerging markets. But at least for
the first quarter, we do not believe that these factors will
support commodity markets.

Tax exempt The past quarter, and most of 2013 for that
matter, proved to be a volatile time for municipal bonds,
and market conditions remain less than robust. Uncertainty about interest rates and the headline risk from a few

6
PUTNAM I NVESTM ENTS |  putnam.com

Currency

The Barclays Government Bond Index is an unmanaged index of U.S. Treasury and
government agency bonds.
The Barclays Municipal Bond Index is an unmanaged index of long-term fixed-rate
investment-grade tax-exempt bonds.
The Barclays 10-Year U.S. Treasury Bellwether Index is an unmanaged index of U.S.
Treasury bonds with 10 years’ maturity.
The Barclays U.S. Aggregate Bond Index is an unmanaged index used as a general
measure of U.S. fixed-income securities.
The Barclays U.S. Mortgage-Backed Securities (MBS) Index covers agency
mortgage-backed pass-through securities (both fixed-rate and hybrid ARM) issued by
Ginnie Mae (GNMA), Fannie Mae (FNMA), and Freddie Mac (FHLMC).
The BofA Merrill Lynch U.S. 3-Month Treasury Bill Index consists of U.S. Treasury bills
maturing in 90 days.
The Citigroup Non-U.S. World Government Bond Index is an unmanaged index
generally considered to be representative of the world bond market excluding the
United States.
The Dow Jones Industrial Average Index (DJIA) is an unmanaged index composed
of 30 blue-chip stocks whose one binding similarity is their hugeness — each has sales
per year that exceed $7 bil­­lion. The DJIA has been price-weighted since its inception
on May 26, 1896, reflects large-cap companies representative of U.S. industry, and
historically has moved in tandem with other major market indexes such as the SP 500.
The JPMorgan Developed High Yield Index is an unmanaged index of high-yield
fixed-income securities issued in developed countries.
The JPMorgan Emerging Markets Global Diversified Index is composed of U.S.
dollar-denominated Brady bonds, eurobonds, traded loans, and local market debt
instruments issued by sovereign and quasi-sovereign entities.
JP Morgan Global High Yield Index is an unmanaged index of global high-yield
fixed-income securities.
The MSCI EAFE Index is an unmanaged list of equity securities from Europe and
Australasia, with all values expressed in U.S. dollars.
The MSCI Emerging Markets Index is a free-float-adjusted market-capitalizationweighted index that is designed to measure equity market performance in the global
emerging markets.
The MSCI Europe Index is an unmanaged list of equity securities originating in any of 15
European countries, with all values expressed in U.S. dollars.
The MSCI World Index is an unmanaged list of securities from developed and emerging
markets, with all values expressed in U.S. dollars.
The Nasdaq Composite Index is a widely recognized, market-capitalization-weighted
index that is designed to represent the performance of Nasdaq securities and includes
over 3,000 stocks.
The Russell 1000 Index is an unmanaged index of the 1,000 largest U.S. companies.
The Russell 2000 Index is an unmanaged list of common stocks that is frequently used
as a general performance measure of U.S. stocks of small and/or midsize companies.
Russell 3000 Growth Index is an unmanaged index of those companies in the broadmarket Russell 3000 Index chosen for their growth orientation.
Russell 3000 Value Index is an unmanaged index of those companies in the broadmarket Russell 3000 Index chosen for their value orientation.
The SP GSCI is a composite index of commodity sector returns that represents a
broadly diversified, unleveraged, long-only position in commodity futures.
The SP/LSTA Leveraged Loan Index (LLI) is an unmanaged index of U.S. leveraged
loans.
The SP 500 Index is an unmanaged list of common stocks that is frequently used as a
general measure of U.S. stock market performance.
The Tokyo Stock Exchange Index (TOPIX) is a market-capitalization-weighted index of
over 1,100 stocks traded in the Japanese market.
You cannot invest directly in an index.

We favor the U.S. dollar. Labor market data has been
consistent with the Fed’s intention to taper asset
purchases beginning in January. The Federal Open Market
Committee (FOMC) under Janet Yellen has altered its
forward guidance to be more qualitative to help ensure
that front-end rates remain anchored. However, the front
end is likely to come under pressure as the U.S. economy
continues to outperform and the market begins to challenge the FOMC forward guidance These trends should be
supportive of the U.S. dollar.
We modestly favor the euro as the surprise rate cut
by the European Central Bank (ECB) was not the beginning of a more aggressive policy, but rather a statement
that the council has done enough given its expectations
for growth and inflation. The risk of the euro weakening
remains somewhat limited as the eurozone is set to run a
current account surplus exceeding 2% of GDP this year,
eurozone banks continue to shed and repatriate overseas
assets, and economic data slowly improve.
We have a neutral view of the British pound sterling.
U.K. growth data remain strong and are challenging the
forward guidance as laid out by the Bank of England, but
the pound has been the strongest currency over the past
several months, reflecting this strength. The pound should
be supported over the medium term, but positioning
could be a challenge in the short term.
The Japanese yen remains vulnerable to weakening.
Over the medium term, it is expected that the Bank of
Japan will have to do much more than currently slated
and should provide further impetus for the dollar to rally
versus the yen.
The Fed’s tapering expectations continue to have an
impact on the Australian dollar and other current account
deficit countries that had been supported by safe-haven
fixed-income flows. This should keep the Australian dollar
biased to the downside. We also favor an underweight to
the Canadian dollar. As Canada suffers from a widening in
its current account and balance of payments, the Canadian dollar will likely continue to lose ground against the
U.S. dollar over the medium term.
In emerging markets, the environment has changed
substantially and our views are much more neutral. Those
currencies with weak external balances, such as those
of Indonesia, India, Turkey, and South Africa, remain
vulnerable.

7
NOTES
This material is provided for limited purposes. It is not intended as an offer or solicitation for the purchase or sale of any financial instrument,
or any Putnam product or strategy. References to specific asset classes and financial markets are for illustrative purposes only and are not
intended to be, and should not be interpreted as, recommendations or investment advice. The opinions expressed in this article represent
the current, good-faith views of the author(s) at the time of publication. The views are provided for informational purposes only and
are subject to change. This material does not take into account any investor’s particular investment objectives, strategies, tax status, or
investment horizon. Investors should consult a financial advisor for advice suited to their individual financial needs. Putnam Investments
cannot guarantee the accuracy or completeness of any statements or data contained in the article. Predictions, opinions, and other
information contained in this article are subject to change. Any forward-looking statements speak only as of the date they are made, and
Putnam assumes no duty to update them. Forward-looking statements are subject to numerous assumptions, risks, and uncertainties.
Actual results could differ materially from those anticipated. Past performance is not a guarantee of future results. As with any investment,
there is a potential for profit as well as the possibility of loss.
This presentation or any portion hereof may not be reprinted, sold, or redistributed in whole or in part without the express written consent
of Putnam Investments. The information provided relates to Putnam Investments and its affiliates, which include The Putnam Advisory
Company, LLC and Putnam Investments Limited®.
Prepared for use in Canada by Putnam Investments Inc. [Investissements Putnam Inc.] (o/a Putnam Management in Manitoba). Where
permitted, advisory services are provided in Canada by Putnam Investments Inc. [Investissements Putnam Inc.] (o/a Putnam Management
in Manitoba) and its affiliate, The Putnam Advisory Company, LLC.
Diversification does not assure a profit or protect against loss. It is possible to lose money in a diversified portfolio.

Consider these risks before investing: International investing involves certain risks, such as currency fluctuations,
economic instability, and political developments. Investments in small and/or midsize companies increase the risk of
greater price fluctuations. Bond investments are subject to interest-rate risk, which means the prices of the fund’s bond
investments are likely to fall if interest rates rise. Bond investments also are subject to credit risk, which is the risk that the
issuer of the bond may default on payment of interest or principal. Interest-rate risk is generally greater for longer-term
bonds, and credit risk is generally greater for below-investment-grade bonds, which may be considered speculative.
Unlike bonds, funds that invest in bonds have ongoing fees and expenses. Lower-rated bonds may offer higher yields in
return for more risk. Funds that invest in government securities are not guaranteed. Mortgage-backed securities are subject
to prepayment risk. Commodities involve the risks of changes in market, political, regulatory, and natural conditions.

Scan code or visit putnam.com/outlook
for more insight on the global
investment landscape.

Visit putnam.com for news and information,
and our Perspectives blog for in-depth
analysis on a range of investment topics.

If you are a U.S. retail investor, please request a prospectus, or a summary prospectus if available, from your financial
representative or by calling Putnam at 1-800-225-1581. The prospectus includes investment objectives, risks, fees,
expenses, and other information that you should read and consider carefully before investing.
In the United States, mutual funds are distributed by Putnam Retail Management.

putnam.com CM0100 283557 1/14

More Related Content

What's hot

Putnam Fixed Income Outlook Q1 2013
Putnam Fixed Income Outlook Q1 2013Putnam Fixed Income Outlook Q1 2013
Putnam Fixed Income Outlook Q1 2013Putnam Investments
 
Signs of an impending stock market crash
Signs of an impending stock market crashSigns of an impending stock market crash
Signs of an impending stock market crashSwapnilRege2
 
BlackRock: 2014 Outlook The List - What to Know, What to Do
BlackRock: 2014 Outlook The List - What to Know, What to DoBlackRock: 2014 Outlook The List - What to Know, What to Do
BlackRock: 2014 Outlook The List - What to Know, What to DoEcon Matters
 
A Checklist for Wanna-be Helicopter Pilots
A Checklist for Wanna-be Helicopter PilotsA Checklist for Wanna-be Helicopter Pilots
A Checklist for Wanna-be Helicopter PilotsAndrea Iannelli
 
7 wells fargo 2015 mid-year outlook - turning points
7 wells fargo 2015 mid-year outlook - turning points7 wells fargo 2015 mid-year outlook - turning points
7 wells fargo 2015 mid-year outlook - turning points123jumpad
 
Brent woyat q2 2014 pimg commentary jul2014
Brent woyat q2 2014 pimg commentary jul2014Brent woyat q2 2014 pimg commentary jul2014
Brent woyat q2 2014 pimg commentary jul2014bwoyat
 
Quarterly investment Outlook Q3 2015
Quarterly investment Outlook Q3 2015Quarterly investment Outlook Q3 2015
Quarterly investment Outlook Q3 2015Graeme Cross
 
RSM_The_Real_Economy_Global_ENG_UK.PDF
RSM_The_Real_Economy_Global_ENG_UK.PDFRSM_The_Real_Economy_Global_ENG_UK.PDF
RSM_The_Real_Economy_Global_ENG_UK.PDFDavid Carlisle
 
Fasanara Capital | Investment Outlook | February 1st 2013
Fasanara Capital | Investment Outlook | February 1st 2013Fasanara Capital | Investment Outlook | February 1st 2013
Fasanara Capital | Investment Outlook | February 1st 2013Fasanara Capital ltd
 
2013.10.10 accuvest bpv-q4
2013.10.10 accuvest bpv-q42013.10.10 accuvest bpv-q4
2013.10.10 accuvest bpv-q4advisorshares
 
To the Point, November 26 2009
To the Point, November 26 2009To the Point, November 26 2009
To the Point, November 26 2009Swedbank
 
2013’s Top 10 Lessons for Investors from LPL Financial Research
2013’s Top 10 Lessons for Investors from LPL Financial Research2013’s Top 10 Lessons for Investors from LPL Financial Research
2013’s Top 10 Lessons for Investors from LPL Financial ResearchJP Marketing | NE
 
LPL Market Insight 1Q14: Stocks Cool Off as U.S. Economy Weathers Deep Freeze
LPL Market Insight 1Q14: Stocks Cool Off as U.S. Economy Weathers Deep FreezeLPL Market Insight 1Q14: Stocks Cool Off as U.S. Economy Weathers Deep Freeze
LPL Market Insight 1Q14: Stocks Cool Off as U.S. Economy Weathers Deep FreezeMarc Freedman CFP® at Freedman Financial
 
Investor Compass - Portfolio Manager Viewpoints
Investor Compass - Portfolio Manager ViewpointsInvestor Compass - Portfolio Manager Viewpoints
Investor Compass - Portfolio Manager Viewpointsadvisorshares
 
FI Insights V17I1 Print Version
FI Insights V17I1 Print VersionFI Insights V17I1 Print Version
FI Insights V17I1 Print VersionDean Miller
 
Finlight Research - Market Perspectives - Sep 2015
Finlight Research - Market Perspectives - Sep 2015Finlight Research - Market Perspectives - Sep 2015
Finlight Research - Market Perspectives - Sep 2015FinLight Research
 
Finlight Research - Market Perspectives - Aug 2015
Finlight Research - Market Perspectives - Aug 2015Finlight Research - Market Perspectives - Aug 2015
Finlight Research - Market Perspectives - Aug 2015FinLight Research
 
Global market perspective q3-2013
Global market perspective q3-2013Global market perspective q3-2013
Global market perspective q3-2013World Office Forum
 
OFIP Q3 2010 - A Case For Optimism
OFIP Q3 2010 - A Case For OptimismOFIP Q3 2010 - A Case For Optimism
OFIP Q3 2010 - A Case For Optimismbwoyat
 

What's hot (20)

Putnam Fixed Income Outlook Q1 2013
Putnam Fixed Income Outlook Q1 2013Putnam Fixed Income Outlook Q1 2013
Putnam Fixed Income Outlook Q1 2013
 
Signs of an impending stock market crash
Signs of an impending stock market crashSigns of an impending stock market crash
Signs of an impending stock market crash
 
BlackRock: 2014 Outlook The List - What to Know, What to Do
BlackRock: 2014 Outlook The List - What to Know, What to DoBlackRock: 2014 Outlook The List - What to Know, What to Do
BlackRock: 2014 Outlook The List - What to Know, What to Do
 
A Checklist for Wanna-be Helicopter Pilots
A Checklist for Wanna-be Helicopter PilotsA Checklist for Wanna-be Helicopter Pilots
A Checklist for Wanna-be Helicopter Pilots
 
7 wells fargo 2015 mid-year outlook - turning points
7 wells fargo 2015 mid-year outlook - turning points7 wells fargo 2015 mid-year outlook - turning points
7 wells fargo 2015 mid-year outlook - turning points
 
Brent woyat q2 2014 pimg commentary jul2014
Brent woyat q2 2014 pimg commentary jul2014Brent woyat q2 2014 pimg commentary jul2014
Brent woyat q2 2014 pimg commentary jul2014
 
Quarterly investment Outlook Q3 2015
Quarterly investment Outlook Q3 2015Quarterly investment Outlook Q3 2015
Quarterly investment Outlook Q3 2015
 
RSM_The_Real_Economy_Global_ENG_UK.PDF
RSM_The_Real_Economy_Global_ENG_UK.PDFRSM_The_Real_Economy_Global_ENG_UK.PDF
RSM_The_Real_Economy_Global_ENG_UK.PDF
 
Fasanara Capital | Investment Outlook | February 1st 2013
Fasanara Capital | Investment Outlook | February 1st 2013Fasanara Capital | Investment Outlook | February 1st 2013
Fasanara Capital | Investment Outlook | February 1st 2013
 
2013.10.10 accuvest bpv-q4
2013.10.10 accuvest bpv-q42013.10.10 accuvest bpv-q4
2013.10.10 accuvest bpv-q4
 
To the Point, November 26 2009
To the Point, November 26 2009To the Point, November 26 2009
To the Point, November 26 2009
 
2013’s Top 10 Lessons for Investors from LPL Financial Research
2013’s Top 10 Lessons for Investors from LPL Financial Research2013’s Top 10 Lessons for Investors from LPL Financial Research
2013’s Top 10 Lessons for Investors from LPL Financial Research
 
LPL Market Insight 1Q14: Stocks Cool Off as U.S. Economy Weathers Deep Freeze
LPL Market Insight 1Q14: Stocks Cool Off as U.S. Economy Weathers Deep FreezeLPL Market Insight 1Q14: Stocks Cool Off as U.S. Economy Weathers Deep Freeze
LPL Market Insight 1Q14: Stocks Cool Off as U.S. Economy Weathers Deep Freeze
 
Investor Compass - Portfolio Manager Viewpoints
Investor Compass - Portfolio Manager ViewpointsInvestor Compass - Portfolio Manager Viewpoints
Investor Compass - Portfolio Manager Viewpoints
 
2013 Mid Year Outlook
2013 Mid Year Outlook2013 Mid Year Outlook
2013 Mid Year Outlook
 
FI Insights V17I1 Print Version
FI Insights V17I1 Print VersionFI Insights V17I1 Print Version
FI Insights V17I1 Print Version
 
Finlight Research - Market Perspectives - Sep 2015
Finlight Research - Market Perspectives - Sep 2015Finlight Research - Market Perspectives - Sep 2015
Finlight Research - Market Perspectives - Sep 2015
 
Finlight Research - Market Perspectives - Aug 2015
Finlight Research - Market Perspectives - Aug 2015Finlight Research - Market Perspectives - Aug 2015
Finlight Research - Market Perspectives - Aug 2015
 
Global market perspective q3-2013
Global market perspective q3-2013Global market perspective q3-2013
Global market perspective q3-2013
 
OFIP Q3 2010 - A Case For Optimism
OFIP Q3 2010 - A Case For OptimismOFIP Q3 2010 - A Case For Optimism
OFIP Q3 2010 - A Case For Optimism
 

Similar to Putnam Perspectives: Capital Market Outlook Q1 2014

BMO-TCH-Mid-Q3-Update_FINAL
BMO-TCH-Mid-Q3-Update_FINALBMO-TCH-Mid-Q3-Update_FINAL
BMO-TCH-Mid-Q3-Update_FINALAdam Phillips
 
2 william blair global market outlook - december 2013
2 william blair global market outlook - december 20132 william blair global market outlook - december 2013
2 william blair global market outlook - december 2013123jumpad
 
WHV '11AR_Final_PressQuality_Crop&Bleed
WHV '11AR_Final_PressQuality_Crop&BleedWHV '11AR_Final_PressQuality_Crop&Bleed
WHV '11AR_Final_PressQuality_Crop&BleedTlielaxu Miykel
 
Orbit barometer report october 2010
Orbit barometer report october 2010Orbit barometer report october 2010
Orbit barometer report october 2010Frédéric Goblet
 
2010 LPL Financial Outlook
2010 LPL Financial Outlook2010 LPL Financial Outlook
2010 LPL Financial Outlookguestc5af6ef
 
2015 Investment Strategy Report
2015 Investment Strategy Report2015 Investment Strategy Report
2015 Investment Strategy ReportStephen Walker
 
Rules of Thumb for a Volatile Market
Rules of Thumb for a Volatile MarketRules of Thumb for a Volatile Market
Rules of Thumb for a Volatile MarketMarqus J Freeman
 
Putnam Global Income Trust Q&A Q2 2013
Putnam Global Income Trust Q&A Q2 2013Putnam Global Income Trust Q&A Q2 2013
Putnam Global Income Trust Q&A Q2 2013Putnam Investments
 
All Eyes on Asset Quality: Microfinance Global Valuation Survey 2010
 All Eyes on Asset Quality: Microfinance Global Valuation Survey 2010 All Eyes on Asset Quality: Microfinance Global Valuation Survey 2010
All Eyes on Asset Quality: Microfinance Global Valuation Survey 2010Dr Lendy Spires
 
All Eyes on Asset Quality Microfinance Global Valuation Survey 2010
All Eyes on Asset Quality Microfinance Global Valuation Survey 2010All Eyes on Asset Quality Microfinance Global Valuation Survey 2010
All Eyes on Asset Quality Microfinance Global Valuation Survey 2010Dr Lendy Spires
 
Cgap occasional-paper-all-eyes-on-asset-quality-microfinance-global-valuation...
Cgap occasional-paper-all-eyes-on-asset-quality-microfinance-global-valuation...Cgap occasional-paper-all-eyes-on-asset-quality-microfinance-global-valuation...
Cgap occasional-paper-all-eyes-on-asset-quality-microfinance-global-valuation...Dr Lendy Spires
 
2010 Lpl Outlook
2010 Lpl Outlook2010 Lpl Outlook
2010 Lpl Outlooktmardin
 
Dealing With Divergences - Blackrock 2015 Outlook
Dealing With Divergences - Blackrock 2015 OutlookDealing With Divergences - Blackrock 2015 Outlook
Dealing With Divergences - Blackrock 2015 OutlookJoão Pinto
 
Investors Lament
Investors LamentInvestors Lament
Investors Lamentpopeni
 
Investors Lament
Investors LamentInvestors Lament
Investors Lamentkvezino
 
Investors Lament
Investors LamentInvestors Lament
Investors LamentRlevinsohn
 
Linear note 4 securities
Linear note 4  securitiesLinear note 4  securities
Linear note 4 securitiesDr Marcus Bent
 
Sprung investment management commentary 1st quarter, 2015
Sprung investment management commentary   1st quarter, 2015Sprung investment management commentary   1st quarter, 2015
Sprung investment management commentary 1st quarter, 2015Robert Champion
 

Similar to Putnam Perspectives: Capital Market Outlook Q1 2014 (20)

2016 ETF and investment outlook
2016 ETF and investment outlook2016 ETF and investment outlook
2016 ETF and investment outlook
 
BMO-TCH-Mid-Q3-Update_FINAL
BMO-TCH-Mid-Q3-Update_FINALBMO-TCH-Mid-Q3-Update_FINAL
BMO-TCH-Mid-Q3-Update_FINAL
 
2 william blair global market outlook - december 2013
2 william blair global market outlook - december 20132 william blair global market outlook - december 2013
2 william blair global market outlook - december 2013
 
WHV '11AR_Final_PressQuality_Crop&Bleed
WHV '11AR_Final_PressQuality_Crop&BleedWHV '11AR_Final_PressQuality_Crop&Bleed
WHV '11AR_Final_PressQuality_Crop&Bleed
 
Orbit barometer report october 2010
Orbit barometer report october 2010Orbit barometer report october 2010
Orbit barometer report october 2010
 
2010 LPL Financial Outlook
2010 LPL Financial Outlook2010 LPL Financial Outlook
2010 LPL Financial Outlook
 
2015 Investment Strategy Report
2015 Investment Strategy Report2015 Investment Strategy Report
2015 Investment Strategy Report
 
Rules of Thumb for a Volatile Market
Rules of Thumb for a Volatile MarketRules of Thumb for a Volatile Market
Rules of Thumb for a Volatile Market
 
Putnam Global Income Trust Q&A Q2 2013
Putnam Global Income Trust Q&A Q2 2013Putnam Global Income Trust Q&A Q2 2013
Putnam Global Income Trust Q&A Q2 2013
 
All Eyes on Asset Quality: Microfinance Global Valuation Survey 2010
 All Eyes on Asset Quality: Microfinance Global Valuation Survey 2010 All Eyes on Asset Quality: Microfinance Global Valuation Survey 2010
All Eyes on Asset Quality: Microfinance Global Valuation Survey 2010
 
All Eyes on Asset Quality Microfinance Global Valuation Survey 2010
All Eyes on Asset Quality Microfinance Global Valuation Survey 2010All Eyes on Asset Quality Microfinance Global Valuation Survey 2010
All Eyes on Asset Quality Microfinance Global Valuation Survey 2010
 
Cgap occasional-paper-all-eyes-on-asset-quality-microfinance-global-valuation...
Cgap occasional-paper-all-eyes-on-asset-quality-microfinance-global-valuation...Cgap occasional-paper-all-eyes-on-asset-quality-microfinance-global-valuation...
Cgap occasional-paper-all-eyes-on-asset-quality-microfinance-global-valuation...
 
2010 Lpl Outlook
2010 Lpl Outlook2010 Lpl Outlook
2010 Lpl Outlook
 
Dealing With Divergences - Blackrock 2015 Outlook
Dealing With Divergences - Blackrock 2015 OutlookDealing With Divergences - Blackrock 2015 Outlook
Dealing With Divergences - Blackrock 2015 Outlook
 
Investors Lament
Investors LamentInvestors Lament
Investors Lament
 
Investors Lament
Investors LamentInvestors Lament
Investors Lament
 
Investors Lament
Investors LamentInvestors Lament
Investors Lament
 
Linear note 4 securities
Linear note 4  securitiesLinear note 4  securities
Linear note 4 securities
 
marketview-_7-12
marketview-_7-12marketview-_7-12
marketview-_7-12
 
Sprung investment management commentary 1st quarter, 2015
Sprung investment management commentary   1st quarter, 2015Sprung investment management commentary   1st quarter, 2015
Sprung investment management commentary 1st quarter, 2015
 

More from Putnam Investments

Putnam Investment's 2015 Financial Advisors and Social Media Survey
Putnam Investment's 2015 Financial Advisors and Social Media SurveyPutnam Investment's 2015 Financial Advisors and Social Media Survey
Putnam Investment's 2015 Financial Advisors and Social Media SurveyPutnam Investments
 
Putnam Social Media Survey 2014
Putnam Social Media Survey 2014Putnam Social Media Survey 2014
Putnam Social Media Survey 2014Putnam Investments
 
Putnam Lifetime Income Survey 2013
Putnam Lifetime Income Survey 2013Putnam Lifetime Income Survey 2013
Putnam Lifetime Income Survey 2013Putnam Investments
 
Putnam Fixed Income Outlook Q4 2013
Putnam Fixed Income Outlook Q4 2013Putnam Fixed Income Outlook Q4 2013
Putnam Fixed Income Outlook Q4 2013Putnam Investments
 
Fostering innovation to improve retirement security
Fostering innovation to improve retirement securityFostering innovation to improve retirement security
Fostering innovation to improve retirement securityPutnam Investments
 
Putnam municipal bond funds Q&A Q2 2013
Putnam municipal bond funds Q&A Q2 2013Putnam municipal bond funds Q&A Q2 2013
Putnam municipal bond funds Q&A Q2 2013Putnam Investments
 
Putnam Equity Income Fund Q&A Q2 2013
Putnam Equity Income Fund Q&A Q2 2013Putnam Equity Income Fund Q&A Q2 2013
Putnam Equity Income Fund Q&A Q2 2013Putnam Investments
 
Putnam Income Fund Q&A Q2 2013
Putnam Income Fund Q&A Q2 2013Putnam Income Fund Q&A Q2 2013
Putnam Income Fund Q&A Q2 2013Putnam Investments
 
Putnam Dynamic Risk Allocation Fund Q&A Q2 2013
Putnam Dynamic Risk Allocation Fund Q&A Q2 2013Putnam Dynamic Risk Allocation Fund Q&A Q2 2013
Putnam Dynamic Risk Allocation Fund Q&A Q2 2013Putnam Investments
 
Putnam Absolute Return Funds Q&A Q2 2013
Putnam Absolute Return Funds Q&A Q2 2013Putnam Absolute Return Funds Q&A Q2 2013
Putnam Absolute Return Funds Q&A Q2 2013Putnam Investments
 
Robert L. Reynolds: New thinking, new solutions
Robert L. Reynolds: New thinking, new solutionsRobert L. Reynolds: New thinking, new solutions
Robert L. Reynolds: New thinking, new solutionsPutnam Investments
 
Putnam Lifetime Income Scores III
Putnam Lifetime Income Scores IIIPutnam Lifetime Income Scores III
Putnam Lifetime Income Scores IIIPutnam Investments
 
Taxes after the fiscal cliff: Planning opportunities in 2013
Taxes after the fiscal cliff: Planning opportunities in 2013Taxes after the fiscal cliff: Planning opportunities in 2013
Taxes after the fiscal cliff: Planning opportunities in 2013Putnam Investments
 
Putnam Investments: You can take it with you
Putnam Investments: You can take it with youPutnam Investments: You can take it with you
Putnam Investments: You can take it with youPutnam Investments
 
Putnam Investments: Pathway to Independence
Putnam Investments: Pathway to IndependencePutnam Investments: Pathway to Independence
Putnam Investments: Pathway to IndependencePutnam Investments
 
Putnam Investments: Making your nest egg last
Putnam Investments: Making your nest egg lastPutnam Investments: Making your nest egg last
Putnam Investments: Making your nest egg lastPutnam Investments
 

More from Putnam Investments (20)

The Parquet by the numbers
The Parquet by the numbersThe Parquet by the numbers
The Parquet by the numbers
 
Putnam Investment's 2015 Financial Advisors and Social Media Survey
Putnam Investment's 2015 Financial Advisors and Social Media SurveyPutnam Investment's 2015 Financial Advisors and Social Media Survey
Putnam Investment's 2015 Financial Advisors and Social Media Survey
 
Putnam Social Media Survey 2014
Putnam Social Media Survey 2014Putnam Social Media Survey 2014
Putnam Social Media Survey 2014
 
Who is the social advisor?
Who is the social advisor?Who is the social advisor?
Who is the social advisor?
 
Putnam Lifetime Income Survey 2013
Putnam Lifetime Income Survey 2013Putnam Lifetime Income Survey 2013
Putnam Lifetime Income Survey 2013
 
Putnam Fixed Income Outlook Q4 2013
Putnam Fixed Income Outlook Q4 2013Putnam Fixed Income Outlook Q4 2013
Putnam Fixed Income Outlook Q4 2013
 
Putnam Social Media Survey
Putnam Social Media SurveyPutnam Social Media Survey
Putnam Social Media Survey
 
Fostering innovation to improve retirement security
Fostering innovation to improve retirement securityFostering innovation to improve retirement security
Fostering innovation to improve retirement security
 
Putnam municipal bond funds Q&A Q2 2013
Putnam municipal bond funds Q&A Q2 2013Putnam municipal bond funds Q&A Q2 2013
Putnam municipal bond funds Q&A Q2 2013
 
Putnam Equity Income Fund Q&A Q2 2013
Putnam Equity Income Fund Q&A Q2 2013Putnam Equity Income Fund Q&A Q2 2013
Putnam Equity Income Fund Q&A Q2 2013
 
Putnam Income Fund Q&A Q2 2013
Putnam Income Fund Q&A Q2 2013Putnam Income Fund Q&A Q2 2013
Putnam Income Fund Q&A Q2 2013
 
Putnam Dynamic Risk Allocation Fund Q&A Q2 2013
Putnam Dynamic Risk Allocation Fund Q&A Q2 2013Putnam Dynamic Risk Allocation Fund Q&A Q2 2013
Putnam Dynamic Risk Allocation Fund Q&A Q2 2013
 
Putnam Absolute Return Funds Q&A Q2 2013
Putnam Absolute Return Funds Q&A Q2 2013Putnam Absolute Return Funds Q&A Q2 2013
Putnam Absolute Return Funds Q&A Q2 2013
 
Robert L. Reynolds: New thinking, new solutions
Robert L. Reynolds: New thinking, new solutionsRobert L. Reynolds: New thinking, new solutions
Robert L. Reynolds: New thinking, new solutions
 
Putnam Lifetime Income Scores III
Putnam Lifetime Income Scores IIIPutnam Lifetime Income Scores III
Putnam Lifetime Income Scores III
 
New Thinking, New Solutions
New Thinking, New Solutions New Thinking, New Solutions
New Thinking, New Solutions
 
Taxes after the fiscal cliff: Planning opportunities in 2013
Taxes after the fiscal cliff: Planning opportunities in 2013Taxes after the fiscal cliff: Planning opportunities in 2013
Taxes after the fiscal cliff: Planning opportunities in 2013
 
Putnam Investments: You can take it with you
Putnam Investments: You can take it with youPutnam Investments: You can take it with you
Putnam Investments: You can take it with you
 
Putnam Investments: Pathway to Independence
Putnam Investments: Pathway to IndependencePutnam Investments: Pathway to Independence
Putnam Investments: Pathway to Independence
 
Putnam Investments: Making your nest egg last
Putnam Investments: Making your nest egg lastPutnam Investments: Making your nest egg last
Putnam Investments: Making your nest egg last
 

Recently uploaded

Call Girls Near Delhi Pride Hotel, New Delhi|9873777170
Call Girls Near Delhi Pride Hotel, New Delhi|9873777170Call Girls Near Delhi Pride Hotel, New Delhi|9873777170
Call Girls Near Delhi Pride Hotel, New Delhi|9873777170Sonam Pathan
 
magnetic-pensions-a-new-blueprint-for-the-dc-landscape.pdf
magnetic-pensions-a-new-blueprint-for-the-dc-landscape.pdfmagnetic-pensions-a-new-blueprint-for-the-dc-landscape.pdf
magnetic-pensions-a-new-blueprint-for-the-dc-landscape.pdfHenry Tapper
 
BPPG response - Options for Defined Benefit schemes - 19Apr24.pdf
BPPG response - Options for Defined Benefit schemes - 19Apr24.pdfBPPG response - Options for Defined Benefit schemes - 19Apr24.pdf
BPPG response - Options for Defined Benefit schemes - 19Apr24.pdfHenry Tapper
 
Tenets of Physiocracy History of Economic
Tenets of Physiocracy History of EconomicTenets of Physiocracy History of Economic
Tenets of Physiocracy History of Economiccinemoviesu
 
Stock Market Brief Deck for 4/24/24 .pdf
Stock Market Brief Deck for 4/24/24 .pdfStock Market Brief Deck for 4/24/24 .pdf
Stock Market Brief Deck for 4/24/24 .pdfMichael Silva
 
SBP-Market-Operations and market managment
SBP-Market-Operations and market managmentSBP-Market-Operations and market managment
SBP-Market-Operations and market managmentfactical
 
Mulki Call Girls 7001305949 WhatsApp Number 24x7 Best Services
Mulki Call Girls 7001305949 WhatsApp Number 24x7 Best ServicesMulki Call Girls 7001305949 WhatsApp Number 24x7 Best Services
Mulki Call Girls 7001305949 WhatsApp Number 24x7 Best Servicesnajka9823
 
原版1:1复刻温哥华岛大学毕业证Vancouver毕业证留信学历认证
原版1:1复刻温哥华岛大学毕业证Vancouver毕业证留信学历认证原版1:1复刻温哥华岛大学毕业证Vancouver毕业证留信学历认证
原版1:1复刻温哥华岛大学毕业证Vancouver毕业证留信学历认证rjrjkk
 
Chapter 2.ppt of macroeconomics by mankiw 9th edition
Chapter 2.ppt of macroeconomics by mankiw 9th editionChapter 2.ppt of macroeconomics by mankiw 9th edition
Chapter 2.ppt of macroeconomics by mankiw 9th editionMuhammadHusnain82237
 
Vp Girls near me Delhi Call Now or WhatsApp
Vp Girls near me Delhi Call Now or WhatsAppVp Girls near me Delhi Call Now or WhatsApp
Vp Girls near me Delhi Call Now or WhatsAppmiss dipika
 
NO1 WorldWide Genuine vashikaran specialist Vashikaran baba near Lahore Vashi...
NO1 WorldWide Genuine vashikaran specialist Vashikaran baba near Lahore Vashi...NO1 WorldWide Genuine vashikaran specialist Vashikaran baba near Lahore Vashi...
NO1 WorldWide Genuine vashikaran specialist Vashikaran baba near Lahore Vashi...Amil baba
 
Call Girls Near Me WhatsApp:+91-9833363713
Call Girls Near Me WhatsApp:+91-9833363713Call Girls Near Me WhatsApp:+91-9833363713
Call Girls Near Me WhatsApp:+91-9833363713Sonam Pathan
 
How Automation is Driving Efficiency Through the Last Mile of Reporting
How Automation is Driving Efficiency Through the Last Mile of ReportingHow Automation is Driving Efficiency Through the Last Mile of Reporting
How Automation is Driving Efficiency Through the Last Mile of ReportingAggregage
 
Bladex 1Q24 Earning Results Presentation
Bladex 1Q24 Earning Results PresentationBladex 1Q24 Earning Results Presentation
Bladex 1Q24 Earning Results PresentationBladex
 
NO1 WorldWide Love marriage specialist baba ji Amil Baba Kala ilam powerful v...
NO1 WorldWide Love marriage specialist baba ji Amil Baba Kala ilam powerful v...NO1 WorldWide Love marriage specialist baba ji Amil Baba Kala ilam powerful v...
NO1 WorldWide Love marriage specialist baba ji Amil Baba Kala ilam powerful v...Amil baba
 
Unveiling the Top Chartered Accountants in India and Their Staggering Net Worth
Unveiling the Top Chartered Accountants in India and Their Staggering Net WorthUnveiling the Top Chartered Accountants in India and Their Staggering Net Worth
Unveiling the Top Chartered Accountants in India and Their Staggering Net WorthShaheen Kumar
 
fca-bsps-decision-letter-redacted (1).pdf
fca-bsps-decision-letter-redacted (1).pdffca-bsps-decision-letter-redacted (1).pdf
fca-bsps-decision-letter-redacted (1).pdfHenry Tapper
 
Monthly Market Risk Update: April 2024 [SlideShare]
Monthly Market Risk Update: April 2024 [SlideShare]Monthly Market Risk Update: April 2024 [SlideShare]
Monthly Market Risk Update: April 2024 [SlideShare]Commonwealth
 
Financial Leverage Definition, Advantages, and Disadvantages
Financial Leverage Definition, Advantages, and DisadvantagesFinancial Leverage Definition, Advantages, and Disadvantages
Financial Leverage Definition, Advantages, and Disadvantagesjayjaymabutot13
 
(办理学位证)加拿大萨省大学毕业证成绩单原版一比一
(办理学位证)加拿大萨省大学毕业证成绩单原版一比一(办理学位证)加拿大萨省大学毕业证成绩单原版一比一
(办理学位证)加拿大萨省大学毕业证成绩单原版一比一S SDS
 

Recently uploaded (20)

Call Girls Near Delhi Pride Hotel, New Delhi|9873777170
Call Girls Near Delhi Pride Hotel, New Delhi|9873777170Call Girls Near Delhi Pride Hotel, New Delhi|9873777170
Call Girls Near Delhi Pride Hotel, New Delhi|9873777170
 
magnetic-pensions-a-new-blueprint-for-the-dc-landscape.pdf
magnetic-pensions-a-new-blueprint-for-the-dc-landscape.pdfmagnetic-pensions-a-new-blueprint-for-the-dc-landscape.pdf
magnetic-pensions-a-new-blueprint-for-the-dc-landscape.pdf
 
BPPG response - Options for Defined Benefit schemes - 19Apr24.pdf
BPPG response - Options for Defined Benefit schemes - 19Apr24.pdfBPPG response - Options for Defined Benefit schemes - 19Apr24.pdf
BPPG response - Options for Defined Benefit schemes - 19Apr24.pdf
 
Tenets of Physiocracy History of Economic
Tenets of Physiocracy History of EconomicTenets of Physiocracy History of Economic
Tenets of Physiocracy History of Economic
 
Stock Market Brief Deck for 4/24/24 .pdf
Stock Market Brief Deck for 4/24/24 .pdfStock Market Brief Deck for 4/24/24 .pdf
Stock Market Brief Deck for 4/24/24 .pdf
 
SBP-Market-Operations and market managment
SBP-Market-Operations and market managmentSBP-Market-Operations and market managment
SBP-Market-Operations and market managment
 
Mulki Call Girls 7001305949 WhatsApp Number 24x7 Best Services
Mulki Call Girls 7001305949 WhatsApp Number 24x7 Best ServicesMulki Call Girls 7001305949 WhatsApp Number 24x7 Best Services
Mulki Call Girls 7001305949 WhatsApp Number 24x7 Best Services
 
原版1:1复刻温哥华岛大学毕业证Vancouver毕业证留信学历认证
原版1:1复刻温哥华岛大学毕业证Vancouver毕业证留信学历认证原版1:1复刻温哥华岛大学毕业证Vancouver毕业证留信学历认证
原版1:1复刻温哥华岛大学毕业证Vancouver毕业证留信学历认证
 
Chapter 2.ppt of macroeconomics by mankiw 9th edition
Chapter 2.ppt of macroeconomics by mankiw 9th editionChapter 2.ppt of macroeconomics by mankiw 9th edition
Chapter 2.ppt of macroeconomics by mankiw 9th edition
 
Vp Girls near me Delhi Call Now or WhatsApp
Vp Girls near me Delhi Call Now or WhatsAppVp Girls near me Delhi Call Now or WhatsApp
Vp Girls near me Delhi Call Now or WhatsApp
 
NO1 WorldWide Genuine vashikaran specialist Vashikaran baba near Lahore Vashi...
NO1 WorldWide Genuine vashikaran specialist Vashikaran baba near Lahore Vashi...NO1 WorldWide Genuine vashikaran specialist Vashikaran baba near Lahore Vashi...
NO1 WorldWide Genuine vashikaran specialist Vashikaran baba near Lahore Vashi...
 
Call Girls Near Me WhatsApp:+91-9833363713
Call Girls Near Me WhatsApp:+91-9833363713Call Girls Near Me WhatsApp:+91-9833363713
Call Girls Near Me WhatsApp:+91-9833363713
 
How Automation is Driving Efficiency Through the Last Mile of Reporting
How Automation is Driving Efficiency Through the Last Mile of ReportingHow Automation is Driving Efficiency Through the Last Mile of Reporting
How Automation is Driving Efficiency Through the Last Mile of Reporting
 
Bladex 1Q24 Earning Results Presentation
Bladex 1Q24 Earning Results PresentationBladex 1Q24 Earning Results Presentation
Bladex 1Q24 Earning Results Presentation
 
NO1 WorldWide Love marriage specialist baba ji Amil Baba Kala ilam powerful v...
NO1 WorldWide Love marriage specialist baba ji Amil Baba Kala ilam powerful v...NO1 WorldWide Love marriage specialist baba ji Amil Baba Kala ilam powerful v...
NO1 WorldWide Love marriage specialist baba ji Amil Baba Kala ilam powerful v...
 
Unveiling the Top Chartered Accountants in India and Their Staggering Net Worth
Unveiling the Top Chartered Accountants in India and Their Staggering Net WorthUnveiling the Top Chartered Accountants in India and Their Staggering Net Worth
Unveiling the Top Chartered Accountants in India and Their Staggering Net Worth
 
fca-bsps-decision-letter-redacted (1).pdf
fca-bsps-decision-letter-redacted (1).pdffca-bsps-decision-letter-redacted (1).pdf
fca-bsps-decision-letter-redacted (1).pdf
 
Monthly Market Risk Update: April 2024 [SlideShare]
Monthly Market Risk Update: April 2024 [SlideShare]Monthly Market Risk Update: April 2024 [SlideShare]
Monthly Market Risk Update: April 2024 [SlideShare]
 
Financial Leverage Definition, Advantages, and Disadvantages
Financial Leverage Definition, Advantages, and DisadvantagesFinancial Leverage Definition, Advantages, and Disadvantages
Financial Leverage Definition, Advantages, and Disadvantages
 
(办理学位证)加拿大萨省大学毕业证成绩单原版一比一
(办理学位证)加拿大萨省大学毕业证成绩单原版一比一(办理学位证)加拿大萨省大学毕业证成绩单原版一比一
(办理学位证)加拿大萨省大学毕业证成绩单原版一比一
 

Putnam Perspectives: Capital Market Outlook Q1 2014

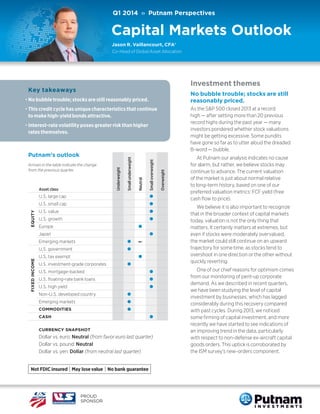
  • 1. Q1 2014 » Putnam Perspectives Capital Markets Outlook Jason R. Vaillancourt, CFA® Co-Head of Global Asset Allocation Investment themes Key takeaways No bubble trouble; stocks are still reasonably priced. • No bubble trouble; stocks are still reasonably priced. As the S&P 500 closed 2013 at a record high — after setting more than 20 previous record highs during the past year — many investors pondered whether stock valuations might be getting excessive. Some pundits have gone so far as to utter aloud the dreaded B-word — bubble. • This credit cycle has unique characteristics that continue to make high-yield bonds attractive. l U.S. small cap EQUITY U.S. large cap l U.S. value l U.S. growth l Europe l Japan l l U.S. government FIXED INCOME Emerging markets l U.S. tax exempt l U.S. investment-grade corporates l U.S. mortgage-backed l U.S. floating-rate bank loans l U.S. high yield l Non-U.S. developed country l Emerging markets l COMMODITIES l CASH l CURRENCY SNAPSHOT Dollar vs. euro: Neutral (from favor euro last quarter) Dollar vs. pound: Neutral Dollar vs. yen: Dollar (from neutral last quarter) PROUD SPONSOR Overweight Small overweight Asset class Neutral Arrows in the table indicate the change from the previous quarter. Underweight Putnam’s outlook Small underweight • Interest-rate volatility poses greater risk than higher rates themselves. At Putnam our analysis indicates no cause for alarm, but rather, we believe stocks may continue to advance. The current valuation of the market is just about normal relative to long-term history, based on one of our preferred valuation metrics: FCF yield (free cash flow to price). We believe it is also important to recognize that in the broader context of capital markets today, valuation is not the only thing that matters. It certainly matters at extremes, but even if stocks were moderately overvalued, the market could still continue on an upward trajectory for some time, as stocks tend to overshoot in one direction or the other without quickly reverting. One of our chief reasons for optimism comes from our monitoring of pent-up corporate demand. As we described in recent quarters, we have been studying the level of capital investment by businesses, which has lagged considerably during this recovery compared with past cycles. During 2013, we noticed some firming of capital investment, and more recently we have started to see indications of an improving trend in the data, particularly with respect to non-defense ex-aircraft capital goods orders. This uptick is corroborated by the ISM survey’s new-orders component.
  • 2. Q1 2014 |  Capital Markets Outlook Figure 1. Stock valuations are near the average of the past quarter century. The current valuation of the market is just about normal relative to long-term history. — Free cash flow yield  — Average yield 1990–2013 12% 8 4 0 1/31/90 1995 2000 2005 2010 It appears businesses have finally gained adequate confidence to sustain an increase in spending, which can help GDP growth accelerate. The situation is similar in other developed markets, particularly in Europe and Japan, and we believe both regions have the capacity to help drive global growth. 12/31/13 Source: Bloomberg. The graph shows valuations of stocks in the SP 500 as measured by their free cash flow yield. This is the amount of a company’s operating cash flow minus the amount of its capital expenditures, divided by its stock’s price. In Japan, the question continues to be the need for material progress on Prime Minister Shinzō Abe’s “Third Arrow” policies targeting structural reform. One of these policies, a large sales tax increase, will take effect in April and threatens to be a new drag on growth. However, we continue to hold out hope for many of Abe’s structural reforms to start to take shape in 2014. We are closely monitoring the multilateral talks surrounding the Trans-Pacific Partnership free trade agreement, which is a key barometer of Abe’s ability to accomplish his policy agenda. Abe was elected on a platform of returning Japan to regional prominence, as a counterbalance to China, and internal economic policy is one part of this larger political project. At the same time, we recognize that policy change follows different timelines in Japan than in the United States, and a temporary setback for Abe might not be definitive. While we have a constructive outlook for Europe and Japan, neither one is free of risks. In Europe, the underlying causes of poor credit conditions remain a major question and still require greater clarity before we favor an overweight to the region. Europe is recovering, but the pace is anemic. Signs of insufficient credit demand mean that we cannot yet assign this sluggish pace solely to a lack of credit availability in the private sector. It could also be caused by a tepid pace of new business creation and innovation. Remember that the United States showed similar ambiguity in the early days of the recovery starting in mid 2009. Ultimately, credit availability improved once sufficient evidence emerged that demand was growing. We are now looking for similar evidence for Europe. Our analysis is taking into account one of the important differences between Europe and the United States: European credit flows through banks, while U.S. credit flows primarily through capital markets. Outside of developed-market economies, the marginal tightening (or in Fed-speak, “less accommodation”) of U.S. monetary policy as the Fed begins reducing its purchases of bonds in January will likely weigh on growth in emerging markets, but without dragging down developed markets. Countries with high current account deficits and those reliant on external financing will be hardest hit. 2
  • 3. PUTNAM I NVESTM ENTS |  putnam.com This credit cycle has unique characteristics that continue to make high-yield bonds attractive. In the current cycle, we have seen only a partial narrowing of valuations and credit spreads, and corporations still sensitive to the pain of the 2008 financial crisis have been somewhat slower to turn to merger and acquisition activity. Also, the current cycle stands out from most predecessors by virtue of its extremely low interest rates and a dearth of nominal yields available to investors around the world. The hunt for yield that has been a hallmark of capital markets for several years is likely to be another factor extending the length of this credit cycle. The current economic recovery started in June 2009 according to the National Bureau of Economic Research. Today, more than four years into the recovery, capital market opportunities are shifting, with conditions in credit sectors such as high-yield corporate debt becoming less attractive. However, the current cycle has different characteristics that suggest investors should not abandon credit strategies just yet. Interest-rate volatility poses greater risk than higher rates themselves. First, let’s consider a typical cycle. By this point, the valuations of high-yield credit relative to investmentgrade bonds, which were separated by a wide chasm in 2008 and 2009, have narrowed considerably. At the same time, credit spreads have tightened, leaving credit sectors with a less impressive yield advantage over higher-quality issues. Third, we have begun to see a change in corporate behavior that often emerges to diminish the attractiveness of credit, as companies begin to issue debt in order to finance mergers and acquisitions. Greater debt issuance tends to weaken balance sheets, even as buying pressure supports equity prices. The yield of the 10-year Treasury rose above 3% in the last week of December, in the wake of the Fed’s announcement that it would reduce bond purchases beginning in January. While rising yields are consistent with a strengthening economic recovery, they also prompt the concern among businesses and investors that higher interest expenses could become a drag on continued expansion. We take a relatively positive view of rising rates, which, on their own, should not be a cause for worry. Rather they should be seen as a symptom of better growth prospects. Indeed, longer-term real interest rates — as measured by the difference between bond yields and inflation — have Figure 2. Rising new manufacturing orders indicate stronger corporate demand. It appears businesses have finally gained adequate confidence to sustain an increase in spending, which can help GDP growth accelerate. 70 60 50 40 30 20 1/2005 1/2007 1/2009 1/2011 1/2013 3 1/2014 Source: ISM Manufacturing Report on Business: New Orders Component.
  • 4. Q1 2014 |  Capital Markets Outlook Figure 3. Treasury volatility increased sharply in 2013 and could continue in 2014. We see real risks ahead as the Fed grapples with communication challenges. — MOVE Index of Treasury Option Volatility Index 200 180 160 140 120 100 80 60 40 1/2009 1/2010 1/2011 1/2012 1/2013 1/2014 Source: Merrill Options Volatility Index reports the average implied volatility across a wide range of outstanding options on the two-year, five-year, 10-year, and 30-year U.S. Treasury securities (with a total weight of 40 percent on the 10-year Treasury and total weights of 20 percent each on the other maturities). Asset class views been moving higher for almost two years. During the past six months, long-term real rates even moved from negative levels to positive territory, yet economic growth and employment gains have remained steady. Equity U.S. equity A strong fourth quarter and continued economic growth helped U.S. equities extend their rally and deliver their best annual performance since the 1990s. The market advance had a brief pause in October when investors were distracted by the U.S. congressional budget debate and the 16-day partial shutdown of the federal government. While ongoing concerns about Federal Reserve policy weighed on equities somewhat, the market responded favorably in late December when the Fed announced its first modest reduction in asset purchases. Throughout 2013, U.S. equity indexes achieved and surpassed their all-time highs several times, with relatively low volatility. While a continued glacial pace of rate increases does not alarm us, we nevertheless see real risks ahead for the Fed as it grapples with communication challenges. We highlighted last quarter that the Fed is employing forward guidance in an attempt to smoothly exit its extraordinary policy initiatives: A mix of bond purchases and holding short-term rates near 0%. The Fed owns over $4 trillion in fixed-income securities, and how its policy goals influence its actions with this portfolio has major consequences for the market. Investors may come to doubt the Fed’s forward guidance given the central bank’s spotty record in economic forecasting. These doubts could contribute to rate volatility across the yield curve. Investors should be prepared to navigate more interest-rate volatility as the Fed seeks to chart a difficult course ahead. U.S. equity performance in 2013 was top quartile by historic measures, and our outlook is more tempered heading into 2014. At the close of the year, equity valuations were in the middle of their historic range; with stocks at average valuations, our expectation should be for average returns. Also worth noting is the fact that most stocks are trading at a price–earnings ratio of around 15x earnings, meaning that valuations are essentially the same across all market sectors. With considerably less disparity in multiples, we believe U.S. equity investors should pay closer attention to growth potential than to valuation. 4
  • 5. PUTNAM I NVESTM ENTS |  putnam.com Market trends Q4 13 10.22% 29.65% MSCI EAFE (ND) 5.71 22.78 MSCI Emerging Markets (ND) 1.83 -2.60 MSCI Europe (ND) 7.88 25.23 MSCI World (ND) 8.00 26.68 Nasdaq 12.03 36.92 Russell 1000 10.23 33.11 Russell 2000 8.72 38.82 10.25 34.23 9.95 32.69 10.51 32.39 4.60 23.96 Barclays Government Bond -0.69 -2.60 Barclays MBS -0.42 -1.41 0.33 -2.55 -0.14 -2.02 0.02 For example, as European countries gradually reduce the intensity of their fiscal-austerity programs, there will be less fiscal drag. This could result in better GDP growth, improved revenue growth for corporations, and better margins for companies that streamlined their operations through the austere fiscal regimes instituted by European governments. 12 months ended 12/31/13 0.07 Index name (returns in US$) EQUITY INDEXES Dow Jones Industrial Average Russell 3000 Growth Russell 3000 Value SP 500 Tokyo Topix FIXED INCOME INDEXES Barclays Municipal Bond Barclays U.S. Aggregate Bond BofA ML 91-day T-bill CG World Government Bond ex-U.S. -1.24 3.75 8.42 JPMorgan Emerging Markets Global Diversified 1.53 -5.25 JPMorgan Global High Yield 3.64 7.41 SP LSTA Loan 1.70 5.29 -0.33 Emerging markets, we believe, will continue to grow, but in our view are not likely to be the primary drivers of global growth as 2014 gets under way. Having said that, the multi-year underperformance of emerging markets does open the door to certain investment opportunities. China, for example, is clamping down on corruption and pollution, as well as slowing its headlong multi-year investment in fixed assets. As it shifts its economy in the direction of domestic consumption and the improvement of its citizens’ quality of life, we think China could offer interesting opportunities for investors. -4.56 JPMorgan Developed High Yield In Japan, we think government policy will continue to put downward pressure on the yen; consequently, we think earnings growth will continue to accelerate among Japanese companies. There is also the potential upside from Japanese structural reform, which includes a list of politically challenging items, such as raising the consumption tax, making changes to employment laws, forging a transpacific trade pact, and reforming key domestic industries. Markets are not yet giving credit for significant progress on these issues, so based on the extent to which the administration of Prime Minister Abe delivers on its ambitions, we think markets are likely to respond positively. -1.22 COMMODITIES SP GSCI Fixed income U.S. fixed income The fourth quarter of 2013 continued to be a favorable environment for taking credit risk and liquidity risk. In addition, strategies oriented toward prepayment risk — such as investments in interest-only collateralized mortgage obligations — generally performed well. The fourth major risk we analyze — interest rates — offered less attractive investment opportunities, in our view, particularly against the backdrop of rising rates. In the years following the 2008 financial crisis, equity correlations rose to record highs. More recently, correlations have declined dramatically and stocks are performing more independently. As share prices deviate from each other, fundamentals begin to matter more. This is an environment, we believe, that demands a more focused, bottom-up approach to portfolio construction. The U.S. macroeconomic picture continued to show signs of health, which contributed to a rising rate environment, but also pointed the way toward a more robust economic recovery in the United States. In particular, the Federal Reserve’s December decision to modestly reduce its bond-buying program offered a degree of confirmation that the economy continues to heal. Bond yields spiked on the news, with the yield on the benchmark 10-year U.S. Treasury breaching the 3% level by year-end. Non-U.S. equity In our view, international stocks offer broad opportunities to investors at the present time. Earnings recoveries, restructuring opportunities, and emerging-market rebound potential are all brightening the horizon for international stocks. 5
  • 6. Q1 2014 |  Capital Markets Outlook As 2014 begins, we are focused on several key policyrelated and macroeconomic risks. First, the Fed is faced with a delicate balancing act as it seeks to communicate about further reductions in its bond-buying program without destabilizing the financial markets or the U.S. economy. This will bear watching as economic data emerge in the months ahead. The second risk is the potential for wage inflation. As the unemployment rate moves downward, we believe wage inflation could develop earlier than the Fed is anticipating, in which case we could see the central bank reducing its stimulus efforts much earlier than the markets are currently forecasting. isolated credit situations have diverted investor attention from the overall health of the municipal bond market. However, we believe that the underlying fundamentals in the market are quite strong. And while the backdrop in 2014 may create some headwinds, we continue to think that the attractive tax-free yields of municipal bonds remain a valuable part of a diversified portfolio for longterm investors seeking income. In our view, technical factors in the market are the big wild card. Tax-exempt municipal fund outflows for 2013 topped $60 billion (Source: JPMorgan) — the most in 20 years — and have put downward pressure on prices. Although we have seen some value-conscious retail and institutional buyers come into the market to help support prices, we think it is unlikely that we will see volatility subside until outflows and rate volatility diminish. The overall fundamental credit outlook of municipal bonds appears solid. With regard to tax policy, many issues remain unresolved, including the debt ceiling and the potential for broader tax reform — both of which could affect the value of municipal bonds. Lastly, it is possible that economic growth in 2014 could be stronger than forecast, particularly during the second half of the year. If that occurs, real interest rates — prevailing interest rates minus the rate of inflation — which have been negative since 2008, could significantly rise. That said, we don’t believe rates are likely to rise so quickly that the shift will undermine the markets. Non-U.S. fixed income In concert with improving economic data in the United States, Japan’s economy strongly rebounded through the end of 2013, while core European economies performed better than we expected. All told, a supportive global economic backdrop encouraged investors to put capital to work in the credit markets. Commodities We continue to have a negative outlook for commodities. Most of our signals remain unchanged from the beginning of the previous quarter, with momentum, emergingmarket weakness, and the performance of currencies of commodity-exporting countries continuing to contribute to our pessimism. There have been significant outflows from commodity markets over the course of 2013, and this remains an unfavorable environment. Geopolitical risk also remains diminished. While there are increasing tensions in important oil producers Libya and Iraq right now, we continue to feel that the potential softening of sanctions in Iran represents more of a downside risk for oil prices. By contrast, the rise in U.S. rates led many investors to move money out of emerging-market sovereign and corporate debt (EMD), which were perceived to be too risky relative to “safer” developed-market debt securities offering higher-trending yields. Also, many investors moved out of emerging-market equities, which put downward pressure on emerging-market currencies and amplified the decline in EMD. Looking forward, we see potential opportunities in select areas of higher-yielding sovereign debt. While these positions may be perceived as riskier in terms of credit risk, they are generally short-term bonds, implying a lower exposure to the negative effects of rising interest rates. Assuming the market is not caught up in a risk-aversion trend that leads to another widespread sell-off of EMD, we believe this approach to sovereign debt can potentially provide EMD portfolios with a yield advantage. Within the asset class, energy has performed stronger than non-energy commodities and the futures curve is more supportive. Where we have policy-driven investments in commodities, we would continue to favor energy-heavy indices such as the SP/GSCI Index. But where there is no policy position, we do not favor long positions. As the year progresses, we will continue to evaluate the extent to which the global economy has recovered and potential support from emerging markets. But at least for the first quarter, we do not believe that these factors will support commodity markets. Tax exempt The past quarter, and most of 2013 for that matter, proved to be a volatile time for municipal bonds, and market conditions remain less than robust. Uncertainty about interest rates and the headline risk from a few 6
  • 7. PUTNAM I NVESTM ENTS |  putnam.com Currency The Barclays Government Bond Index is an unmanaged index of U.S. Treasury and government agency bonds. The Barclays Municipal Bond Index is an unmanaged index of long-term fixed-rate investment-grade tax-exempt bonds. The Barclays 10-Year U.S. Treasury Bellwether Index is an unmanaged index of U.S. Treasury bonds with 10 years’ maturity. The Barclays U.S. Aggregate Bond Index is an unmanaged index used as a general measure of U.S. fixed-income securities. The Barclays U.S. Mortgage-Backed Securities (MBS) Index covers agency mortgage-backed pass-through securities (both fixed-rate and hybrid ARM) issued by Ginnie Mae (GNMA), Fannie Mae (FNMA), and Freddie Mac (FHLMC). The BofA Merrill Lynch U.S. 3-Month Treasury Bill Index consists of U.S. Treasury bills maturing in 90 days. The Citigroup Non-U.S. World Government Bond Index is an unmanaged index generally considered to be representative of the world bond market excluding the United States. The Dow Jones Industrial Average Index (DJIA) is an unmanaged index composed of 30 blue-chip stocks whose one binding similarity is their hugeness — each has sales per year that exceed $7 bil­­lion. The DJIA has been price-weighted since its inception on May 26, 1896, reflects large-cap companies representative of U.S. industry, and historically has moved in tandem with other major market indexes such as the SP 500. The JPMorgan Developed High Yield Index is an unmanaged index of high-yield fixed-income securities issued in developed countries. The JPMorgan Emerging Markets Global Diversified Index is composed of U.S. dollar-denominated Brady bonds, eurobonds, traded loans, and local market debt instruments issued by sovereign and quasi-sovereign entities. JP Morgan Global High Yield Index is an unmanaged index of global high-yield fixed-income securities. The MSCI EAFE Index is an unmanaged list of equity securities from Europe and Australasia, with all values expressed in U.S. dollars. The MSCI Emerging Markets Index is a free-float-adjusted market-capitalizationweighted index that is designed to measure equity market performance in the global emerging markets. The MSCI Europe Index is an unmanaged list of equity securities originating in any of 15 European countries, with all values expressed in U.S. dollars. The MSCI World Index is an unmanaged list of securities from developed and emerging markets, with all values expressed in U.S. dollars. The Nasdaq Composite Index is a widely recognized, market-capitalization-weighted index that is designed to represent the performance of Nasdaq securities and includes over 3,000 stocks. The Russell 1000 Index is an unmanaged index of the 1,000 largest U.S. companies. The Russell 2000 Index is an unmanaged list of common stocks that is frequently used as a general performance measure of U.S. stocks of small and/or midsize companies. Russell 3000 Growth Index is an unmanaged index of those companies in the broadmarket Russell 3000 Index chosen for their growth orientation. Russell 3000 Value Index is an unmanaged index of those companies in the broadmarket Russell 3000 Index chosen for their value orientation. The SP GSCI is a composite index of commodity sector returns that represents a broadly diversified, unleveraged, long-only position in commodity futures. The SP/LSTA Leveraged Loan Index (LLI) is an unmanaged index of U.S. leveraged loans. The SP 500 Index is an unmanaged list of common stocks that is frequently used as a general measure of U.S. stock market performance. The Tokyo Stock Exchange Index (TOPIX) is a market-capitalization-weighted index of over 1,100 stocks traded in the Japanese market. You cannot invest directly in an index. We favor the U.S. dollar. Labor market data has been consistent with the Fed’s intention to taper asset purchases beginning in January. The Federal Open Market Committee (FOMC) under Janet Yellen has altered its forward guidance to be more qualitative to help ensure that front-end rates remain anchored. However, the front end is likely to come under pressure as the U.S. economy continues to outperform and the market begins to challenge the FOMC forward guidance These trends should be supportive of the U.S. dollar. We modestly favor the euro as the surprise rate cut by the European Central Bank (ECB) was not the beginning of a more aggressive policy, but rather a statement that the council has done enough given its expectations for growth and inflation. The risk of the euro weakening remains somewhat limited as the eurozone is set to run a current account surplus exceeding 2% of GDP this year, eurozone banks continue to shed and repatriate overseas assets, and economic data slowly improve. We have a neutral view of the British pound sterling. U.K. growth data remain strong and are challenging the forward guidance as laid out by the Bank of England, but the pound has been the strongest currency over the past several months, reflecting this strength. The pound should be supported over the medium term, but positioning could be a challenge in the short term. The Japanese yen remains vulnerable to weakening. Over the medium term, it is expected that the Bank of Japan will have to do much more than currently slated and should provide further impetus for the dollar to rally versus the yen. The Fed’s tapering expectations continue to have an impact on the Australian dollar and other current account deficit countries that had been supported by safe-haven fixed-income flows. This should keep the Australian dollar biased to the downside. We also favor an underweight to the Canadian dollar. As Canada suffers from a widening in its current account and balance of payments, the Canadian dollar will likely continue to lose ground against the U.S. dollar over the medium term. In emerging markets, the environment has changed substantially and our views are much more neutral. Those currencies with weak external balances, such as those of Indonesia, India, Turkey, and South Africa, remain vulnerable. 7
  • 8. NOTES This material is provided for limited purposes. It is not intended as an offer or solicitation for the purchase or sale of any financial instrument, or any Putnam product or strategy. References to specific asset classes and financial markets are for illustrative purposes only and are not intended to be, and should not be interpreted as, recommendations or investment advice. The opinions expressed in this article represent the current, good-faith views of the author(s) at the time of publication. The views are provided for informational purposes only and are subject to change. This material does not take into account any investor’s particular investment objectives, strategies, tax status, or investment horizon. Investors should consult a financial advisor for advice suited to their individual financial needs. Putnam Investments cannot guarantee the accuracy or completeness of any statements or data contained in the article. Predictions, opinions, and other information contained in this article are subject to change. Any forward-looking statements speak only as of the date they are made, and Putnam assumes no duty to update them. Forward-looking statements are subject to numerous assumptions, risks, and uncertainties. Actual results could differ materially from those anticipated. Past performance is not a guarantee of future results. As with any investment, there is a potential for profit as well as the possibility of loss. This presentation or any portion hereof may not be reprinted, sold, or redistributed in whole or in part without the express written consent of Putnam Investments. The information provided relates to Putnam Investments and its affiliates, which include The Putnam Advisory Company, LLC and Putnam Investments Limited®. Prepared for use in Canada by Putnam Investments Inc. [Investissements Putnam Inc.] (o/a Putnam Management in Manitoba). Where permitted, advisory services are provided in Canada by Putnam Investments Inc. [Investissements Putnam Inc.] (o/a Putnam Management in Manitoba) and its affiliate, The Putnam Advisory Company, LLC. Diversification does not assure a profit or protect against loss. It is possible to lose money in a diversified portfolio. Consider these risks before investing: International investing involves certain risks, such as currency fluctuations, economic instability, and political developments. Investments in small and/or midsize companies increase the risk of greater price fluctuations. Bond investments are subject to interest-rate risk, which means the prices of the fund’s bond investments are likely to fall if interest rates rise. Bond investments also are subject to credit risk, which is the risk that the issuer of the bond may default on payment of interest or principal. Interest-rate risk is generally greater for longer-term bonds, and credit risk is generally greater for below-investment-grade bonds, which may be considered speculative. Unlike bonds, funds that invest in bonds have ongoing fees and expenses. Lower-rated bonds may offer higher yields in return for more risk. Funds that invest in government securities are not guaranteed. Mortgage-backed securities are subject to prepayment risk. Commodities involve the risks of changes in market, political, regulatory, and natural conditions. Scan code or visit putnam.com/outlook for more insight on the global investment landscape. Visit putnam.com for news and information, and our Perspectives blog for in-depth analysis on a range of investment topics. If you are a U.S. retail investor, please request a prospectus, or a summary prospectus if available, from your financial representative or by calling Putnam at 1-800-225-1581. The prospectus includes investment objectives, risks, fees, expenses, and other information that you should read and consider carefully before investing. In the United States, mutual funds are distributed by Putnam Retail Management. putnam.com CM0100 283557 1/14