SlideShare a Scribd company logo
1 of 7
Download to read offline
PRESS RELEASE
Embargoed until 16.00 GMT Monday 3 October 2011

Global ad expenditure continues to grow despite stock
market turmoil
   •   Global ad expenditure forecast to grow 3.6% in 2011 after a modest slowdown in
       expenditure growth towards the end of the year
   •   Growth forecast for 2012 remains a reassuring 5.3%
   •   This picture is consistent with a history of ad market growth after many previous stock
       market shocks, assuming the world economy does not deteriorate dramatically
   •   Developing markets to increase their share of the global ad market from 31.0% in 2010 to
       34.9% in 2013
   •   Internet the fastest-growing medium between 2010 and 2013 (14.6% a year)
   •   Television to contribute most new ad dollars (46% of total)

ZenithOptimedia has made a small reduction to its forecast for global ad expenditure growth in
2011 to 3.6%, which is 0.5 percentage points less than the forecast it made in July. The
slowdown in economic recovery in the developed markets, coupled with rising fears of double-
dip recession, have caused some advertisers to trim back budget increases planned for the end
of 2011, but there has been no sign of the cancelled campaigns and sharp budget cuts that
signalled the beginning of the last advertising downturn in 2008. We now expect total ad
expenditure to reach US$466 billion in 2011, up from US$450 billion in 2010.

We have made a similar reduction to our growth forecast for 2012: from 5.9% to 5.3%, still a
reassuringly healthy rate. 2012 is a ‘quadrennial’ year and will benefit from the summer Olympics
in the UK, the European Football Championship in Poland and Ukraine, and the Presidential
elections in the US. The growth rate will also be boosted by Japan’s recovery from the
earthquake in March, which severely disrupted media and advertising for several weeks this
year. We estimate that the quadrennial effect will add US$6.2 billion to the global ad market in
2012, and the Japanese recovery another US$0.8 billion.

Our new forecast for 2013 is barely changed at 5.5%, down from 5.6% in July.

Soon after we published our last forecast in early July, financial markets fell sharply across the
world, and they have been extremely volatile since then. The Dow Jones Industrial Average fell
12.7% between July 21 and August 10; the Hang Seng fell 14.7% between August 1 and August
9, and the Nikkei 225 fell 13.4% between August 1 and August 22. This has naturally created
concern that the ad market may be headed for another downturn. However, stock market shocks
are not by themselves good indicators of ad market decline. There have been many cases when
stock market crashes have been followed by continued growth in ad expenditure.

ZenithOptimedia has a database of ad expenditure figures for 79 markets going back 31 years.
We looked at 12 dramatic stock market crashes around the world over this period to examine
their effects on ad expenditure. In some cases big declines in stock market values were followed
by downturns in ad expenditure the next year, notably after the Asian financial crisis of 1997 and
the bursting of the dotcom bubble in 2000.

However, the ‘Black Monday’ crash of 1987 caused no slowdown in the most-affected markets –
                                   24 Percy Street London W1T 2BS Telephone +44 (0) 20 7961 1000 Fax +44 (0) 20 7961 1199
                                                                                                 www.zenithoptimedia.com

                                                                          ZenithOptimedia Group Limited • Registered in England no. 4244479
                         Registered office: Pembroke Building Kensington Village Avonmore Road London W14 8DG • Vat no. GB 707283633
in fact growth was faster in 1988 than 1987 in Canada, the UK and the US. The Asian financial
crisis did not prevent ad expenditure growing in Hong Kong in 1998 (though growth was slower
than in 1997), and it had no effect on advertising in the US. And the sharp drop in the DJIA in the
US after September 11 did not prevent the recovery of growth in 2002, though growth remained
weak. In all, half of the stock market crashes preceded an advertising downturn, but half did not.

A crash in stock market values does not by itself mean ad expenditure is about to decline – there
needs to be a causal connection between the two. This connection can either be that an
overvalued stock market is supporting excessive advertising (as was the case in 2000), or that
the market correctly anticipates a sharp downturn in global economic activity.

Advertising expenditure grew rapidly from 0.96% of GDP in 1998 to 1.05% in 2000. As the
dotcom bubble inflated, start-ups funnelled money raised from venture capital firms and IPOs to
the ad market in the name of brand building. When the bubble burst, ad expenditure fell sharply.
Since then there has been no build up of excessive advertising – in fact, advertisers are
spending just 0.73% of GDP, less than at any time since at least 1980. This is partly because of
the rising contribution from developing markets, where advertising typically accounts for a much
lower proportion of GDP. For example in China, now the world’s third-largest ad market,
advertising accounts for only 0.44% of GDP, highlighting the potential for long-term growth as
this proportion approaches the world average.

There is certainly a risk of further economic downturn ahead, but the current consensus is that
the developed economies face a sustained period of below-potential growth instead of decline,
while developing markets will continue to grow rapidly, if at a cooler pace than in 2010. Our
forecasts assume that economic growth remains weak in Europe and the US, but neither goes
into double-dip recession, and the Eurozone debt crisis does not get substantially worse.

Developing markets, in general, continue to expand far faster than developed markets, driven by
their much faster economic growth. We forecast North America to grow by an average of 3.3% a
year between 2010 and 2013 and Western Europe to grow by 2.8%. These regions have
reversed positions since our previous forecast, when we expected Western Europe to
outperform North America with 3.4% growth to North America’s 3.1%. The continuing debt crisis
in the peripheral Eurozone has damaged advertisers’ confidence in Western Europe’s long-term
growth prospects. We expect Japan to grow an average of just 1.1% a year, after a big drop in
2011 followed by the recovery of lost ground over the next two years.

By sharp contrast we forecast Latin America to grow by 7.1% a year between 2010 and 2013,
Asia Pacific excluding Japan to grow by 10.1%, and Central & Eastern Europe to grow by
10.4%. The exception is the Middle East and North Africa, where political turmoil has disrupted
media production and distribution, and made advertisers wary of attracting negative attention.
We forecast a 14.2% decline in ad expenditure in 2011, followed by very modest recovery of
2.0% in 2012 and 2.3% in 2013, averaging 3.6% decline between 2010 and 2013. The global
impact of this will be limited by the fact that the Middle East and North Africa accounts for just
1% of global spend. Overall we expect developing markets – which we here define as
everywhere outside North America, Western Europe and Japan – to increase their share of the
global ad market from 31.0% in 2010 to 34.9% in 2013.

There are now two ‘developing’ markets in the world’s top ten ad markets, and there will be three
in 2013. China is now the third-largest ad market in the world, and is catching up quickly with
second-placed Japan. In 2005 China was 23% of the size of Japan, in 2010 it was 57% and by
2013 we predict it to be 82%. Brazil, at sixth place, is even closer to the UK: 81% of the size of
the UK in 2010 and will be 89% in 2013. Russia, which was in 13th place in 2010, will be in tenth
in 2013.
Top ten ad markets
US$ million, current prices. Currency conversion at 2010 average rates.
     2010                                  Adspend              2013                  Adspend
1    USA                                   151,665         1    USA                   165,977
2    Japan                                  46,153         2    Japan                  47,630
3    China                                  26,122         3    China                  38,854
4    Germany                                23,791         4    Germany                25,429
5    UK                                     18,086         5    UK                     19,656
6    Brazil                                 14,716         6    Brazil                 17,587
7    France                                 12,564         7    France                 13,465
8    Australia                              11,246         8    Australia              12,313
9    Italy                                  10,296         9    Canada                 12,098
10   Canada                                 10,041         10   Russia                 11,413
Source: ZenithOptimedia


The sheer size of the US – 3.3 times the next-largest market – means it will contribute the most
new ad dollars to the global market over the next three years (US$14.3 billion), despite its slow
growth. However, the next five largest contributors are all developing markets: China (which
contributes almost as much as the US, US$12.7 billion), Russia (US$4.7 billion), Brazil (US$2.9
billion), India (US$2.6 billion) and Indonesia (US$2.5 billion). Overall we predict developing
markets will contribute 59% of new ad dollars over the next three years.

The ten largest contributors to global adspend growth (2013 v 2010)
US$ million, current prices. Currency conversion at 2010 average rates.
                                   Adspend growth
1    USA                               14,312
2    China                             12,732
3    Russia                             4,725
4    Brazil                             2,871
5    India                              2,639
6    Indonesia                          2,531
7    Canada                             2,057
8    South Africa                       1,827
9    Germany                            1,638
10   UK                                 1,570
Source: ZenithOptimedia


Advertising expenditure by region
Major media (newspapers, magazines, television, radio, cinema, outdoor, internet)
US$ million, current prices. Currency conversion at 2010 average rates.
                                  2009             2010            2011      2012        2013
North America                    157,475          161,707         165,699   171,772     178,076

Western Europe                    97,127          102,901         105,252   108,473     111,926

Asia/Pacific                     104,724          114,832         121,111   129,878     139,277

Central & Eastern Europe          21,993          23,576           25,686   28,540      31,725

Latin America                     27,063          31,316           32,841   35,504      38,804

Middle East & North Africa        4,589            4,945           4,242     4,328       4,428

Rest of world                     9,380           10,668           11,463   12,629      13,955

World                            422,351          449,944         466,293   491,124     518,190
Source: ZenithOptimedia
Major media (newspapers, magazines, television, radio, cinema, outdoor, internet)
Year-on-year change (%)
                             2009 v 08     2010 v 09      2011 v 10      2012 v 11      2013 v 12
North America                  -12.6          2.7            2.5            3.7            3.7
of which USA                   -12.9          2.3            2.2            3.5            3.5

Western Europe                 -11.0           5.9           2.3            3.1            3.2

Asia Pacific                    -5.4           9.7            5.5           7.2            7.2
excluding Japan                  0.6          17.5           10.3           9.7           10.2

Central & Eastern Europe       -17.9           7.2           8.9           11.1           11.2

Latin America                   2.0           15.7           4.9            8.1            9.3

Middle East & North Africa     -19.5           7.7          -14.2           2.0            2.3

Rest of world                   5.7           13.7           7.5           10.2           10.5

World                           -9.7           6.5           3.6            5.3            5.5
Source: ZenithOptimedia


Global advertising expenditure by medium
As usual, the internet is growing much faster than any other medium, at an average of 14.6% a
year between 2010 and 2013. Display is the fastest-growing segment, growing by 17.2% a year,
driven mainly by online video and social media. Streaming video ads are growing extremely
quickly, thanks to the emergence of do-it-yourself tools that have allowed local advertisers to
enter the market. In most developed markets, social media sites are near the top of the list of
most-popular websites, and they are often way ahead of their rivals in time spent by users. Other
display publishers are developing new tools and formats to compete with social media sites.
Paid search is growing by 14.6% a year, but its growth is being slightly restrained by the shift in
search behaviour from desktop to mobile devices, where costs are currently lower. Online
classified is growing relatively slowly, by 9.2% a year, while employment and property markets
remain weak in the biggest countries. Overall, we predict internet advertising will increase its
share of the ad market from 14.4% in 2010 to 18.9% in 2013, when it will overtake newspapers
to become the world’s second-largest medium.

The main contributor to global ad growth, however, is television, which we forecast to account for
46% of new ad dollars between 2010 and 2013. Television’s share of the global ad market has
risen steadily over time: it attracted 39.8% of spend in 2010, up from 37.0% in 2005, and we
forecast it to attract 40.5% in 2013. The amount of time viewers spend watching television
continues to increase, and even though viewers are presented with a wider choice of channels
than ever, the biggest television events are attracting record audiences. This year’s Super Bowl,
for example, was watched by 111 million Americans, making it the most watched broadcast in
US history. It beat the previous year, itself a record breaker, by 4.2%.
Newspapers and magazines have been declining since 2007, with a brief pause for magazines
in 2010, when ad expenditure remained essentially static. We expect this decline to continue
throughout our forecast period. Magazines are suffering less than newspapers, because the
experience of reading a magazine is less easy to replicate online, and because they do not rely
so much on the timely delivery of information, where the internet has a big advantage over
newspapers. We predict magazine ad expenditure will shrink by 0.6% a year over our forecast
period, while newspaper ad expenditure shrinks by 1.4%. In 2013 newspapers will fall behind the
internet into third place, with a 17.9% share of spend.

Advertising expenditure by medium
US$ million, current prices Currency conversion at 2010 average rates.
                            2009                2010                 2011                  2012                 2013
Newspapers                 96,973              95,416               92,802                91,911               91,334
Magazines                  43,633              43,741               43,224                43,060               42,909
Television                160,199             176,826              184,929               196,182              207,056
Radio                      31,778              32,169               32,899                33,906               35,117
Cinema                      2,107               2,315                2,423                 2,564                2,718
Outdoor                    27,774              29,917               31,503                33,357               35,122
Internet                   54,683              64,026               72,531                83,457               96,392
Total *                   417,147             444,410              460,311               484,436              510,648
Source: ZenithOptimedia
* The totals here are lower than the totals in the ‘Advertising expenditure by region’ table above, since that table includes total
adspend figures for a few countries for which spend is not itemised by medium.


Share of total adspend by medium (%)
                           2009                 2010                 2011                  2012                 2013
Newspapers                 23.2                 21.5                 20.2                  19.0                 17.9
Magazines                  10.5                  9.8                  9.4                   8.9                  8.4
Television                 38.4                 39.8                 40.2                  40.5                 40.5
Radio                       7.6                  7.2                  7.1                   7.0                  6.9
Cinema                      0.5                  0.5                  0.5                   0.5                  0.5
Outdoor                     6.7                  6.7                  6.8                   6.9                  6.9
Internet                   13.1                 14.4                 15.8                  17.2                 18.9

Internet advertising by type
US$ million, current prices Currency conversion at 2010 average rates.
                           2009                 2010                 2011                 2012                  2013
Display                   18,349               21,875               25,282               29,713                35,218
Classified                 9,911               10,950               11,990               13,078                14,246
Paid search               26,423               31,202               35,259               40,666                46,928
Total                     54,683               64,026               72,531               83,457                96,392
Source: ZenithOptimedia
Advertising Expenditure Forecasts is published quarterly priced £435. It may be ordered in hard
or soft copy from www.zenithoptimedia.com

For further information, please contact:

Jonathan Barnard
Head of Forecasting
Tel:         +44 20 7961 1192
Fax:         +44 20 7291 1199
E-mail:      jonathan.barnard@zenithoptimedia.com
ZenithOptimedia is one of the world's leading global media services agencies with 218 offices in
72 countries.

Key clients include AlcatelLucent, Aviva, BBC Worldwide, British Airways, Electrolux, General
Mills, Giorgio Armani Parfums, Kingfisher, Lactalis, Mars-Wrigley, Nestlé, L'Oréal, Puma, Polo
Ralph Lauren, Qantas, Reckitt Benckiser, Richemont Group, Sanofi-Aventis, Siemens,
Telefónica O2, Thomson Multimedia, Toyota/Lexus, Verizon and Whirlpool.

ZenithOptimedia is committed to delivering to clients the best possible return on their advertising
investment.

This approach is supported by a unique system for strategy development and implementation,
The ROI Blueprint. At each stage, proprietary ZOOM (ZenithOptimedia Optimisation of Media)
tools have been designed to add value and insight.

The ZenithOptimedia Village enables the widest range of communications opportunities and
skills to be brought together to ensure the most powerful connections are made with consumers.

ZenithOptimedia is part of Publicis Groupe (Euronext Paris: FR0000130577), the world’s third largest communications
group, the world’s second largest media counsel and buying group, and a global leader in digital and healthcare
communications. With around-the-world activities spanning more than 104 countries on five continents, the Groupe
employs approximately 48,000 professionals.

With sister agencies Starcom MediaVest, Denuo, Digitas and Razorfish, ZenithOptimedia is a member of Publicis
Groupe's VivaKi, a global digital knowledge and resource centre that leverages the combined scale of the
autonomous operations of its members to develop new services, new tools, and new partnerships.

For further information on ZenithOptimedia, please contact:

Steve King
Chief Executive Officer
Tel:          +44 20 7961 1046
Fax:          +44 20 7961 1042
E-mail:       steve.king@zenithoptimedia.com

John Taylor
Chairman
Tel:        +44 20 7961 1133
Fax:        +44 20 7961 1002
E-mail:     john.taylor@zenithoptimedia.com

Tim Jones
Chief Executive Officer – Americas
Tel:          +1 212 859 5100
Fax:          +1 212 727 9495
E-mail:       tim.jones@zenithoptimedia-na.com

Philip Talbot
Chief Executive Officer – Asia Pacific
Tel:          +852 2236 9080
Mob:          +61 4 6600 6443
Fax:          +852 2250 9388
E-mail:       philip.talbot@zenithoptimediagroup.com.hk

All our publications are available online at www.zenithoptimedia.com

More Related Content

Recently uploaded

Russian Call Girls In Gurgaon ❤️8448577510 ⊹Best Escorts Service In 24/7 Delh...
Russian Call Girls In Gurgaon ❤️8448577510 ⊹Best Escorts Service In 24/7 Delh...Russian Call Girls In Gurgaon ❤️8448577510 ⊹Best Escorts Service In 24/7 Delh...
Russian Call Girls In Gurgaon ❤️8448577510 ⊹Best Escorts Service In 24/7 Delh...
lizamodels9
 
Call Girls Navi Mumbai Just Call 9907093804 Top Class Call Girl Service Avail...
Call Girls Navi Mumbai Just Call 9907093804 Top Class Call Girl Service Avail...Call Girls Navi Mumbai Just Call 9907093804 Top Class Call Girl Service Avail...
Call Girls Navi Mumbai Just Call 9907093804 Top Class Call Girl Service Avail...
Dipal Arora
 
FULL ENJOY Call Girls In Majnu Ka Tilla, Delhi Contact Us 8377877756
FULL ENJOY Call Girls In Majnu Ka Tilla, Delhi Contact Us 8377877756FULL ENJOY Call Girls In Majnu Ka Tilla, Delhi Contact Us 8377877756
FULL ENJOY Call Girls In Majnu Ka Tilla, Delhi Contact Us 8377877756
dollysharma2066
 
FULL ENJOY Call Girls In Mahipalpur Delhi Contact Us 8377877756
FULL ENJOY Call Girls In Mahipalpur Delhi Contact Us 8377877756FULL ENJOY Call Girls In Mahipalpur Delhi Contact Us 8377877756
FULL ENJOY Call Girls In Mahipalpur Delhi Contact Us 8377877756
dollysharma2066
 

Recently uploaded (20)

Pharma Works Profile of Karan Communications
Pharma Works Profile of Karan CommunicationsPharma Works Profile of Karan Communications
Pharma Works Profile of Karan Communications
 
B.COM Unit – 4 ( CORPORATE SOCIAL RESPONSIBILITY ( CSR ).pptx
B.COM Unit – 4 ( CORPORATE SOCIAL RESPONSIBILITY ( CSR ).pptxB.COM Unit – 4 ( CORPORATE SOCIAL RESPONSIBILITY ( CSR ).pptx
B.COM Unit – 4 ( CORPORATE SOCIAL RESPONSIBILITY ( CSR ).pptx
 
Monte Carlo simulation : Simulation using MCSM
Monte Carlo simulation : Simulation using MCSMMonte Carlo simulation : Simulation using MCSM
Monte Carlo simulation : Simulation using MCSM
 
👉Chandigarh Call Girls 👉9878799926👉Just Call👉Chandigarh Call Girl In Chandiga...
👉Chandigarh Call Girls 👉9878799926👉Just Call👉Chandigarh Call Girl In Chandiga...👉Chandigarh Call Girls 👉9878799926👉Just Call👉Chandigarh Call Girl In Chandiga...
👉Chandigarh Call Girls 👉9878799926👉Just Call👉Chandigarh Call Girl In Chandiga...
 
Russian Call Girls In Gurgaon ❤️8448577510 ⊹Best Escorts Service In 24/7 Delh...
Russian Call Girls In Gurgaon ❤️8448577510 ⊹Best Escorts Service In 24/7 Delh...Russian Call Girls In Gurgaon ❤️8448577510 ⊹Best Escorts Service In 24/7 Delh...
Russian Call Girls In Gurgaon ❤️8448577510 ⊹Best Escorts Service In 24/7 Delh...
 
Monthly Social Media Update April 2024 pptx.pptx
Monthly Social Media Update April 2024 pptx.pptxMonthly Social Media Update April 2024 pptx.pptx
Monthly Social Media Update April 2024 pptx.pptx
 
Call Girls Navi Mumbai Just Call 9907093804 Top Class Call Girl Service Avail...
Call Girls Navi Mumbai Just Call 9907093804 Top Class Call Girl Service Avail...Call Girls Navi Mumbai Just Call 9907093804 Top Class Call Girl Service Avail...
Call Girls Navi Mumbai Just Call 9907093804 Top Class Call Girl Service Avail...
 
Call Girls in Gomti Nagar - 7388211116 - With room Service
Call Girls in Gomti Nagar - 7388211116  - With room ServiceCall Girls in Gomti Nagar - 7388211116  - With room Service
Call Girls in Gomti Nagar - 7388211116 - With room Service
 
Cracking the Cultural Competence Code.pptx
Cracking the Cultural Competence Code.pptxCracking the Cultural Competence Code.pptx
Cracking the Cultural Competence Code.pptx
 
Call Girls In Panjim North Goa 9971646499 Genuine Service
Call Girls In Panjim North Goa 9971646499 Genuine ServiceCall Girls In Panjim North Goa 9971646499 Genuine Service
Call Girls In Panjim North Goa 9971646499 Genuine Service
 
Best VIP Call Girls Noida Sector 40 Call Me: 8448380779
Best VIP Call Girls Noida Sector 40 Call Me: 8448380779Best VIP Call Girls Noida Sector 40 Call Me: 8448380779
Best VIP Call Girls Noida Sector 40 Call Me: 8448380779
 
Dr. Admir Softic_ presentation_Green Club_ENG.pdf
Dr. Admir Softic_ presentation_Green Club_ENG.pdfDr. Admir Softic_ presentation_Green Club_ENG.pdf
Dr. Admir Softic_ presentation_Green Club_ENG.pdf
 
VVVIP Call Girls In Greater Kailash ➡️ Delhi ➡️ 9999965857 🚀 No Advance 24HRS...
VVVIP Call Girls In Greater Kailash ➡️ Delhi ➡️ 9999965857 🚀 No Advance 24HRS...VVVIP Call Girls In Greater Kailash ➡️ Delhi ➡️ 9999965857 🚀 No Advance 24HRS...
VVVIP Call Girls In Greater Kailash ➡️ Delhi ➡️ 9999965857 🚀 No Advance 24HRS...
 
FULL ENJOY Call Girls In Majnu Ka Tilla, Delhi Contact Us 8377877756
FULL ENJOY Call Girls In Majnu Ka Tilla, Delhi Contact Us 8377877756FULL ENJOY Call Girls In Majnu Ka Tilla, Delhi Contact Us 8377877756
FULL ENJOY Call Girls In Majnu Ka Tilla, Delhi Contact Us 8377877756
 
Mysore Call Girls 8617370543 WhatsApp Number 24x7 Best Services
Mysore Call Girls 8617370543 WhatsApp Number 24x7 Best ServicesMysore Call Girls 8617370543 WhatsApp Number 24x7 Best Services
Mysore Call Girls 8617370543 WhatsApp Number 24x7 Best Services
 
FULL ENJOY Call Girls In Mahipalpur Delhi Contact Us 8377877756
FULL ENJOY Call Girls In Mahipalpur Delhi Contact Us 8377877756FULL ENJOY Call Girls In Mahipalpur Delhi Contact Us 8377877756
FULL ENJOY Call Girls In Mahipalpur Delhi Contact Us 8377877756
 
M.C Lodges -- Guest House in Jhang.
M.C Lodges --  Guest House in Jhang.M.C Lodges --  Guest House in Jhang.
M.C Lodges -- Guest House in Jhang.
 
Organizational Transformation Lead with Culture
Organizational Transformation Lead with CultureOrganizational Transformation Lead with Culture
Organizational Transformation Lead with Culture
 
A DAY IN THE LIFE OF A SALESMAN / WOMAN
A DAY IN THE LIFE OF A  SALESMAN / WOMANA DAY IN THE LIFE OF A  SALESMAN / WOMAN
A DAY IN THE LIFE OF A SALESMAN / WOMAN
 
It will be International Nurses' Day on 12 May
It will be International Nurses' Day on 12 MayIt will be International Nurses' Day on 12 May
It will be International Nurses' Day on 12 May
 

Featured

How Race, Age and Gender Shape Attitudes Towards Mental Health
How Race, Age and Gender Shape Attitudes Towards Mental HealthHow Race, Age and Gender Shape Attitudes Towards Mental Health
How Race, Age and Gender Shape Attitudes Towards Mental Health
ThinkNow
 
Social Media Marketing Trends 2024 // The Global Indie Insights
Social Media Marketing Trends 2024 // The Global Indie InsightsSocial Media Marketing Trends 2024 // The Global Indie Insights
Social Media Marketing Trends 2024 // The Global Indie Insights
Kurio // The Social Media Age(ncy)
 

Featured (20)

Product Design Trends in 2024 | Teenage Engineerings
Product Design Trends in 2024 | Teenage EngineeringsProduct Design Trends in 2024 | Teenage Engineerings
Product Design Trends in 2024 | Teenage Engineerings
 
How Race, Age and Gender Shape Attitudes Towards Mental Health
How Race, Age and Gender Shape Attitudes Towards Mental HealthHow Race, Age and Gender Shape Attitudes Towards Mental Health
How Race, Age and Gender Shape Attitudes Towards Mental Health
 
AI Trends in Creative Operations 2024 by Artwork Flow.pdf
AI Trends in Creative Operations 2024 by Artwork Flow.pdfAI Trends in Creative Operations 2024 by Artwork Flow.pdf
AI Trends in Creative Operations 2024 by Artwork Flow.pdf
 
Skeleton Culture Code
Skeleton Culture CodeSkeleton Culture Code
Skeleton Culture Code
 
PEPSICO Presentation to CAGNY Conference Feb 2024
PEPSICO Presentation to CAGNY Conference Feb 2024PEPSICO Presentation to CAGNY Conference Feb 2024
PEPSICO Presentation to CAGNY Conference Feb 2024
 
Content Methodology: A Best Practices Report (Webinar)
Content Methodology: A Best Practices Report (Webinar)Content Methodology: A Best Practices Report (Webinar)
Content Methodology: A Best Practices Report (Webinar)
 
How to Prepare For a Successful Job Search for 2024
How to Prepare For a Successful Job Search for 2024How to Prepare For a Successful Job Search for 2024
How to Prepare For a Successful Job Search for 2024
 
Social Media Marketing Trends 2024 // The Global Indie Insights
Social Media Marketing Trends 2024 // The Global Indie InsightsSocial Media Marketing Trends 2024 // The Global Indie Insights
Social Media Marketing Trends 2024 // The Global Indie Insights
 
Trends In Paid Search: Navigating The Digital Landscape In 2024
Trends In Paid Search: Navigating The Digital Landscape In 2024Trends In Paid Search: Navigating The Digital Landscape In 2024
Trends In Paid Search: Navigating The Digital Landscape In 2024
 
5 Public speaking tips from TED - Visualized summary
5 Public speaking tips from TED - Visualized summary5 Public speaking tips from TED - Visualized summary
5 Public speaking tips from TED - Visualized summary
 
ChatGPT and the Future of Work - Clark Boyd
ChatGPT and the Future of Work - Clark Boyd ChatGPT and the Future of Work - Clark Boyd
ChatGPT and the Future of Work - Clark Boyd
 
Getting into the tech field. what next
Getting into the tech field. what next Getting into the tech field. what next
Getting into the tech field. what next
 
Google's Just Not That Into You: Understanding Core Updates & Search Intent
Google's Just Not That Into You: Understanding Core Updates & Search IntentGoogle's Just Not That Into You: Understanding Core Updates & Search Intent
Google's Just Not That Into You: Understanding Core Updates & Search Intent
 
How to have difficult conversations
How to have difficult conversations How to have difficult conversations
How to have difficult conversations
 
Introduction to Data Science
Introduction to Data ScienceIntroduction to Data Science
Introduction to Data Science
 
Time Management & Productivity - Best Practices
Time Management & Productivity -  Best PracticesTime Management & Productivity -  Best Practices
Time Management & Productivity - Best Practices
 
The six step guide to practical project management
The six step guide to practical project managementThe six step guide to practical project management
The six step guide to practical project management
 
Beginners Guide to TikTok for Search - Rachel Pearson - We are Tilt __ Bright...
Beginners Guide to TikTok for Search - Rachel Pearson - We are Tilt __ Bright...Beginners Guide to TikTok for Search - Rachel Pearson - We are Tilt __ Bright...
Beginners Guide to TikTok for Search - Rachel Pearson - We are Tilt __ Bright...
 
Unlocking the Power of ChatGPT and AI in Testing - A Real-World Look, present...
Unlocking the Power of ChatGPT and AI in Testing - A Real-World Look, present...Unlocking the Power of ChatGPT and AI in Testing - A Real-World Look, present...
Unlocking the Power of ChatGPT and AI in Testing - A Real-World Look, present...
 
12 Ways to Increase Your Influence at Work
12 Ways to Increase Your Influence at Work12 Ways to Increase Your Influence at Work
12 Ways to Increase Your Influence at Work
 

Worldwide adspend forcast to 2013

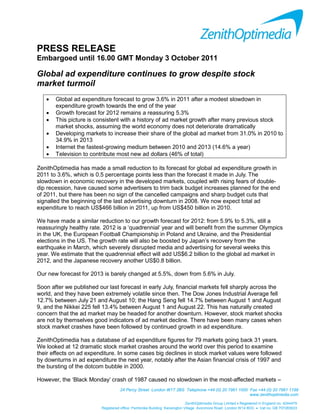
  • 1. PRESS RELEASE Embargoed until 16.00 GMT Monday 3 October 2011 Global ad expenditure continues to grow despite stock market turmoil • Global ad expenditure forecast to grow 3.6% in 2011 after a modest slowdown in expenditure growth towards the end of the year • Growth forecast for 2012 remains a reassuring 5.3% • This picture is consistent with a history of ad market growth after many previous stock market shocks, assuming the world economy does not deteriorate dramatically • Developing markets to increase their share of the global ad market from 31.0% in 2010 to 34.9% in 2013 • Internet the fastest-growing medium between 2010 and 2013 (14.6% a year) • Television to contribute most new ad dollars (46% of total) ZenithOptimedia has made a small reduction to its forecast for global ad expenditure growth in 2011 to 3.6%, which is 0.5 percentage points less than the forecast it made in July. The slowdown in economic recovery in the developed markets, coupled with rising fears of double- dip recession, have caused some advertisers to trim back budget increases planned for the end of 2011, but there has been no sign of the cancelled campaigns and sharp budget cuts that signalled the beginning of the last advertising downturn in 2008. We now expect total ad expenditure to reach US$466 billion in 2011, up from US$450 billion in 2010. We have made a similar reduction to our growth forecast for 2012: from 5.9% to 5.3%, still a reassuringly healthy rate. 2012 is a ‘quadrennial’ year and will benefit from the summer Olympics in the UK, the European Football Championship in Poland and Ukraine, and the Presidential elections in the US. The growth rate will also be boosted by Japan’s recovery from the earthquake in March, which severely disrupted media and advertising for several weeks this year. We estimate that the quadrennial effect will add US$6.2 billion to the global ad market in 2012, and the Japanese recovery another US$0.8 billion. Our new forecast for 2013 is barely changed at 5.5%, down from 5.6% in July. Soon after we published our last forecast in early July, financial markets fell sharply across the world, and they have been extremely volatile since then. The Dow Jones Industrial Average fell 12.7% between July 21 and August 10; the Hang Seng fell 14.7% between August 1 and August 9, and the Nikkei 225 fell 13.4% between August 1 and August 22. This has naturally created concern that the ad market may be headed for another downturn. However, stock market shocks are not by themselves good indicators of ad market decline. There have been many cases when stock market crashes have been followed by continued growth in ad expenditure. ZenithOptimedia has a database of ad expenditure figures for 79 markets going back 31 years. We looked at 12 dramatic stock market crashes around the world over this period to examine their effects on ad expenditure. In some cases big declines in stock market values were followed by downturns in ad expenditure the next year, notably after the Asian financial crisis of 1997 and the bursting of the dotcom bubble in 2000. However, the ‘Black Monday’ crash of 1987 caused no slowdown in the most-affected markets – 24 Percy Street London W1T 2BS Telephone +44 (0) 20 7961 1000 Fax +44 (0) 20 7961 1199 www.zenithoptimedia.com ZenithOptimedia Group Limited • Registered in England no. 4244479 Registered office: Pembroke Building Kensington Village Avonmore Road London W14 8DG • Vat no. GB 707283633
  • 2. in fact growth was faster in 1988 than 1987 in Canada, the UK and the US. The Asian financial crisis did not prevent ad expenditure growing in Hong Kong in 1998 (though growth was slower than in 1997), and it had no effect on advertising in the US. And the sharp drop in the DJIA in the US after September 11 did not prevent the recovery of growth in 2002, though growth remained weak. In all, half of the stock market crashes preceded an advertising downturn, but half did not. A crash in stock market values does not by itself mean ad expenditure is about to decline – there needs to be a causal connection between the two. This connection can either be that an overvalued stock market is supporting excessive advertising (as was the case in 2000), or that the market correctly anticipates a sharp downturn in global economic activity. Advertising expenditure grew rapidly from 0.96% of GDP in 1998 to 1.05% in 2000. As the dotcom bubble inflated, start-ups funnelled money raised from venture capital firms and IPOs to the ad market in the name of brand building. When the bubble burst, ad expenditure fell sharply. Since then there has been no build up of excessive advertising – in fact, advertisers are spending just 0.73% of GDP, less than at any time since at least 1980. This is partly because of the rising contribution from developing markets, where advertising typically accounts for a much lower proportion of GDP. For example in China, now the world’s third-largest ad market, advertising accounts for only 0.44% of GDP, highlighting the potential for long-term growth as this proportion approaches the world average. There is certainly a risk of further economic downturn ahead, but the current consensus is that the developed economies face a sustained period of below-potential growth instead of decline, while developing markets will continue to grow rapidly, if at a cooler pace than in 2010. Our forecasts assume that economic growth remains weak in Europe and the US, but neither goes into double-dip recession, and the Eurozone debt crisis does not get substantially worse. Developing markets, in general, continue to expand far faster than developed markets, driven by their much faster economic growth. We forecast North America to grow by an average of 3.3% a year between 2010 and 2013 and Western Europe to grow by 2.8%. These regions have reversed positions since our previous forecast, when we expected Western Europe to outperform North America with 3.4% growth to North America’s 3.1%. The continuing debt crisis in the peripheral Eurozone has damaged advertisers’ confidence in Western Europe’s long-term growth prospects. We expect Japan to grow an average of just 1.1% a year, after a big drop in 2011 followed by the recovery of lost ground over the next two years. By sharp contrast we forecast Latin America to grow by 7.1% a year between 2010 and 2013, Asia Pacific excluding Japan to grow by 10.1%, and Central & Eastern Europe to grow by 10.4%. The exception is the Middle East and North Africa, where political turmoil has disrupted media production and distribution, and made advertisers wary of attracting negative attention. We forecast a 14.2% decline in ad expenditure in 2011, followed by very modest recovery of 2.0% in 2012 and 2.3% in 2013, averaging 3.6% decline between 2010 and 2013. The global impact of this will be limited by the fact that the Middle East and North Africa accounts for just 1% of global spend. Overall we expect developing markets – which we here define as everywhere outside North America, Western Europe and Japan – to increase their share of the global ad market from 31.0% in 2010 to 34.9% in 2013. There are now two ‘developing’ markets in the world’s top ten ad markets, and there will be three in 2013. China is now the third-largest ad market in the world, and is catching up quickly with second-placed Japan. In 2005 China was 23% of the size of Japan, in 2010 it was 57% and by 2013 we predict it to be 82%. Brazil, at sixth place, is even closer to the UK: 81% of the size of the UK in 2010 and will be 89% in 2013. Russia, which was in 13th place in 2010, will be in tenth in 2013.
  • 3. Top ten ad markets US$ million, current prices. Currency conversion at 2010 average rates. 2010 Adspend 2013 Adspend 1 USA 151,665 1 USA 165,977 2 Japan 46,153 2 Japan 47,630 3 China 26,122 3 China 38,854 4 Germany 23,791 4 Germany 25,429 5 UK 18,086 5 UK 19,656 6 Brazil 14,716 6 Brazil 17,587 7 France 12,564 7 France 13,465 8 Australia 11,246 8 Australia 12,313 9 Italy 10,296 9 Canada 12,098 10 Canada 10,041 10 Russia 11,413 Source: ZenithOptimedia The sheer size of the US – 3.3 times the next-largest market – means it will contribute the most new ad dollars to the global market over the next three years (US$14.3 billion), despite its slow growth. However, the next five largest contributors are all developing markets: China (which contributes almost as much as the US, US$12.7 billion), Russia (US$4.7 billion), Brazil (US$2.9 billion), India (US$2.6 billion) and Indonesia (US$2.5 billion). Overall we predict developing markets will contribute 59% of new ad dollars over the next three years. The ten largest contributors to global adspend growth (2013 v 2010) US$ million, current prices. Currency conversion at 2010 average rates. Adspend growth 1 USA 14,312 2 China 12,732 3 Russia 4,725 4 Brazil 2,871 5 India 2,639 6 Indonesia 2,531 7 Canada 2,057 8 South Africa 1,827 9 Germany 1,638 10 UK 1,570 Source: ZenithOptimedia Advertising expenditure by region Major media (newspapers, magazines, television, radio, cinema, outdoor, internet) US$ million, current prices. Currency conversion at 2010 average rates. 2009 2010 2011 2012 2013 North America 157,475 161,707 165,699 171,772 178,076 Western Europe 97,127 102,901 105,252 108,473 111,926 Asia/Pacific 104,724 114,832 121,111 129,878 139,277 Central & Eastern Europe 21,993 23,576 25,686 28,540 31,725 Latin America 27,063 31,316 32,841 35,504 38,804 Middle East & North Africa 4,589 4,945 4,242 4,328 4,428 Rest of world 9,380 10,668 11,463 12,629 13,955 World 422,351 449,944 466,293 491,124 518,190 Source: ZenithOptimedia
  • 4. Major media (newspapers, magazines, television, radio, cinema, outdoor, internet) Year-on-year change (%) 2009 v 08 2010 v 09 2011 v 10 2012 v 11 2013 v 12 North America -12.6 2.7 2.5 3.7 3.7 of which USA -12.9 2.3 2.2 3.5 3.5 Western Europe -11.0 5.9 2.3 3.1 3.2 Asia Pacific -5.4 9.7 5.5 7.2 7.2 excluding Japan 0.6 17.5 10.3 9.7 10.2 Central & Eastern Europe -17.9 7.2 8.9 11.1 11.2 Latin America 2.0 15.7 4.9 8.1 9.3 Middle East & North Africa -19.5 7.7 -14.2 2.0 2.3 Rest of world 5.7 13.7 7.5 10.2 10.5 World -9.7 6.5 3.6 5.3 5.5 Source: ZenithOptimedia Global advertising expenditure by medium As usual, the internet is growing much faster than any other medium, at an average of 14.6% a year between 2010 and 2013. Display is the fastest-growing segment, growing by 17.2% a year, driven mainly by online video and social media. Streaming video ads are growing extremely quickly, thanks to the emergence of do-it-yourself tools that have allowed local advertisers to enter the market. In most developed markets, social media sites are near the top of the list of most-popular websites, and they are often way ahead of their rivals in time spent by users. Other display publishers are developing new tools and formats to compete with social media sites. Paid search is growing by 14.6% a year, but its growth is being slightly restrained by the shift in search behaviour from desktop to mobile devices, where costs are currently lower. Online classified is growing relatively slowly, by 9.2% a year, while employment and property markets remain weak in the biggest countries. Overall, we predict internet advertising will increase its share of the ad market from 14.4% in 2010 to 18.9% in 2013, when it will overtake newspapers to become the world’s second-largest medium. The main contributor to global ad growth, however, is television, which we forecast to account for 46% of new ad dollars between 2010 and 2013. Television’s share of the global ad market has risen steadily over time: it attracted 39.8% of spend in 2010, up from 37.0% in 2005, and we forecast it to attract 40.5% in 2013. The amount of time viewers spend watching television continues to increase, and even though viewers are presented with a wider choice of channels than ever, the biggest television events are attracting record audiences. This year’s Super Bowl, for example, was watched by 111 million Americans, making it the most watched broadcast in US history. It beat the previous year, itself a record breaker, by 4.2%.
  • 5. Newspapers and magazines have been declining since 2007, with a brief pause for magazines in 2010, when ad expenditure remained essentially static. We expect this decline to continue throughout our forecast period. Magazines are suffering less than newspapers, because the experience of reading a magazine is less easy to replicate online, and because they do not rely so much on the timely delivery of information, where the internet has a big advantage over newspapers. We predict magazine ad expenditure will shrink by 0.6% a year over our forecast period, while newspaper ad expenditure shrinks by 1.4%. In 2013 newspapers will fall behind the internet into third place, with a 17.9% share of spend. Advertising expenditure by medium US$ million, current prices Currency conversion at 2010 average rates. 2009 2010 2011 2012 2013 Newspapers 96,973 95,416 92,802 91,911 91,334 Magazines 43,633 43,741 43,224 43,060 42,909 Television 160,199 176,826 184,929 196,182 207,056 Radio 31,778 32,169 32,899 33,906 35,117 Cinema 2,107 2,315 2,423 2,564 2,718 Outdoor 27,774 29,917 31,503 33,357 35,122 Internet 54,683 64,026 72,531 83,457 96,392 Total * 417,147 444,410 460,311 484,436 510,648 Source: ZenithOptimedia * The totals here are lower than the totals in the ‘Advertising expenditure by region’ table above, since that table includes total adspend figures for a few countries for which spend is not itemised by medium. Share of total adspend by medium (%) 2009 2010 2011 2012 2013 Newspapers 23.2 21.5 20.2 19.0 17.9 Magazines 10.5 9.8 9.4 8.9 8.4 Television 38.4 39.8 40.2 40.5 40.5 Radio 7.6 7.2 7.1 7.0 6.9 Cinema 0.5 0.5 0.5 0.5 0.5 Outdoor 6.7 6.7 6.8 6.9 6.9 Internet 13.1 14.4 15.8 17.2 18.9 Internet advertising by type US$ million, current prices Currency conversion at 2010 average rates. 2009 2010 2011 2012 2013 Display 18,349 21,875 25,282 29,713 35,218 Classified 9,911 10,950 11,990 13,078 14,246 Paid search 26,423 31,202 35,259 40,666 46,928 Total 54,683 64,026 72,531 83,457 96,392 Source: ZenithOptimedia
  • 6. Advertising Expenditure Forecasts is published quarterly priced £435. It may be ordered in hard or soft copy from www.zenithoptimedia.com For further information, please contact: Jonathan Barnard Head of Forecasting Tel: +44 20 7961 1192 Fax: +44 20 7291 1199 E-mail: jonathan.barnard@zenithoptimedia.com
  • 7. ZenithOptimedia is one of the world's leading global media services agencies with 218 offices in 72 countries. Key clients include AlcatelLucent, Aviva, BBC Worldwide, British Airways, Electrolux, General Mills, Giorgio Armani Parfums, Kingfisher, Lactalis, Mars-Wrigley, Nestlé, L'Oréal, Puma, Polo Ralph Lauren, Qantas, Reckitt Benckiser, Richemont Group, Sanofi-Aventis, Siemens, Telefónica O2, Thomson Multimedia, Toyota/Lexus, Verizon and Whirlpool. ZenithOptimedia is committed to delivering to clients the best possible return on their advertising investment. This approach is supported by a unique system for strategy development and implementation, The ROI Blueprint. At each stage, proprietary ZOOM (ZenithOptimedia Optimisation of Media) tools have been designed to add value and insight. The ZenithOptimedia Village enables the widest range of communications opportunities and skills to be brought together to ensure the most powerful connections are made with consumers. ZenithOptimedia is part of Publicis Groupe (Euronext Paris: FR0000130577), the world’s third largest communications group, the world’s second largest media counsel and buying group, and a global leader in digital and healthcare communications. With around-the-world activities spanning more than 104 countries on five continents, the Groupe employs approximately 48,000 professionals. With sister agencies Starcom MediaVest, Denuo, Digitas and Razorfish, ZenithOptimedia is a member of Publicis Groupe's VivaKi, a global digital knowledge and resource centre that leverages the combined scale of the autonomous operations of its members to develop new services, new tools, and new partnerships. For further information on ZenithOptimedia, please contact: Steve King Chief Executive Officer Tel: +44 20 7961 1046 Fax: +44 20 7961 1042 E-mail: steve.king@zenithoptimedia.com John Taylor Chairman Tel: +44 20 7961 1133 Fax: +44 20 7961 1002 E-mail: john.taylor@zenithoptimedia.com Tim Jones Chief Executive Officer – Americas Tel: +1 212 859 5100 Fax: +1 212 727 9495 E-mail: tim.jones@zenithoptimedia-na.com Philip Talbot Chief Executive Officer – Asia Pacific Tel: +852 2236 9080 Mob: +61 4 6600 6443 Fax: +852 2250 9388 E-mail: philip.talbot@zenithoptimediagroup.com.hk All our publications are available online at www.zenithoptimedia.com