Unlocking the Power of ChatGPT and AI in Testing - A Real-World Look, present...
Table
1. TABLE: 1-GENDER
S. No. Particulars Respondents Percentage
1 Male 72 60
2 Female 48 40
Total 120 100
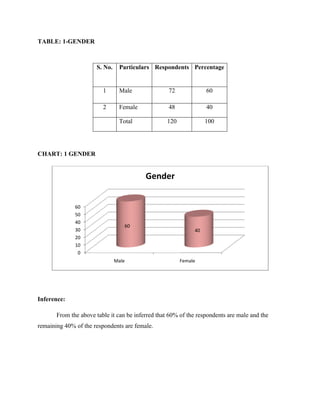
CHART: 1 GENDER
Gender
60
50
40
60
30 40
20
10
0
Male Female
Inference:
From the above table it can be inferred that 60% of the respondents are male and the
remaining 40% of the respondents are female.
2. TABLE: 2-AGE
S. No. Particulars Respondents Percentage
1 Less than 6 5
20years
2 20-30years 60 50
3 30-40years 30 25
4 Above 50years 24 20
Total 120 100
CHART: 2-AGE
Age
50
40
30 50
20
25
20
10
5
0
Less than 20yrs 20-30yrs 30-40yrs Above 50yrs
Inference:
From the above table it can be inferred that 50% of the respondents are in the age limit
20-30years, 25% of the respondents are in the age limit 30-40years, 20% of the respondents are
above 50years and the remaining 5% of the respondents are less than 20years.
3. TABLE: 3- EDUCATION QUALIFICATION
S. No. Particulars Respondents Percentage
1 Professional
2 PG 8
3 UG 32
4 Diploma 48
5 Other 36
Total 120 100