1. PROOF
The evolution of the containership over the
past two decades has allowed shipping lines
to pursue economies of scale that reduce the
cost per slot (at equivalent utilisation levels)
to all time lows.
The capacity of the largest container
ships, per decade, over the last 20 years has
increased by over 135%, this is manifested
in the current 19,224 TEU world’s biggest
ship, which was only 8,160 TEU in 2006.
However, the length of these vessels has
only increased by 14% from 347m to 400m
in the same period.
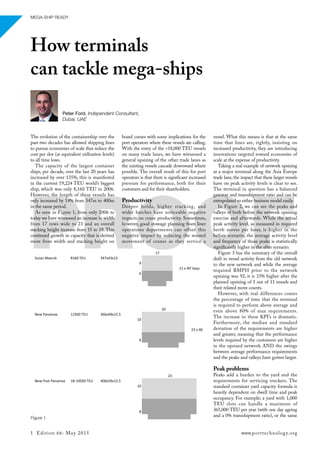
As seen in Figure 1, from only 2006 to
today we have witnessed an increase in width
from 17 rows wide to 23 and an overall
stacking height increase from 15 to 18. This
continued growth in capacity that is derived
more from width and stacking height on
board comes with some implications for the
port operators where these vessels are calling.
With the entry of the +18,000 TEU vessels
on many trade lanes, we have witnessed a
general upsizing of the other trade lanes as
the existing vessels cascade downward where
possible. The overall result of this for port
operators is that there is significant increased
pressure for performance, both for their
customers and for their shareholders.
Productivity
Deeper holds, higher stacking, and
wider hatches have noticeable negative
impacts on crane productivity. Sometimes,
however, good stowage planning from liner
operations departments can offset this
negative impact by reducing the wasted
movement of cranes as they service a
vessel. What this means is that at the same
time that lines are, rightly, insisting on
increased productivity, they are introducing
innovations targeted toward economies of
scale at the expense of productivity.
Taking a real example of network upsizing
at a major terminal along the Asia Europe
trade lane, the impact that these larger vessels
have on peak activity levels is clear to see.
The terminal in question has a balanced
gateway and transshipment ratio and can be
extrapolated to either business model easily.
In Figure 2, we can see the peaks and
valleys of both before the network upsizing
exercise and afterwards. While the actual
peak activity level, as measured in required
berth moves per hour, is higher in the
before scenario, the average activity level
and frequency of those peaks is statistically
significantly higher in the after scenario.
Figure 3 has the summary of the overall
shift in vessel activity from the old network
to the new network and while the average
required BMPH prior to the network
upsizing was 92, it is 33% higher after the
planned upsizing of 5 out of 11 vessels and
their related move counts.
However, with real differences comes
the percentage of time that the terminal
is required to perform above average and
even above 80% of max requirements.
The increase in these KPI’s is dramatic.
Furthermore, the median and standard
deviation of the requirements are higher
and greater, meaning that the performance
levels required by the customers are higher
in the upsized network AND the swings
between average performance requirements
and the peaks and valleys have gotten larger.
Peak problems
Peaks add a burden to the yard and the
requirements for servicing truckers. The
standard container yard capacity formula is
heavily dependent on dwell time and peak
occupancy. For example; a yard with 1,000
TEU slots can handle a maximum of
365,000 TEU per year (with one day ageing
and a 0% transshipment ratio), or the same
How terminals
can tackle mega-ships
Peter Ford, Independent Consultant,
Dubai, UAE
Illustration 1
17
Susan Maersk 8160 TEU 347x43x15
9
21 x 40' bays
6
20
New Panamax 12500 TEU 366x49x15.5
10
23 x 40
6
23
New Post Panamax 18‐19500 TEU 400x59x15.5
10
8
Figure 1
1 Edition 66: May 2015 www.porttechnology.org
MEGA-SHIP READY
2. PROOFyard can handle only 280,769 TEU per-year
under the same assumptions, but with a peak
factor of 30%. This is a reduction of 20%
capacity simply due to peaks. Any increase
in peak handling equals a reduction in yard
capacity and equals wasted assets in between
those peaks.This reduction in capacity is the
direct impact we see that network upsizing
has on port container yard investments.
Peaks have further significant
operational and financial implications on
ports and the supply chains that these
increasingly large vessels are being used
on. Because operational manning can be
either a fixed or variable cost depending on
the labour situation at a port, it is easier to
focus here on capital requirements when
examining the financial impacts from this
change in scenarios.
Cranes typically have a financial
lifespan of 25 years for depreciation and
ROIC calculations. If a port were to have
purchased state-of-the-art cranes only
10 years ago to ensure they could handle
the largest container vessels on the water,
they would have to have upgrade this
superstructure drastically only 40% into
the lifespan. An upgrade of this equipment
would require at least 4, but more likely,
6, new cranes. This requirement would
add anywhere between US$30m-45m
in CAPEX to the business and saddling
the annual Net Profit with an additional
$1.2m-2.2m in depreciation.
Lower cost alternatives like raising
and extending cranes are available, but
also require significant investment to be
capitalised, and furthermore, these solutions
add complexity to current operations and
equipment risk where these modifications
are made. Cranes are not the only additional
CAPEX requirements these larger vessels
have added to the ports they call at. Deeper
channels and berths require dredging,
additional yard space, additional yard
equipment, and, in some cases, additional
quay strengthening for the larger and heavier
cranes all require large CAPEX outlays that
can run into the hundreds of millions of
dollars. The impact these expenses have on
the ROI of a port investment is substantial,
and unfortunately for ports along the trade
lanes these large vessel ply the only guarantee
is that without these investments, the port or
terminal will find itself irrelevant.
Conclusion
As vessels continue to increase in size,
as can be seen with MOL’s recent order
of several 20,150 TEU vessels, port
investments will continue to be required.
In order to keep a balanced business
ecosystem, however, lines (or alliances) and
port stakeholders are going to have to begin
working together to find new methods of
supporting these investments.
Concepts like berth productivity
incentives, guaranteed capacity contracts,
long term guaranteed volumes, and other
win/win arrangements must become
more common. Ports cannot invest
massive amounts of capital resources only
to have their customer shift away before
the payback period has been reached. At
the same time, shipping lines and their
alliances cannot accept poor performance
from ports that fritter away the benefits
achieved by the economy of scale derived
by these large vessels.
BMPHCustomerRequirements
Day / Hr
Peak and Average Activity Levels
Before Upsizing Activity
Pre-Upsizing Average
After Upsizing Activity
Post-Upsizing AverageFigure 2
Before After Delta
Peak BMPH required 237 231 -3%
Average BMPH required 92 123 +33%
% of time required to perform above average 28% 51% +82%
% of time required to perform at 80% of max 5% 11% +120%
Performance requirement standard deviation 45 64 +42%
Performance requirement median 74 129 +74%
Figure 3
About the author
Peter Ford is a highly accomplished
executive with a successful record of
improving business results through
strategy development and successful
execution. Peter currently utilises his
specialties in strategy development,
strategy execution, executive leadership,
operations, union behavior, efficiency,
cost cutting, LEAN, and Six Sigma as
an independent consultant delivering
value to organisations worldwide. Until
recently, Peter was the Global Chief
Operating Officer for the Gulftainer
Group of companies where he led the
team toward its highest historical results
and was responsible for the negotiations
that allowed Gulftainer to expand its
footprint into Port Canaveral, FL. Peter
has also worked with the AP Moller-
Maersk group and has also completed a
number of management and leadership
courses at esteemed schools including:
Harvard University, the University of
Michigan, the University of Phoenix
(MBA) and the United States
Merchant Marine Academy (Bs).
Enquiries
pc.ford1@gmail.com
http://ae.linkedin.com/in/petercford/en
Edition 66: May 2015 2
MEGA-SHIP READY