1. EXCEL EXERCISE #7: Cost-Benefit Analysis
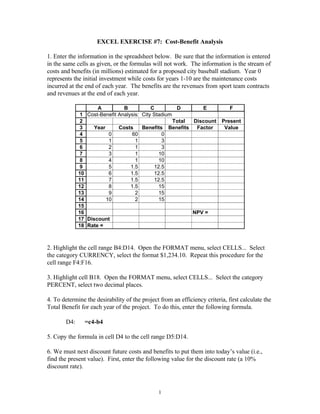
1. Enter the information in the spreadsheet below. Be sure that the information is entered
in the same cells as given, or the formulas will not work. The information is the stream of
costs and benefits (in millions) estimated for a proposed city baseball stadium. Year 0
represents the initial investment while costs for years 1-10 are the maintenance costs
incurred at the end of each year. The benefits are the revenues from sport team contracts
and revenues at the end of each year.
A B C D E F
1 Cost-Benefit Analysis: City Stadium
2 Total Discount Present
3 Year Costs Benefits Benefits Factor Value
4 0 60 0
5 1 1 3
6 2 1 3
7 3 1 10
8 4 1 10
9 5 1.5 12.5
10 6 1.5 12.5
11 7 1.5 12.5
12 8 1.5 15
13 9 2 15
14 10 2 15
15
16 NPV =
17 Discount
18 Rate =
2. Highlight the cell range B4:D14. Open the FORMAT menu, select CELLS... Select
the category CURRENCY, select the format $1,234.10. Repeat this procedure for the
cell range F4:F16.
3. Highlight cell B18. Open the FORMAT menu, select CELLS... Select the category
PERCENT, select two decimal places.
4. To determine the desirability of the project from an efficiency criteria, first calculate the
Total Benefit for each year of the project. To do this, enter the following formula.
D4: =c4-b4
5. Copy the formula in cell D4 to the cell range D5:D14.
6. We must next discount future costs and benefits to put them into today’s value (i.e.,
find the present value). First, enter the following value for the discount rate (a 10%
discount rate).
1
2. B18: 0.1
7. Second, calculate the discount factor for each year. Enter the following formula.
E4: =1/(1+$b$18)^a4
8. Copy the formula in cell E4 to the cell range E5:E14.
9. Third, multiply the total benefit for each year by the discount factor for each year.
Enter the following formula.
F4: =d4*e4
10. Copy the formula in cell F4 to the cell range F5:F14.
11. Find the Net Present Value. Add together the Present Values for each year. Enter the
following formula.
F16: =sum(f4:f14)
Note: Steps 9-11 could be accomplished with one simple formula:
=sumproduct(d4:d14,e4:e14)
12. Change the discount rate and see what happens to the Net Present Value of the
stadium project. With a discount rate of 7% or below, the project would not be cost
effective.
13. Enter the following information.
A20: Shortcut:
A21: NPV =
A22: IRR =
14. An easy way of calculating net present value can replace steps 7-12. Excel has a net
present value function as follows: =NPV(rate,value1,value2,...)
This function assumes that each value occurs at the end of consecutive years (i.e., year1,
year 2, year 3,...). Since any initial investments (i.e., costs) occur at the beginning of the
project and not at the end of year 1, these initial costs are added on to the result returned
by the NPV function. For this exercise enter the following formula.
B21: =npv(b18,d5:d14)+d4
15. A usual piece of information for a cost-benefit analysis is the discount rate that returns
a net present value of $0. This can be obtained with the IRR function as follows:
=IRR(values)
2
3. For this exercise enter the following formula.
B22: =irr(d4:d14)
Your completed spreadsheet should look like the one below.
A B C D E F
1 Cost-Benefit Analysis: City Stadium
2 Total Discount Present
3 Year Costs Benefits Benefits Factor Value
4 0 $60.00 $0.00 ($60.00) 1.00 ($60.00)
5 1 $1.00 $3.00 $2.00 0.91 $1.82
6 2 $1.00 $3.00 $2.00 0.83 $1.65
7 3 $1.00 $10.00 $9.00 0.75 $6.76
8 4 $1.00 $10.00 $9.00 0.68 $6.15
9 5 $1.50 $12.50 $11.00 0.62 $6.83
10 6 $1.50 $12.50 $11.00 0.56 $6.21
11 7 $1.50 $12.50 $11.00 0.51 $5.64
12 8 $1.50 $15.00 $13.50 0.47 $6.30
13 9 $2.00 $15.00 $13.00 0.42 $5.51
14 10 $2.00 $15.00 $13.00 0.39 $5.01
15
16 NPV = ($8.11)
17 Discount
18 Rate = 10.00%
19
20 Shortcut:
21 NPV = ($8.11)
22 IRR = 7.398%
16. Save the spreadsheet: A:CBASTAD.XLS
3