More Related Content
Similar to Evolucion precios-petroleo07-09
Similar to Evolucion precios-petroleo07-09 (16)
More from Escuela de Empresarios y Emprendedores
More from Escuela de Empresarios y Emprendedores (20)
Evolucion precios-petroleo07-09
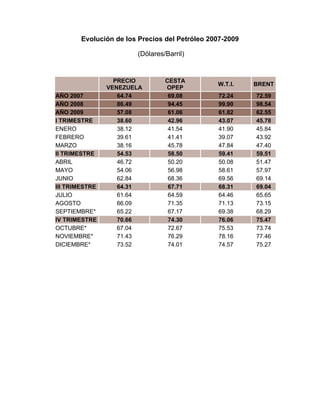
- 1. Evolución de los Precios del Petróleo 2007-2009
(Dólares/Barril)
PRECIO CESTA
W.T.I. BRENT
VENEZUELA OPEP
AÑO 2007 64.74 69.08 72.24 72.59
AÑO 2008 86.49 94.45 99.90 98.54
AÑO 2009 57.08 61.06 61.82 62.55
I TRIMESTRE 38.60 42.96 43.07 45.78
ENERO 38.12 41.54 41.90 45.84
FEBRERO 39.61 41.41 39.07 43.92
MARZO 38.16 45.78 47.84 47.40
II TRIMESTRE 54.53 58.50 59.41 59.51
ABRIL 46.72 50.20 50.08 51.47
MAYO 54.06 56.98 58.61 57.97
JUNIO 62.84 68.36 69.56 69.14
III TRIMESTRE 64.31 67.71 68.31 69.04
JULIO 61.64 64.59 64.46 65.65
AGOSTO 66.09 71.35 71.13 73.15
SEPTIEMBRE* 65.22 67.17 69.38 68.29
IV TRIMESTRE 70.66 74.30 76.06 75.47
OCTUBRE* 67.04 72.67 75.53 73.74
NOVIEMBRE* 71.43 76.29 78.16 77.46
DICIEMBRE* 73.52 74.01 74.57 75.27