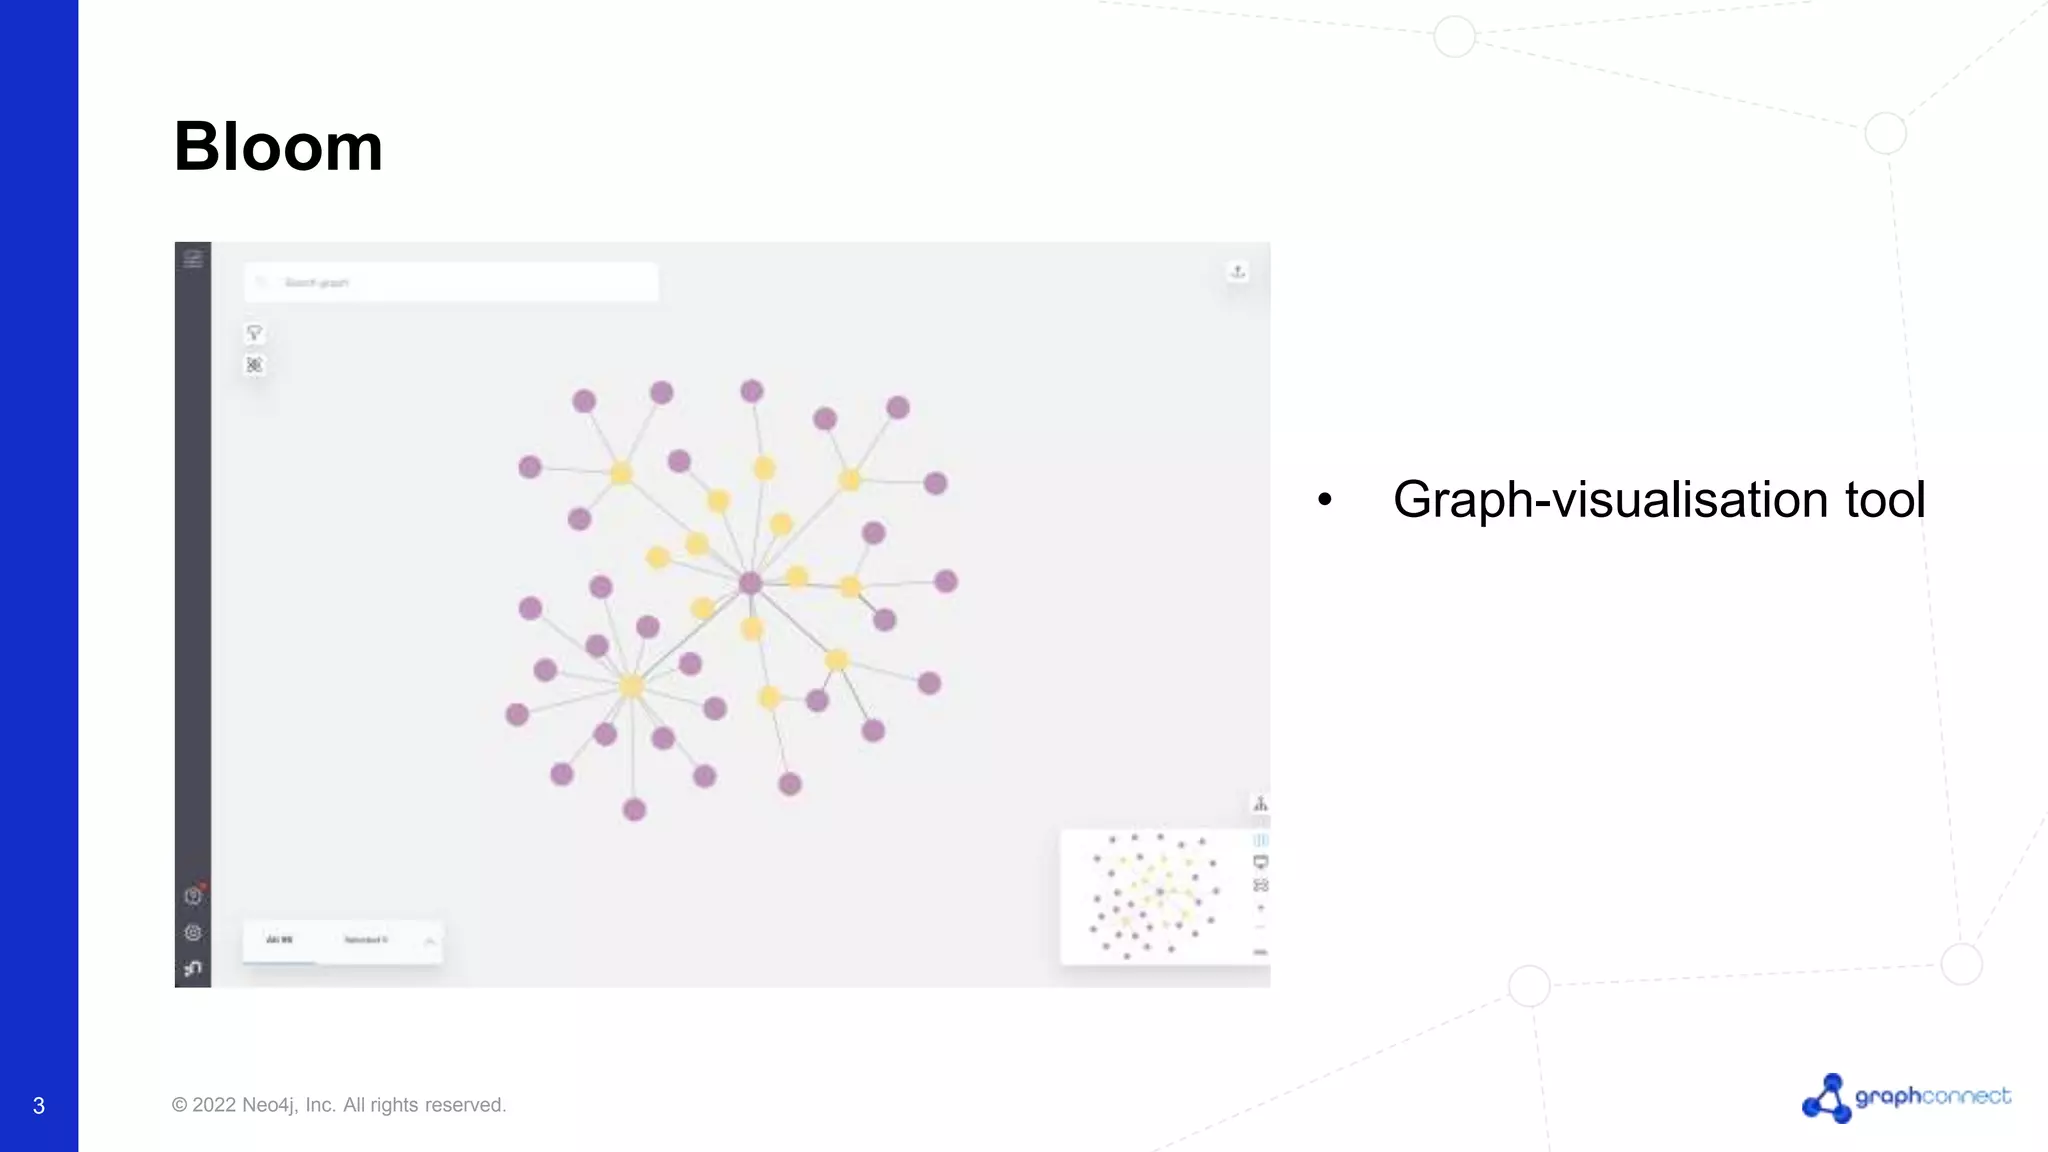
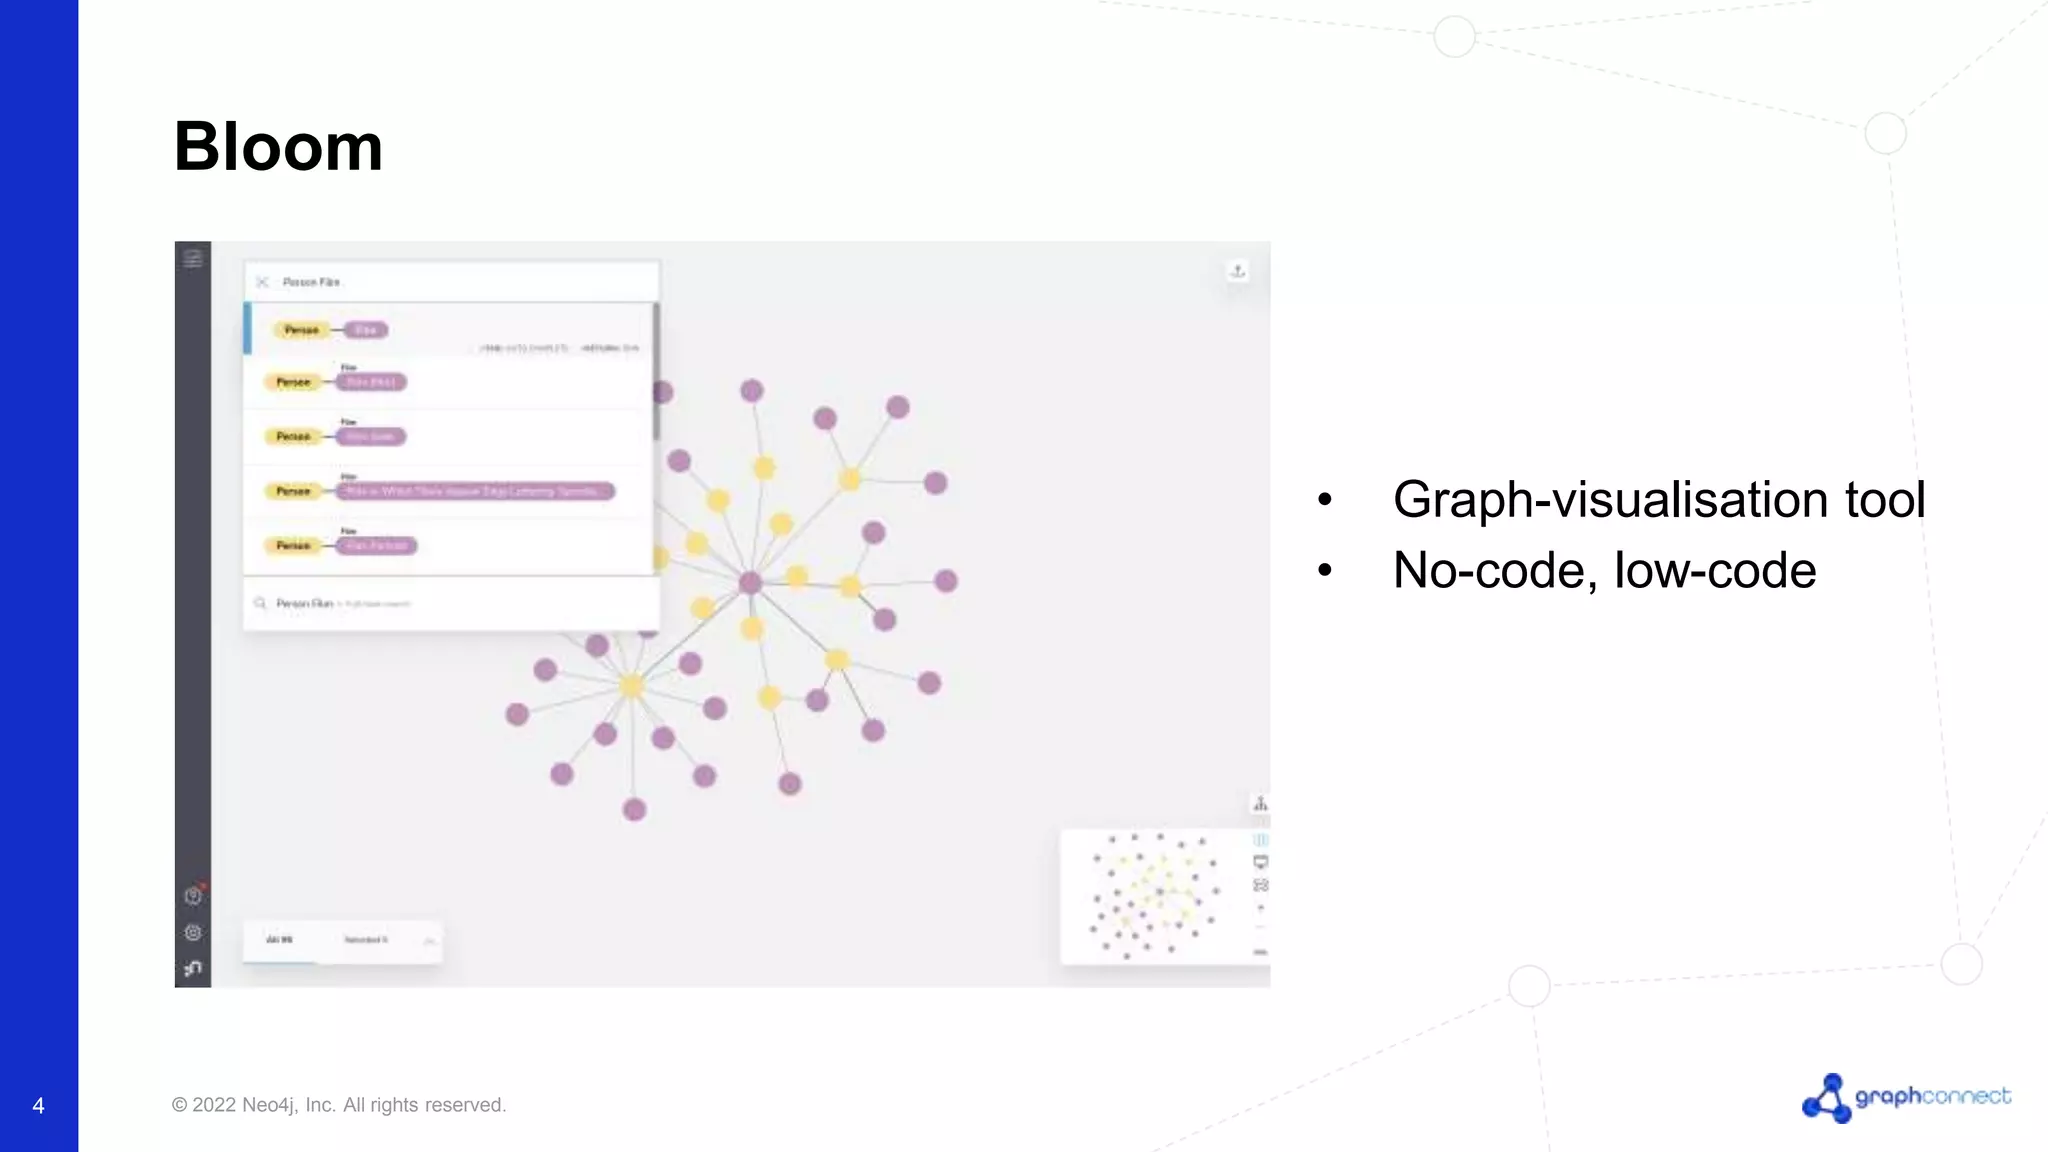
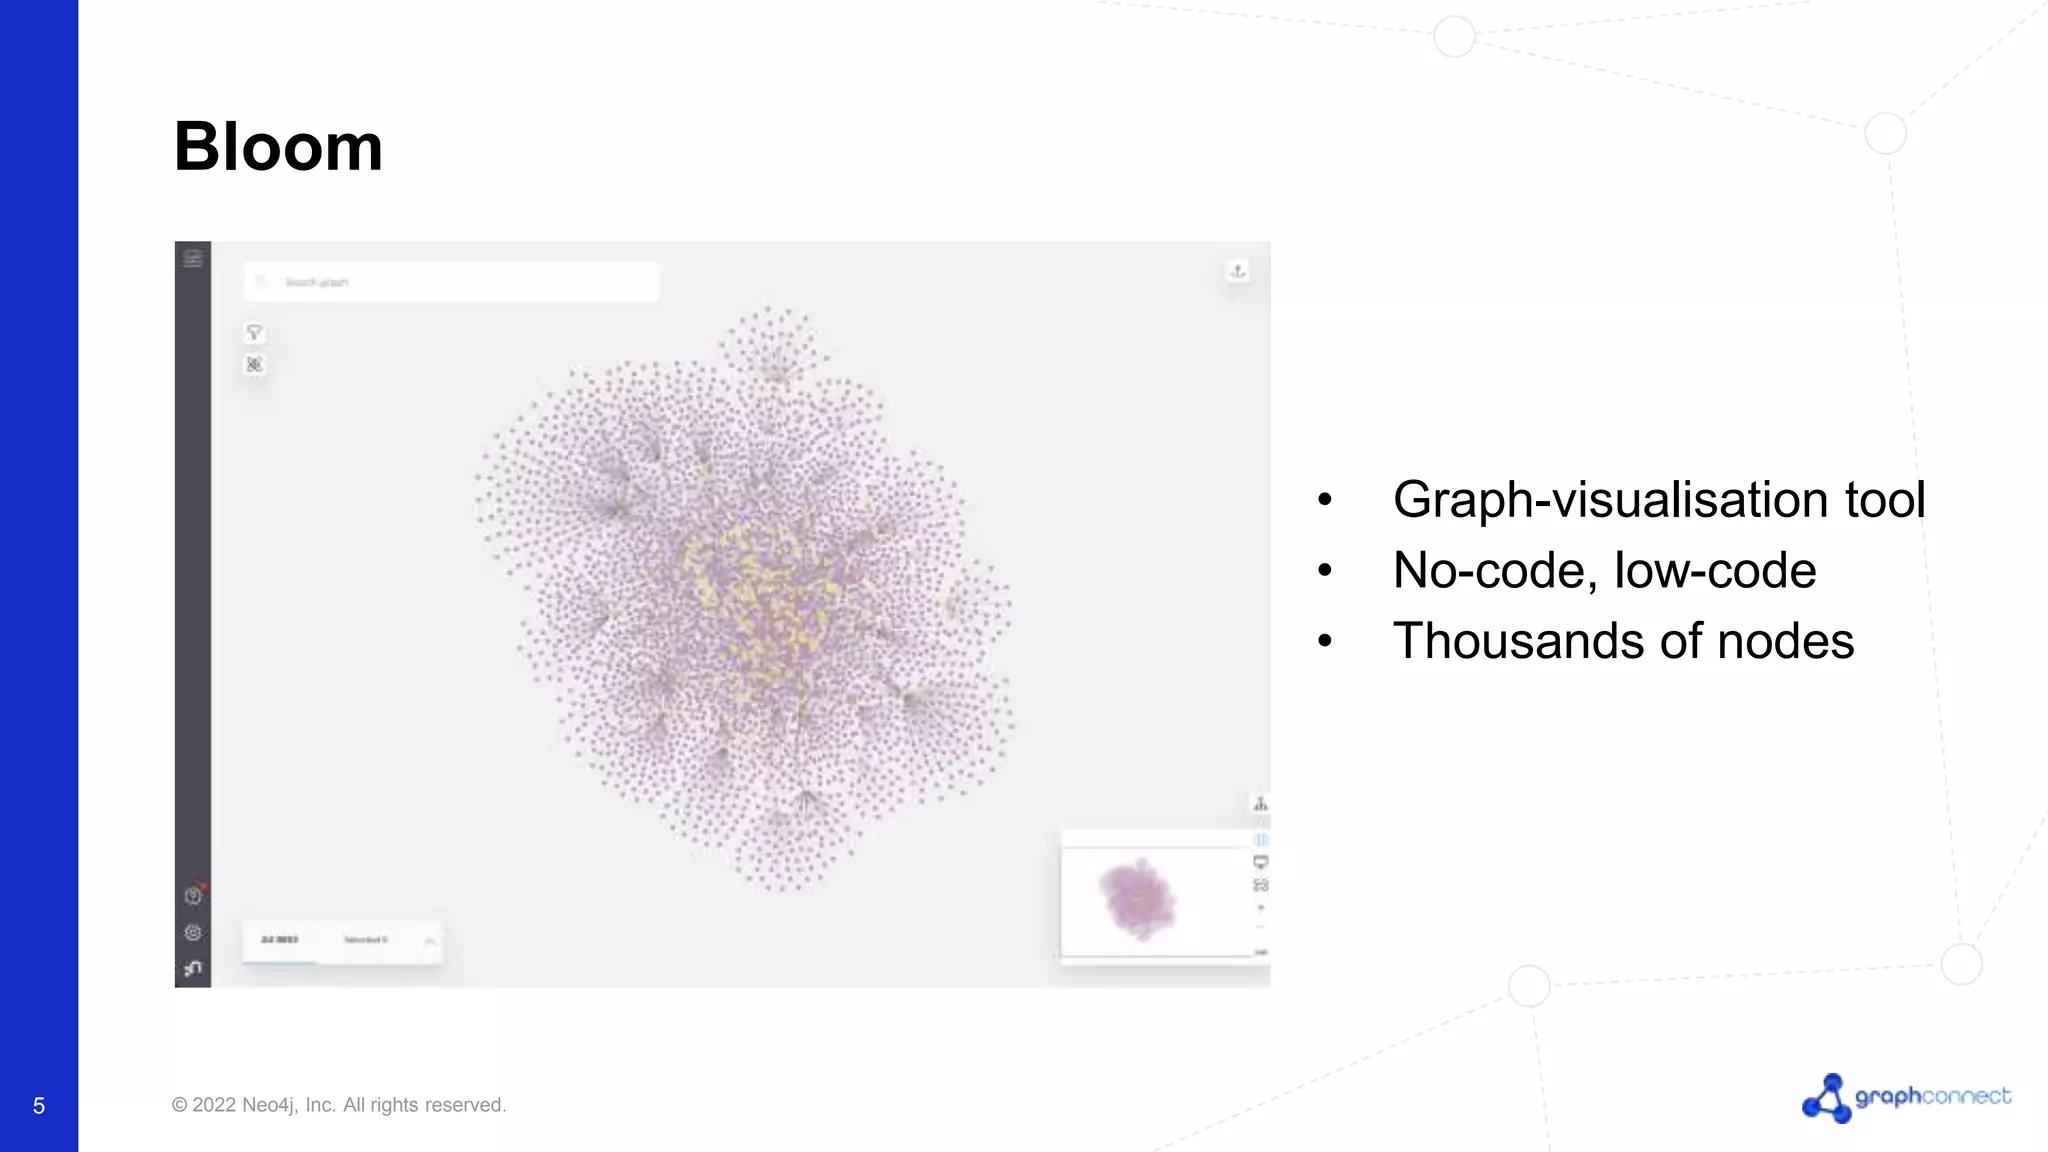
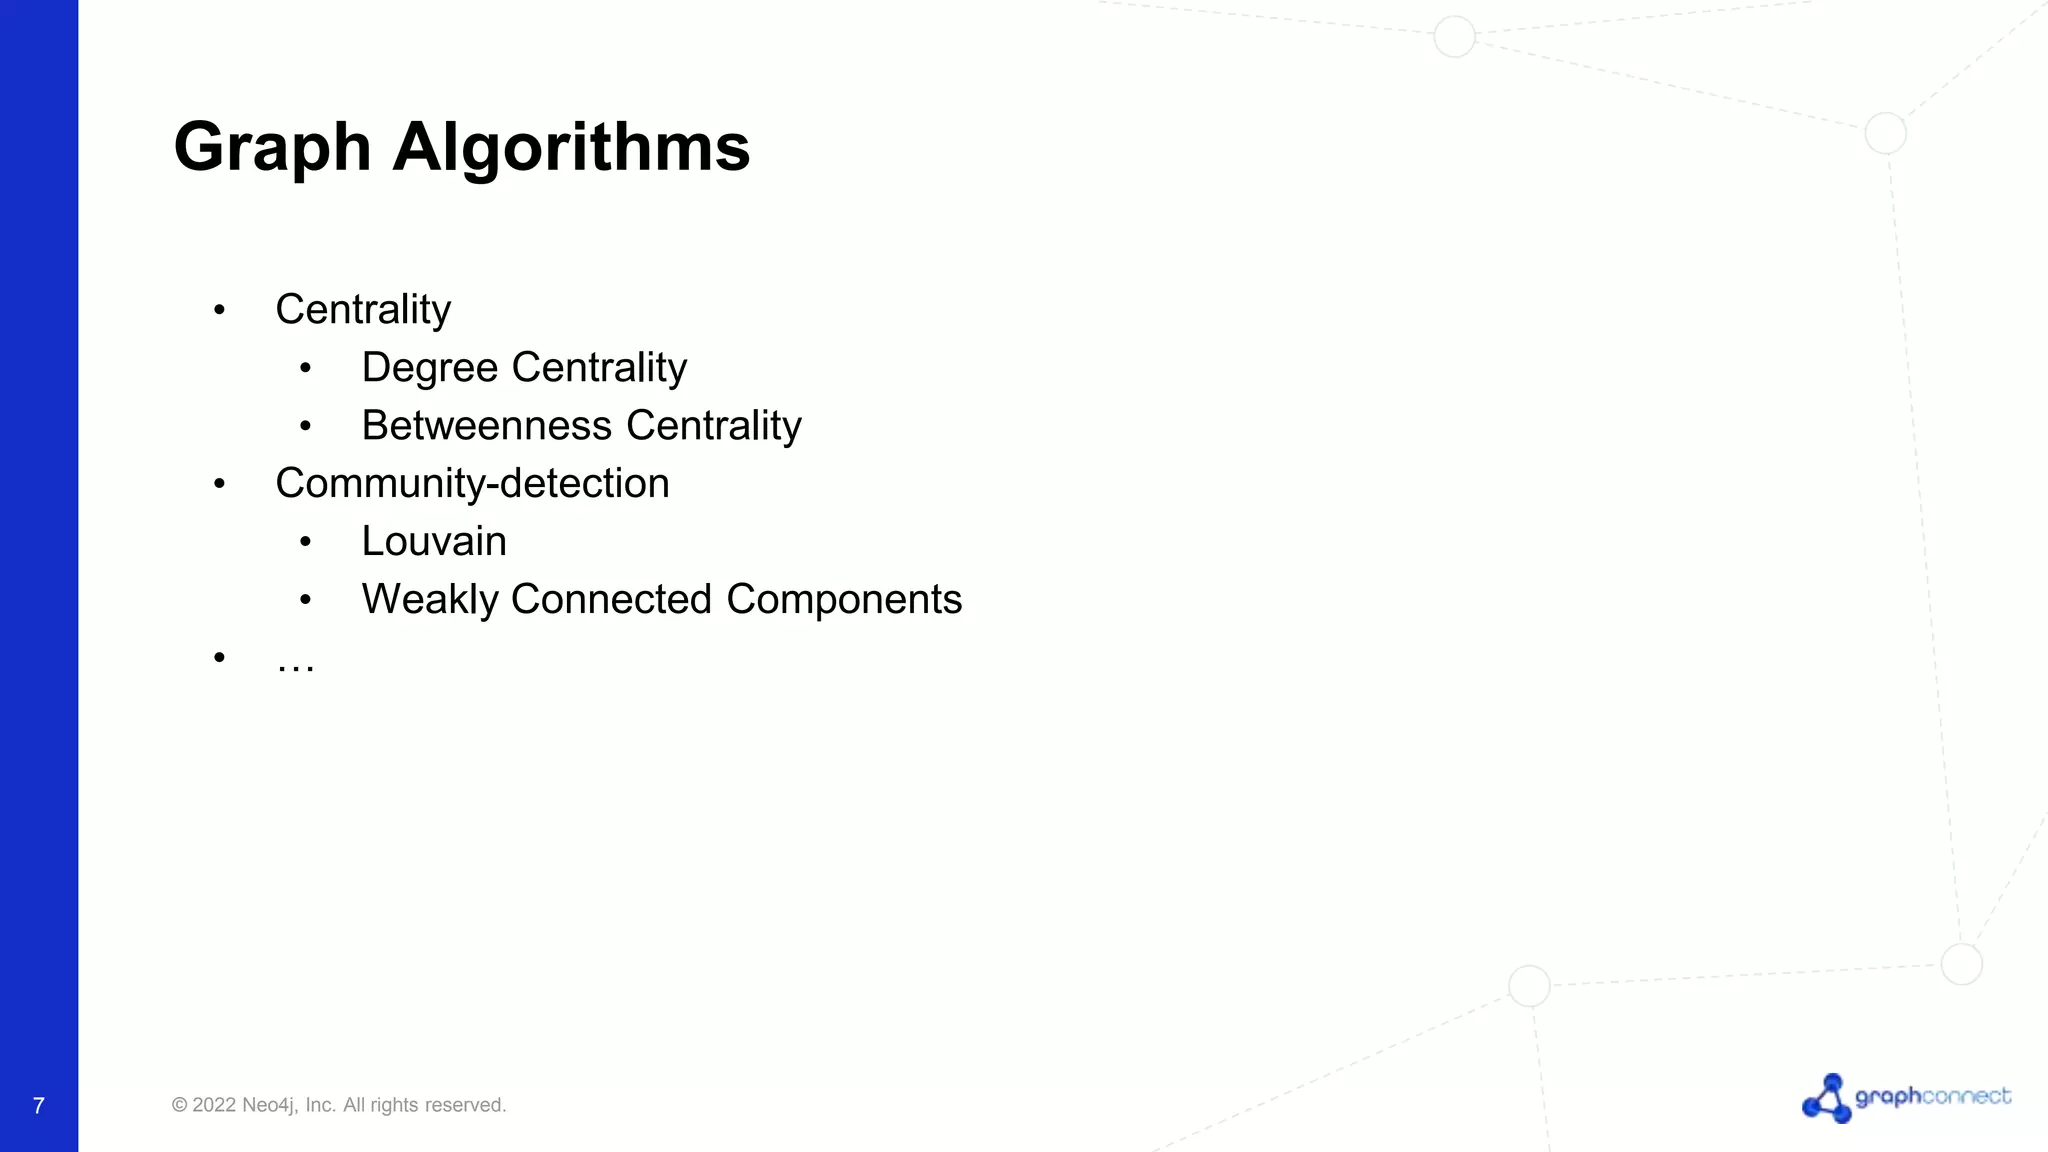
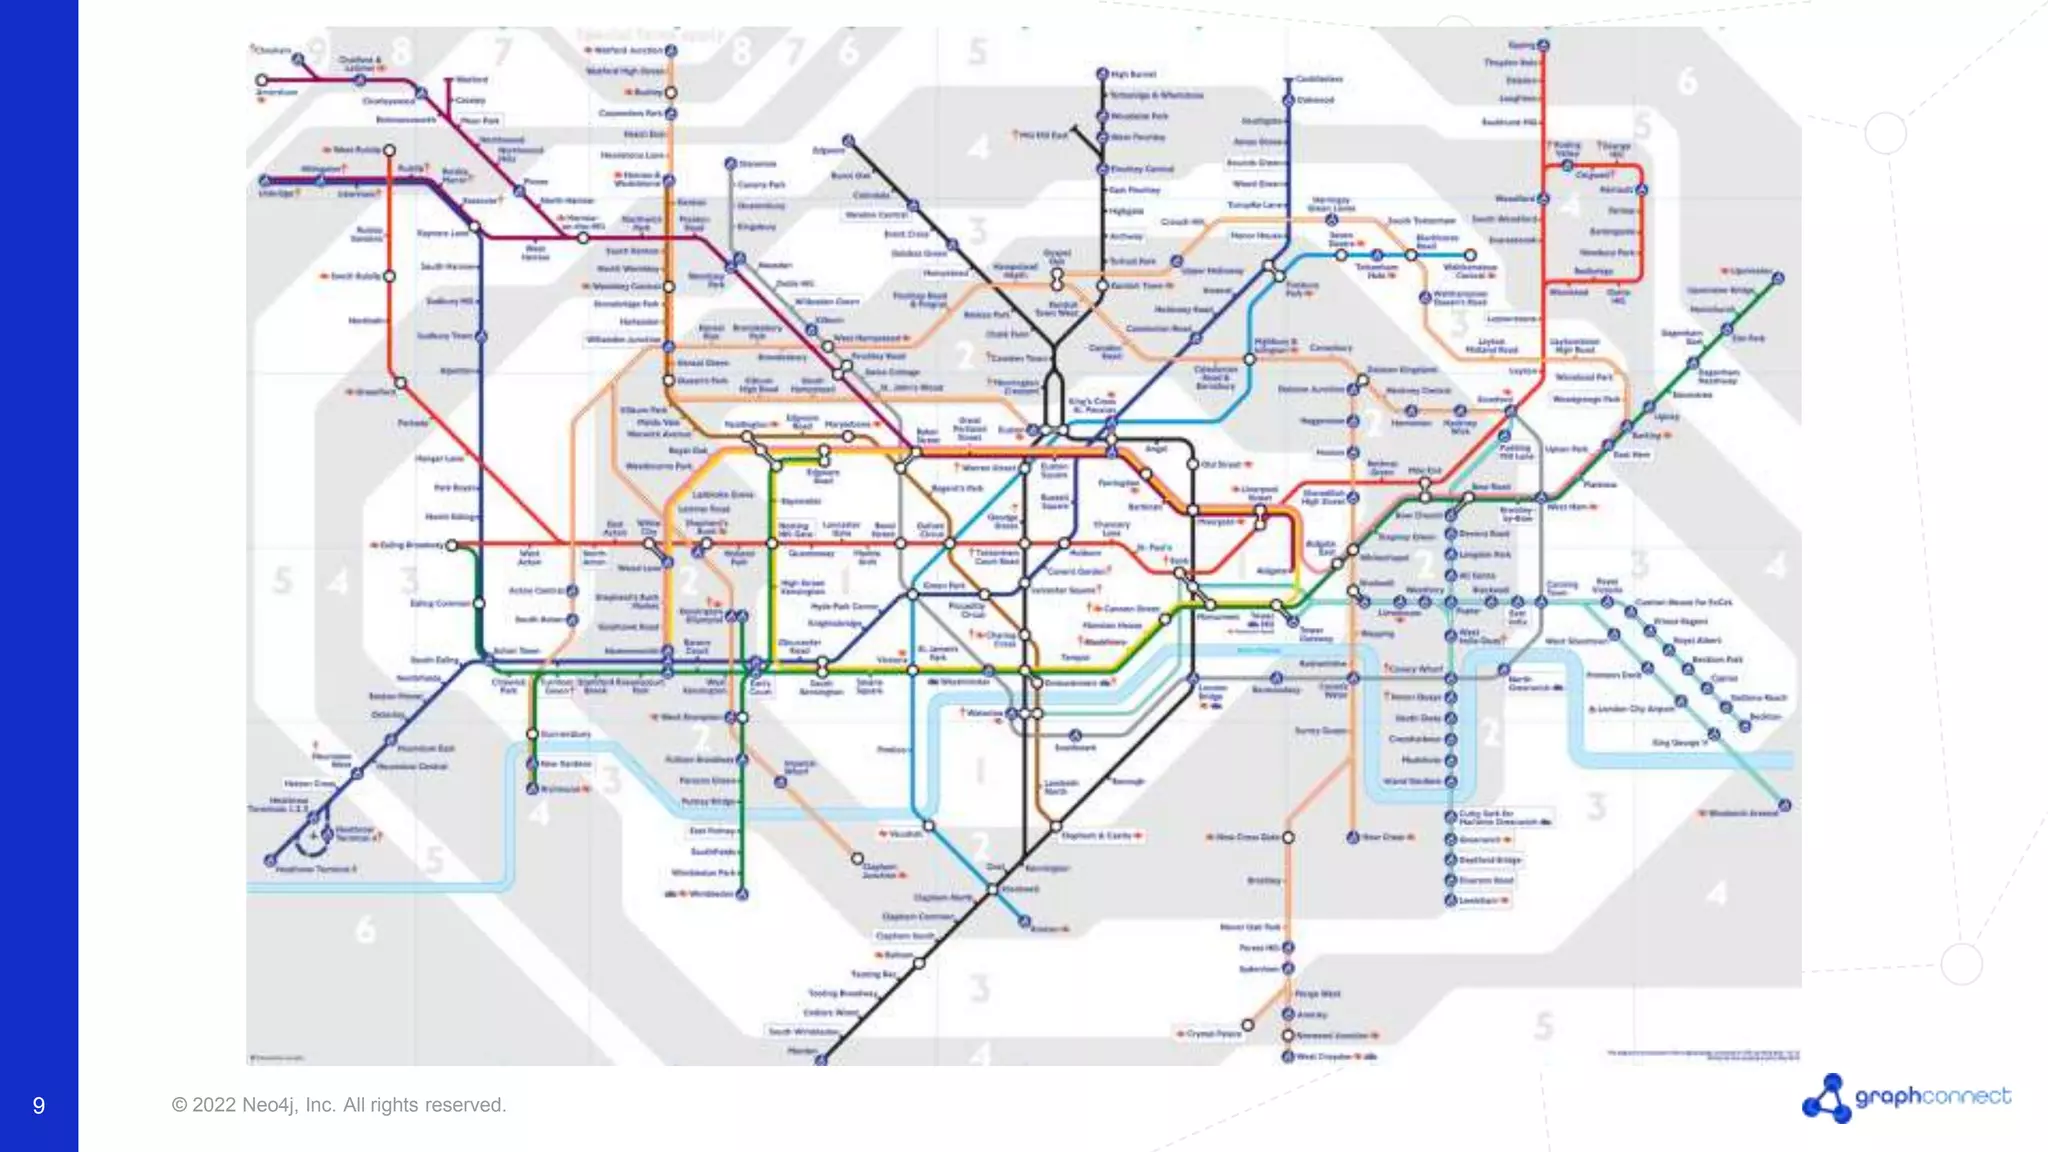
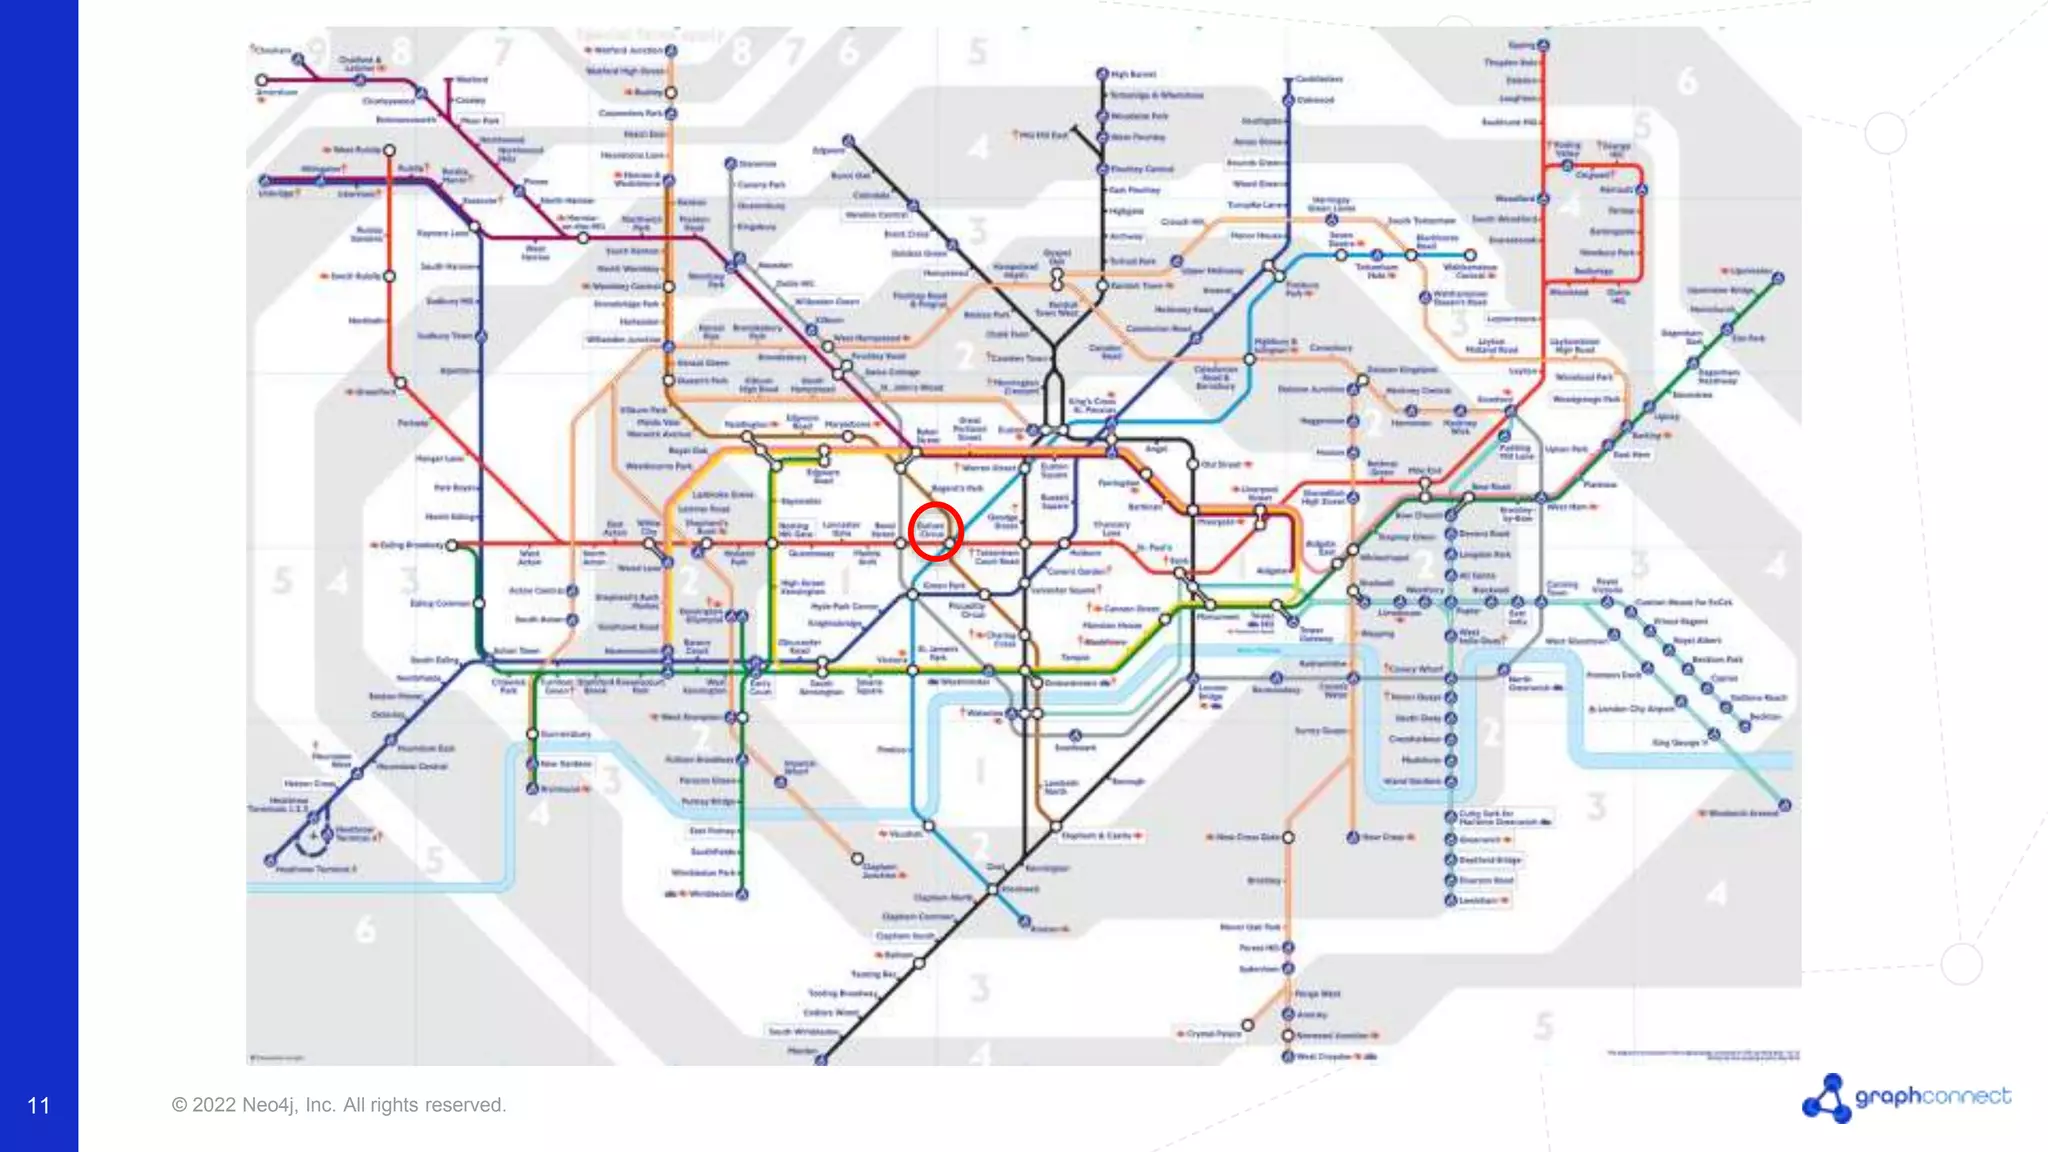
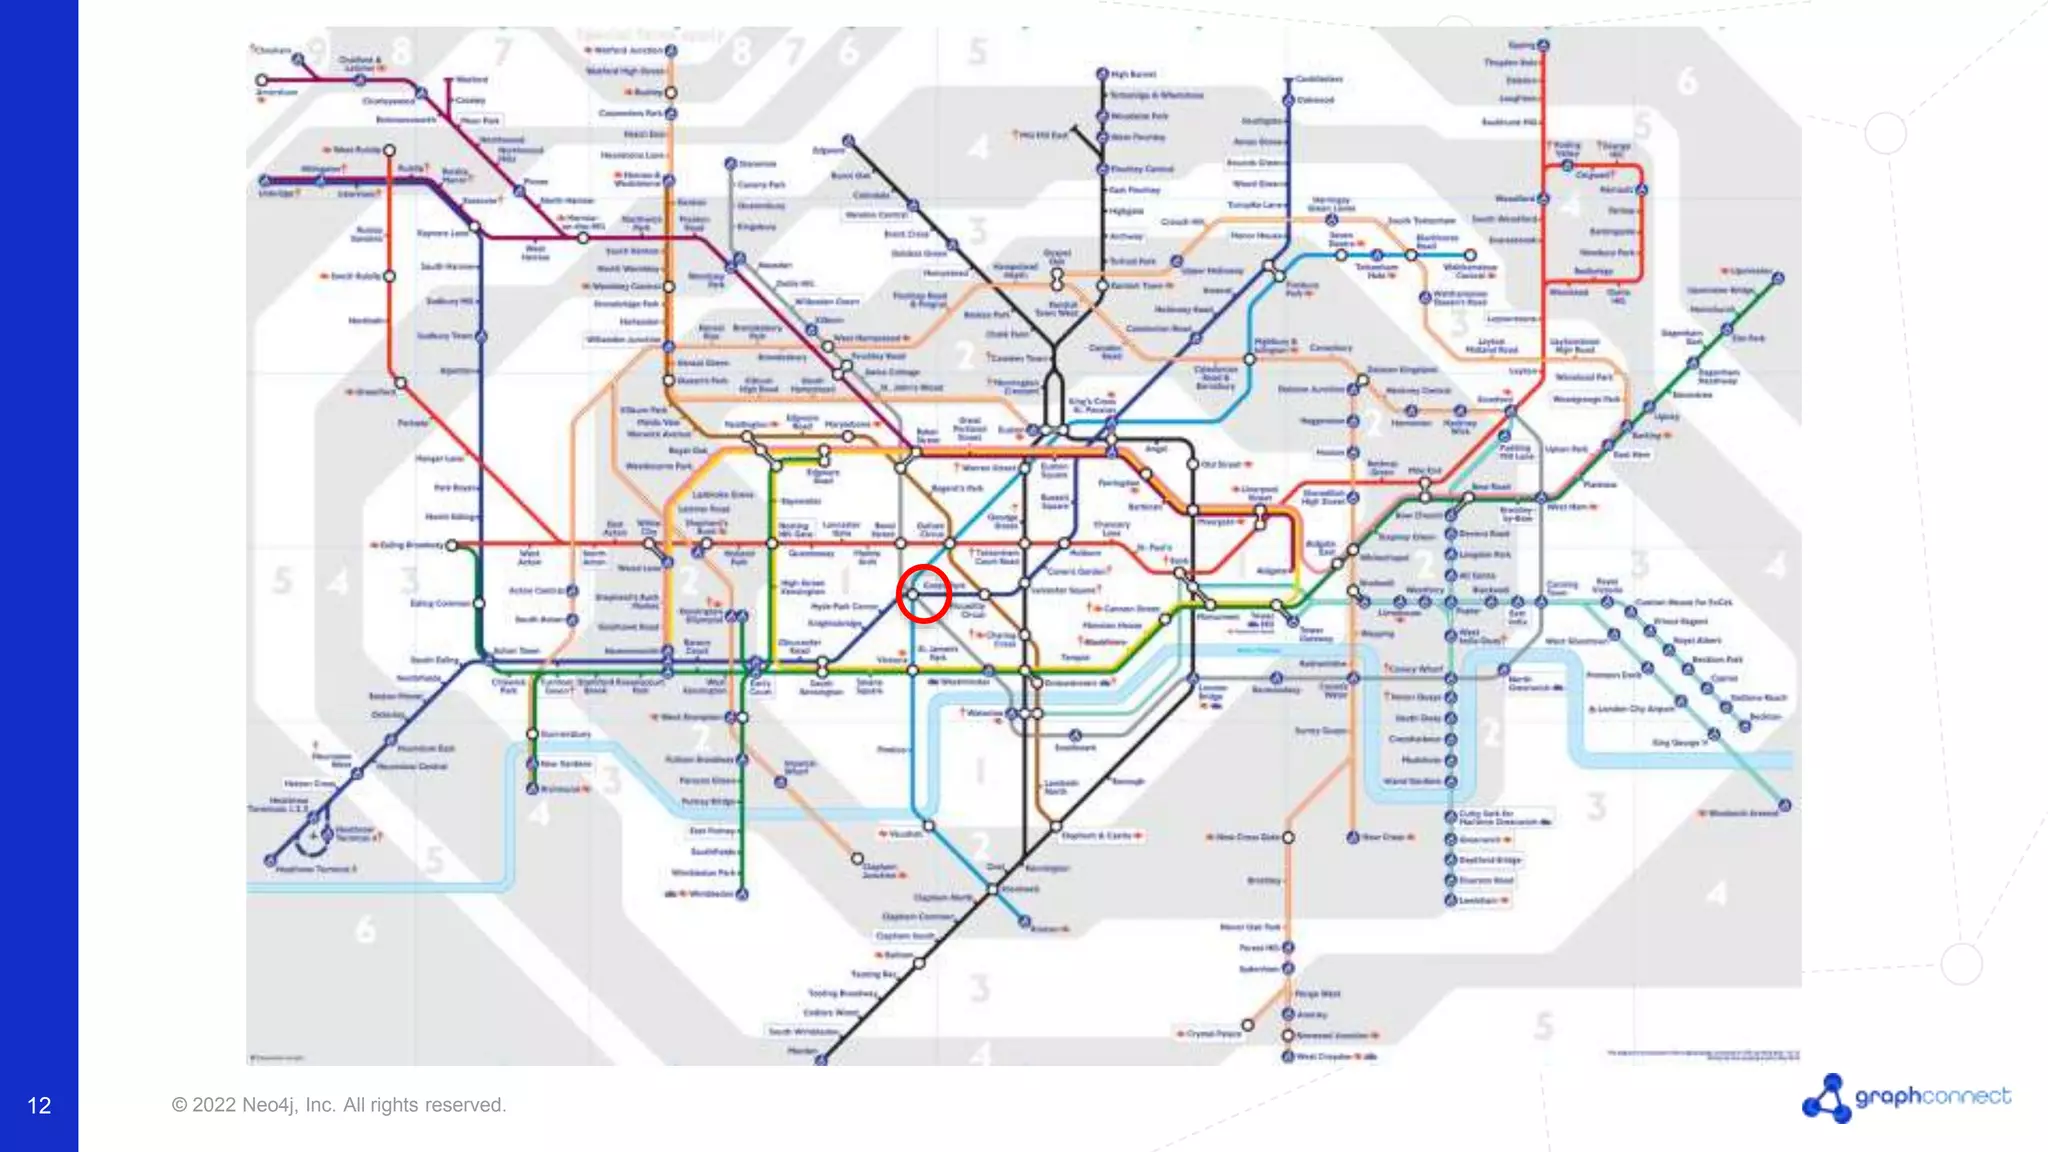
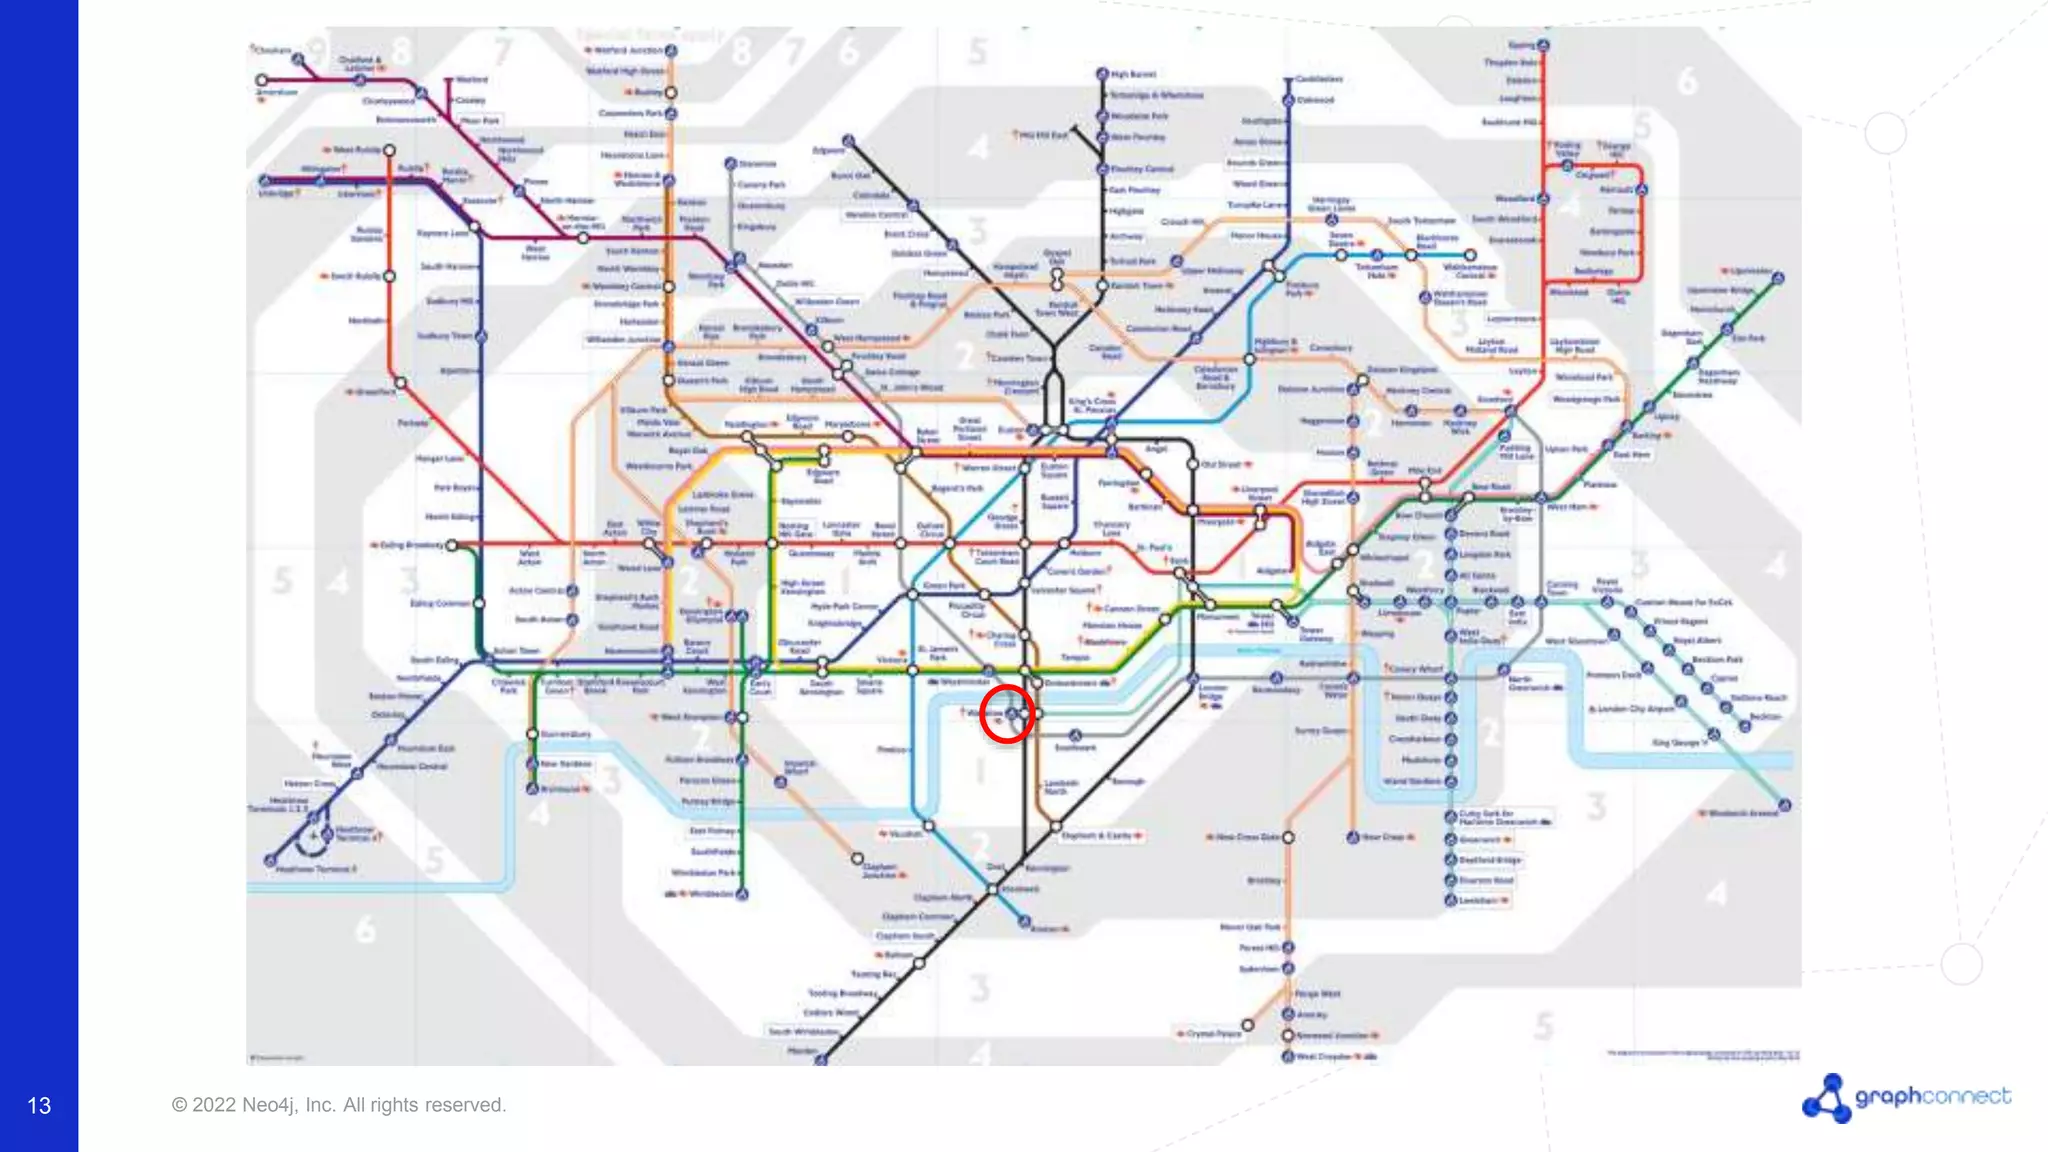
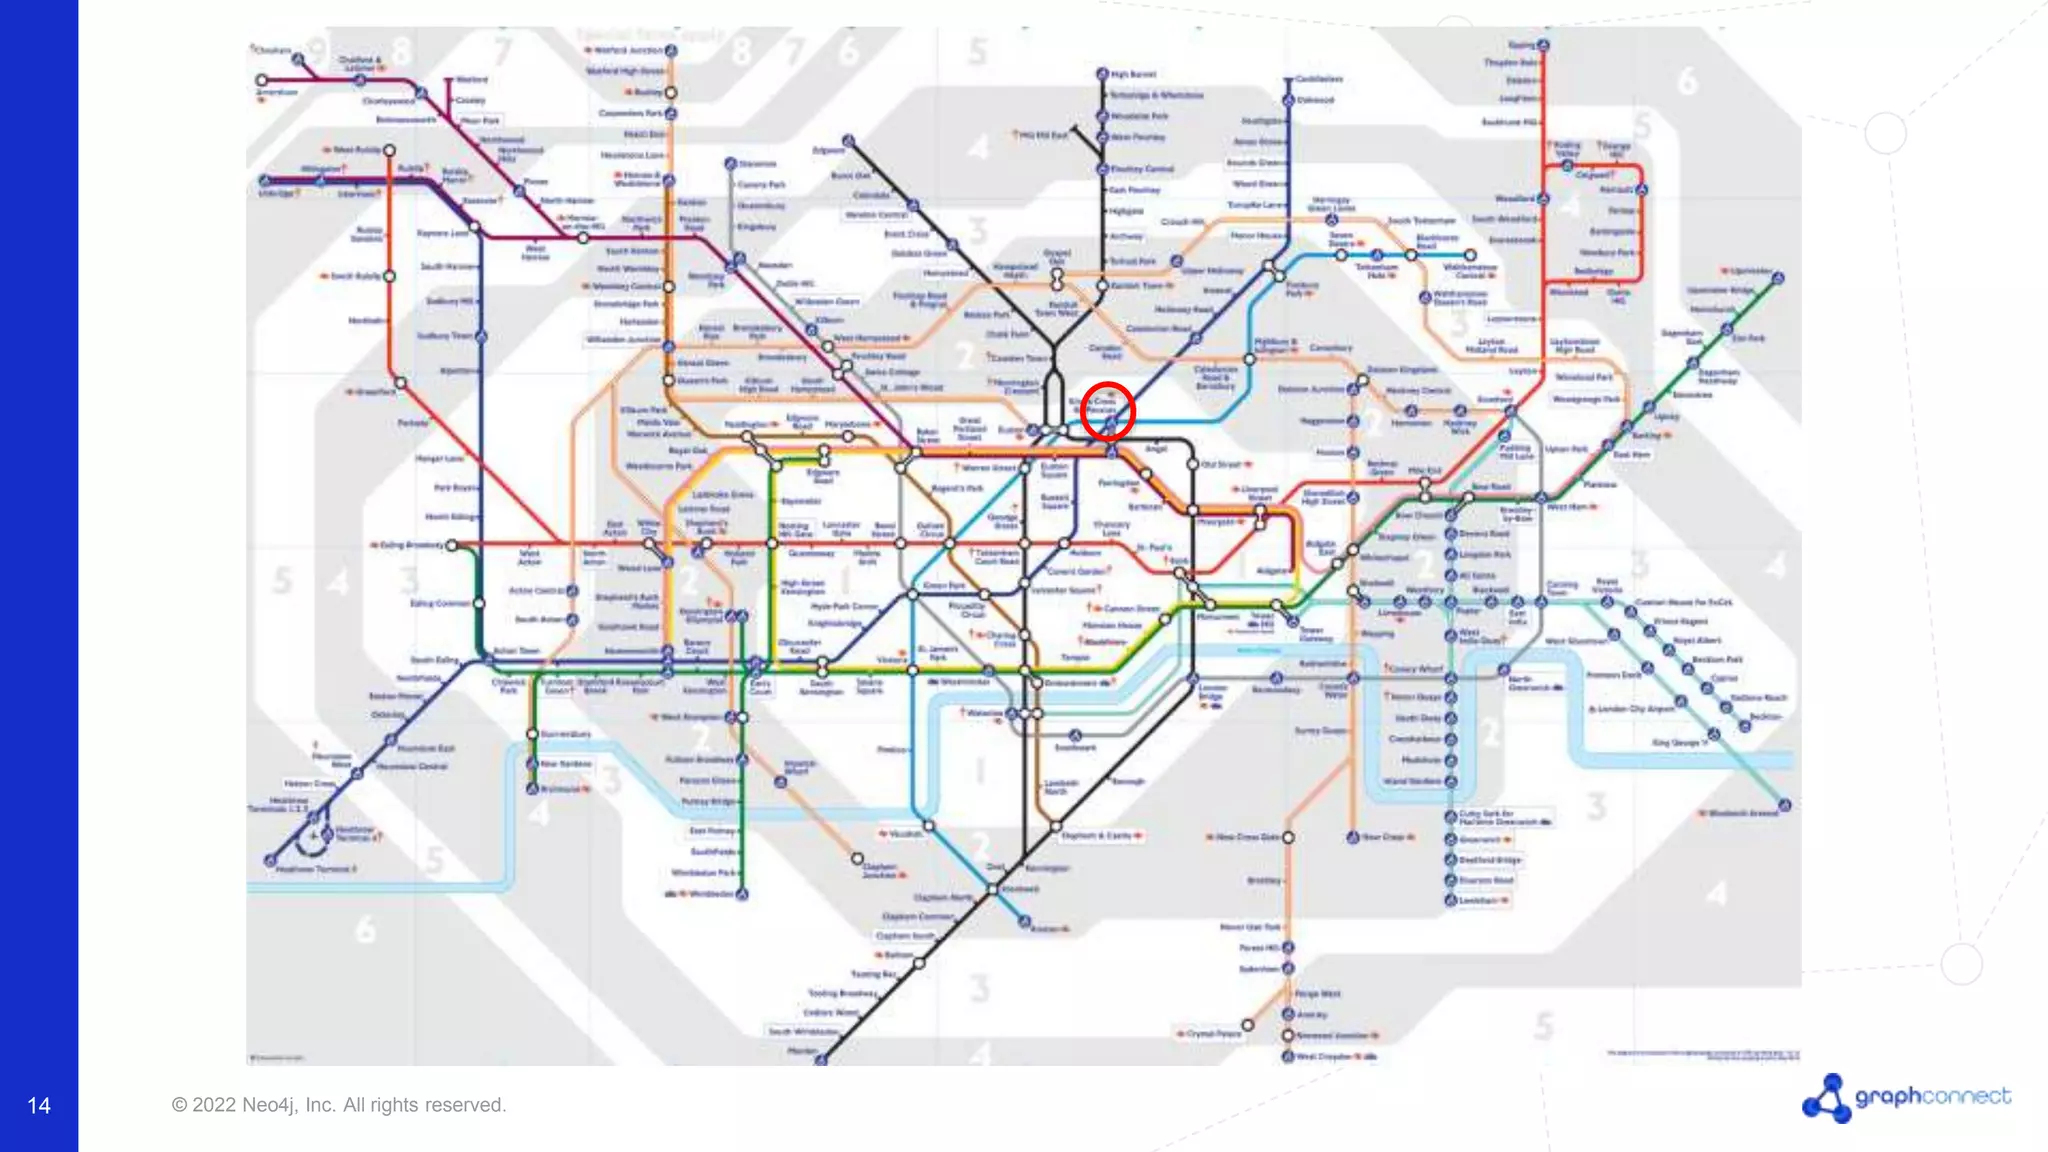
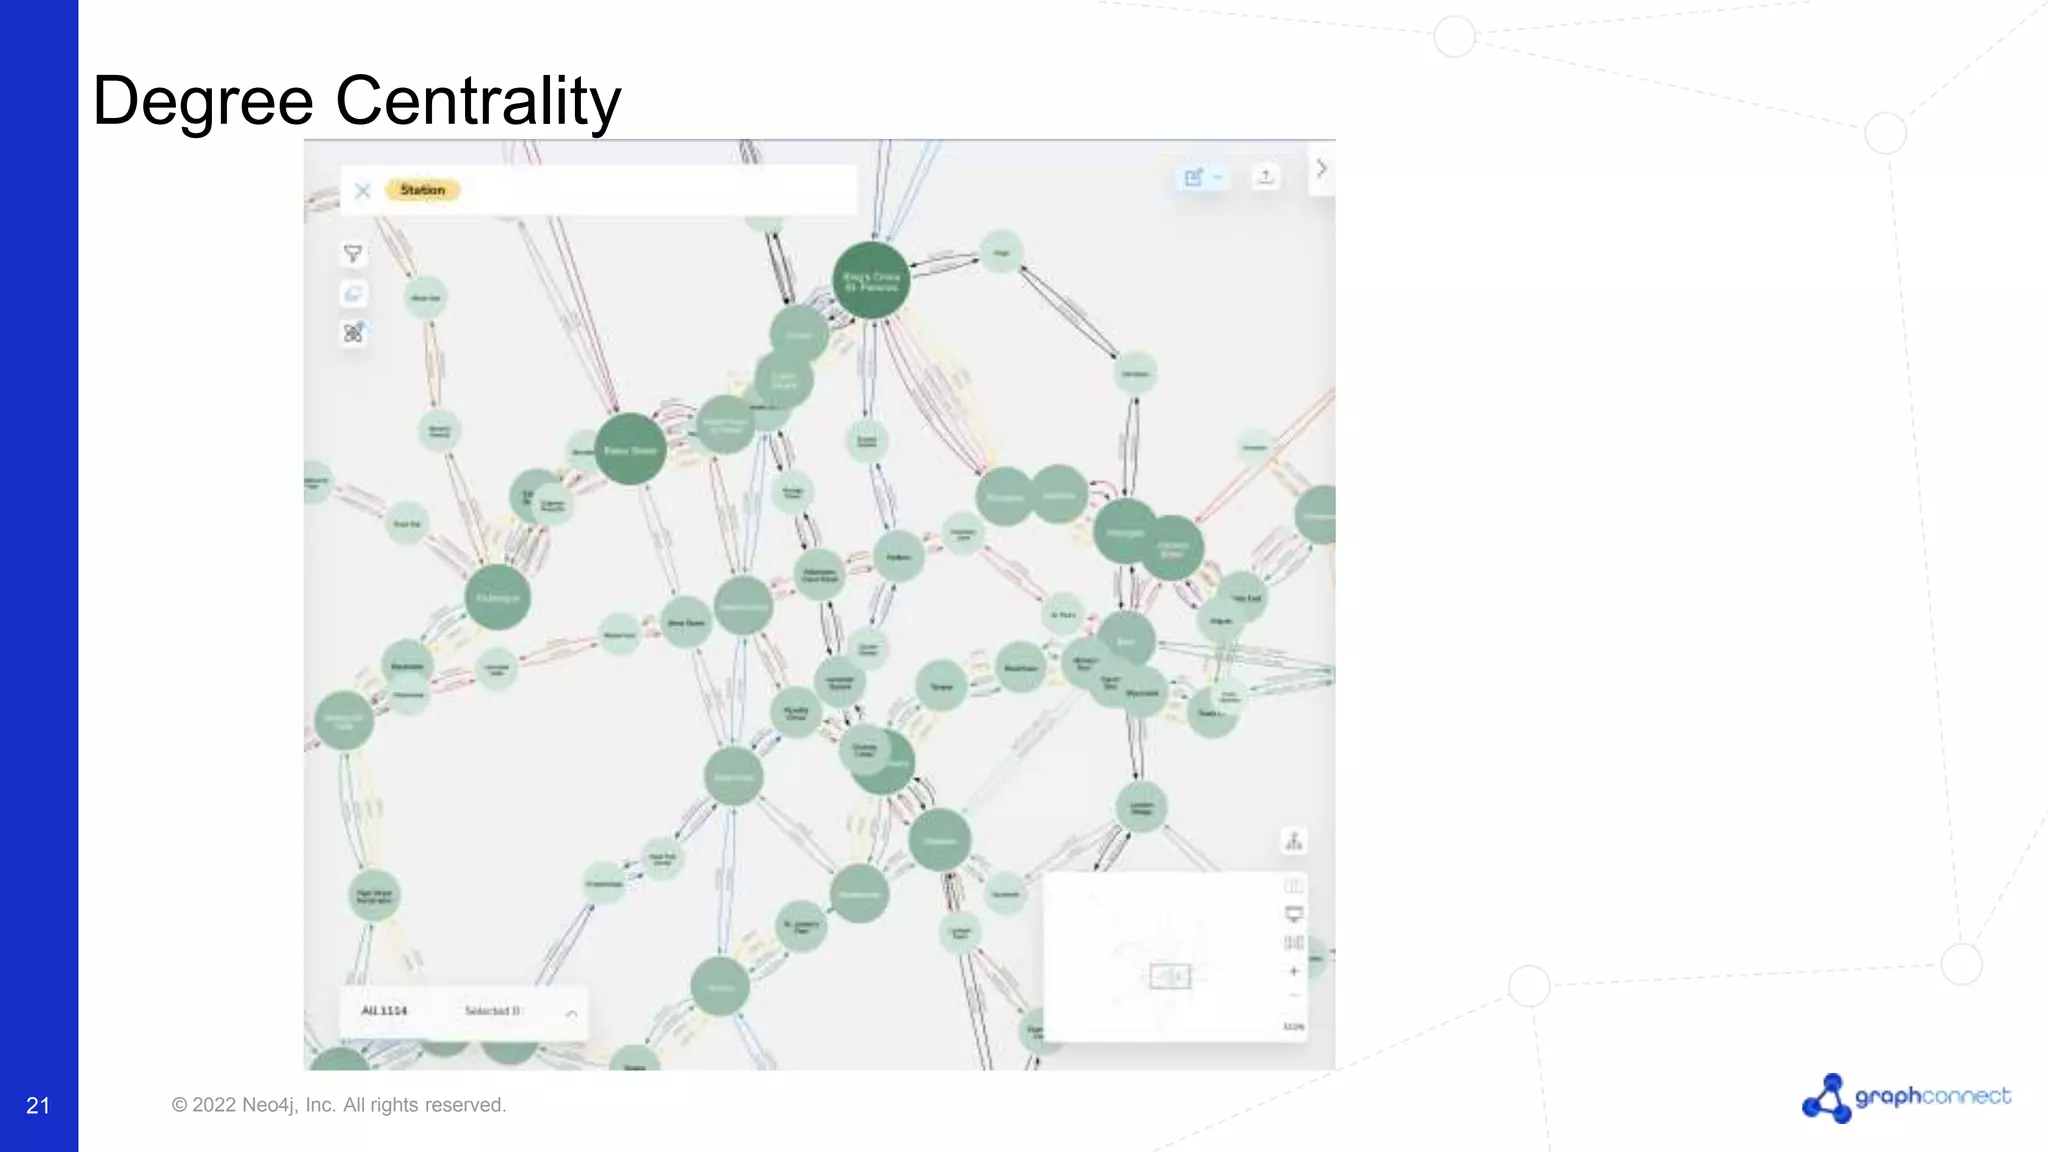
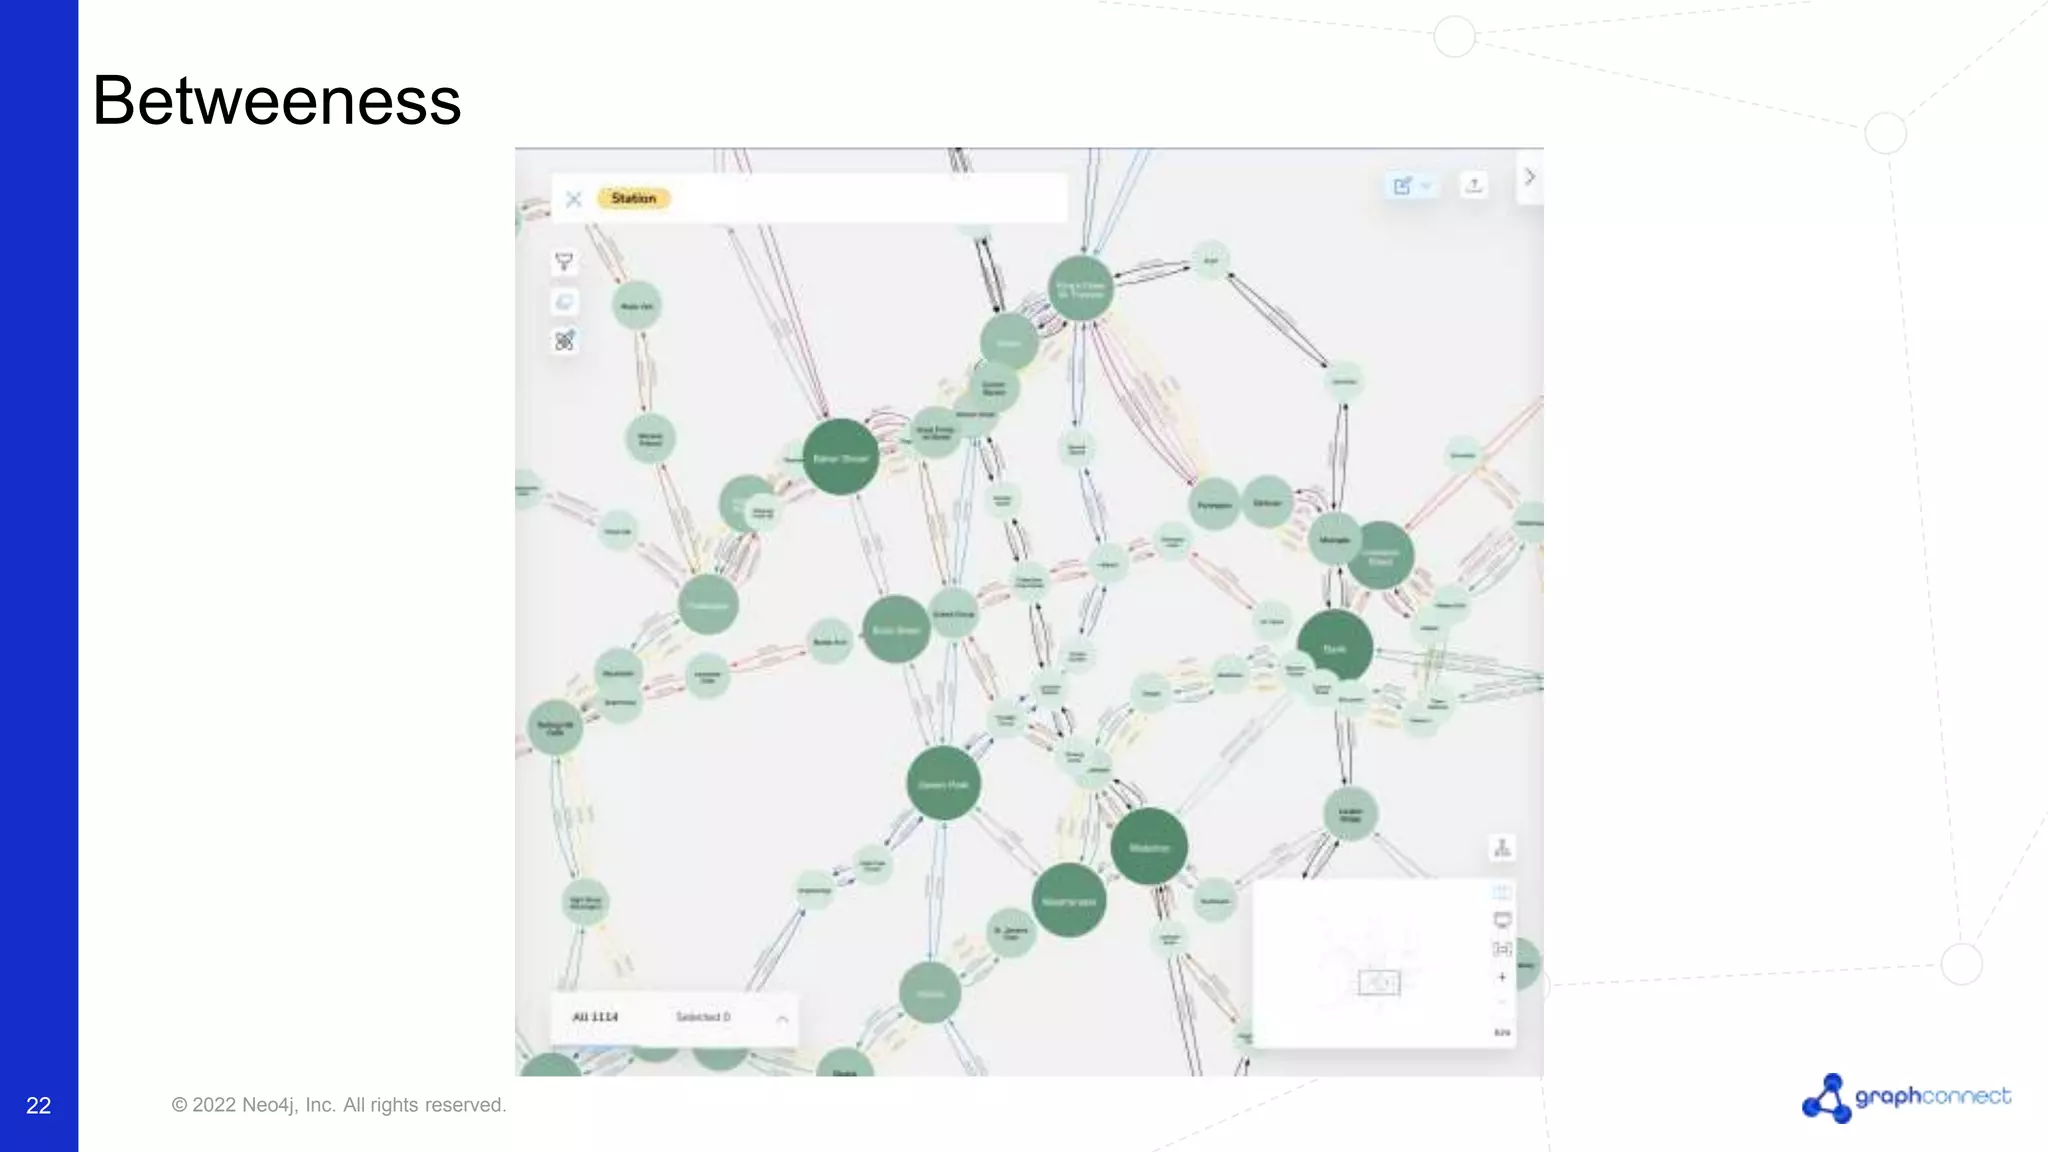
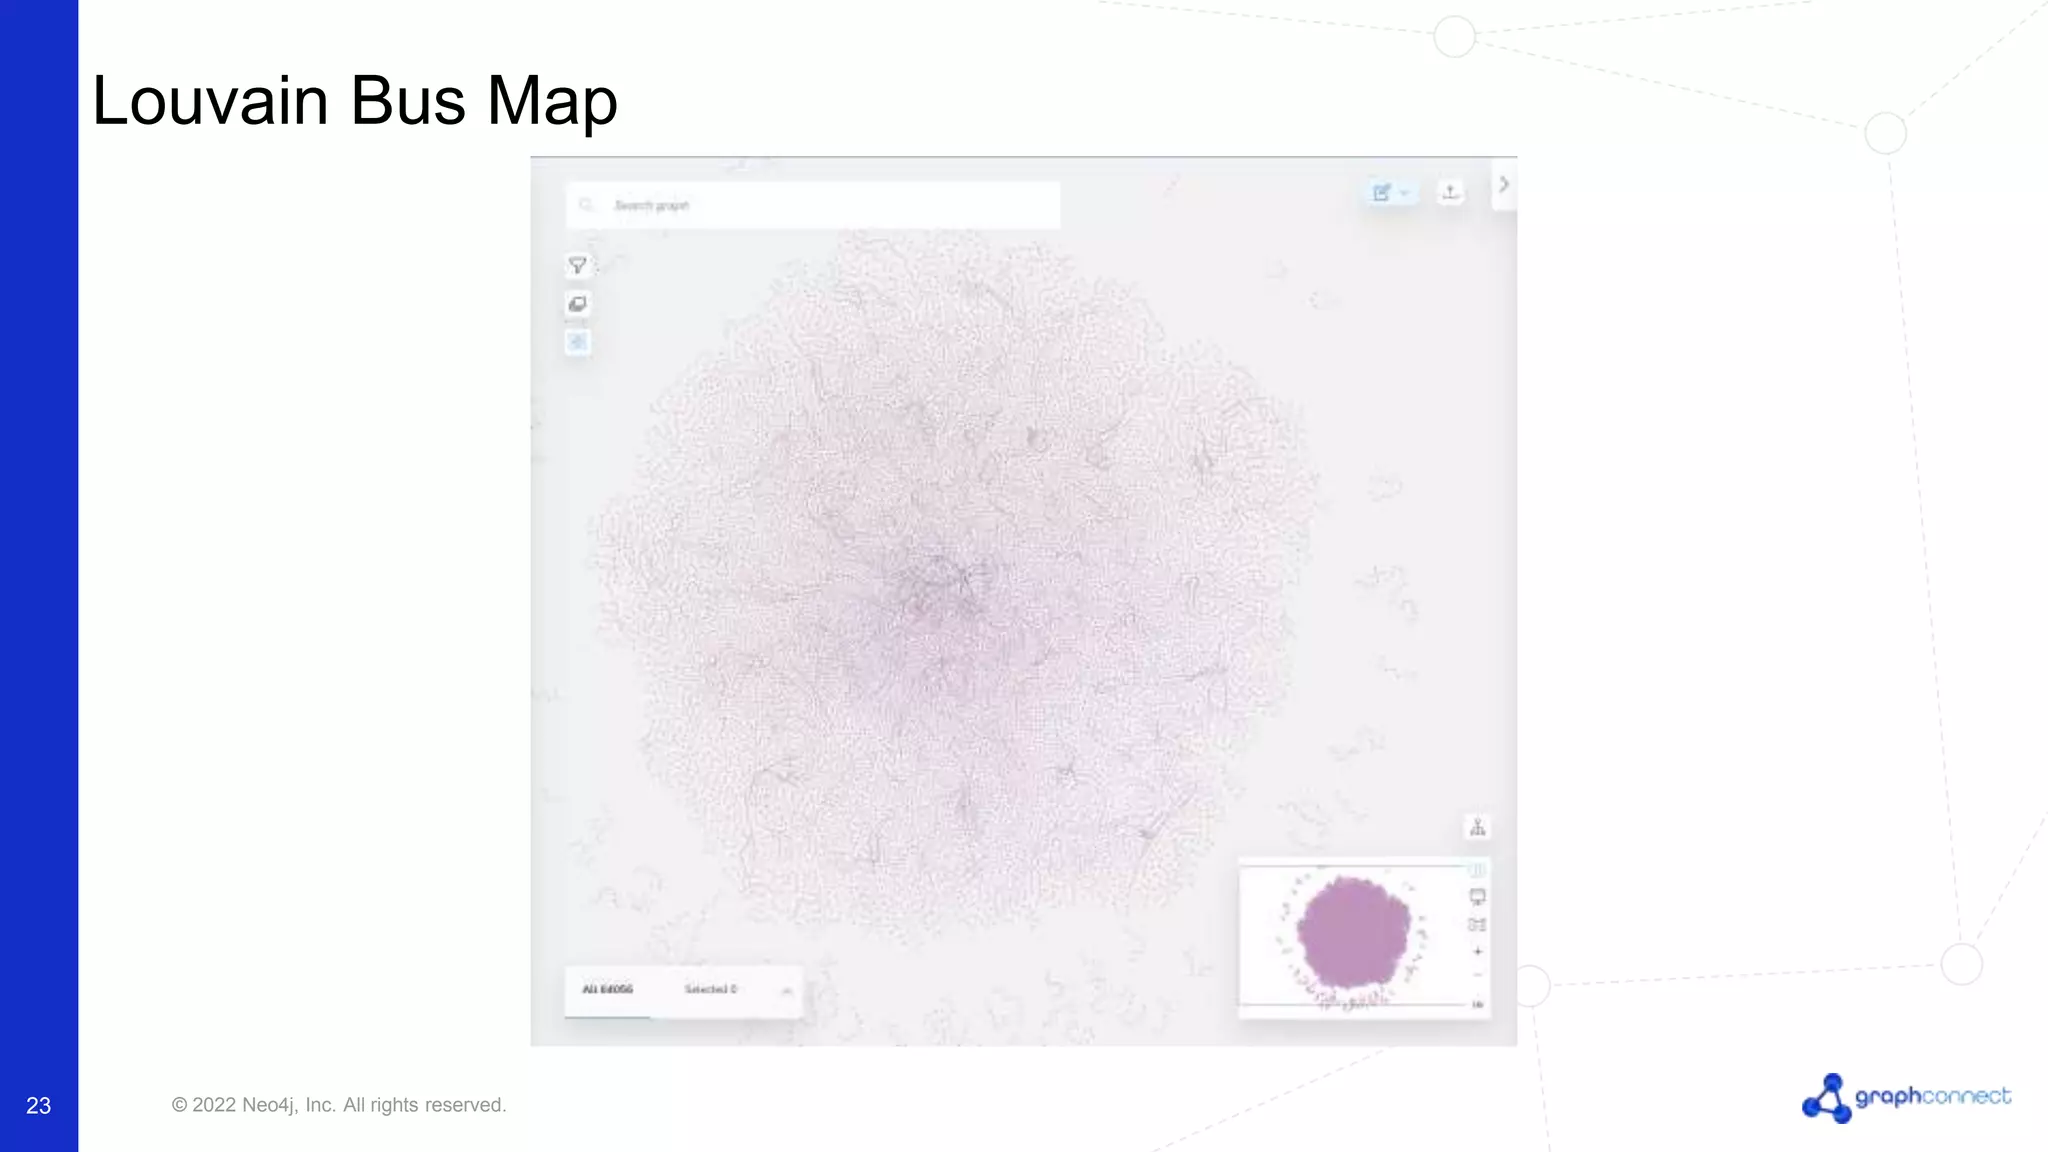
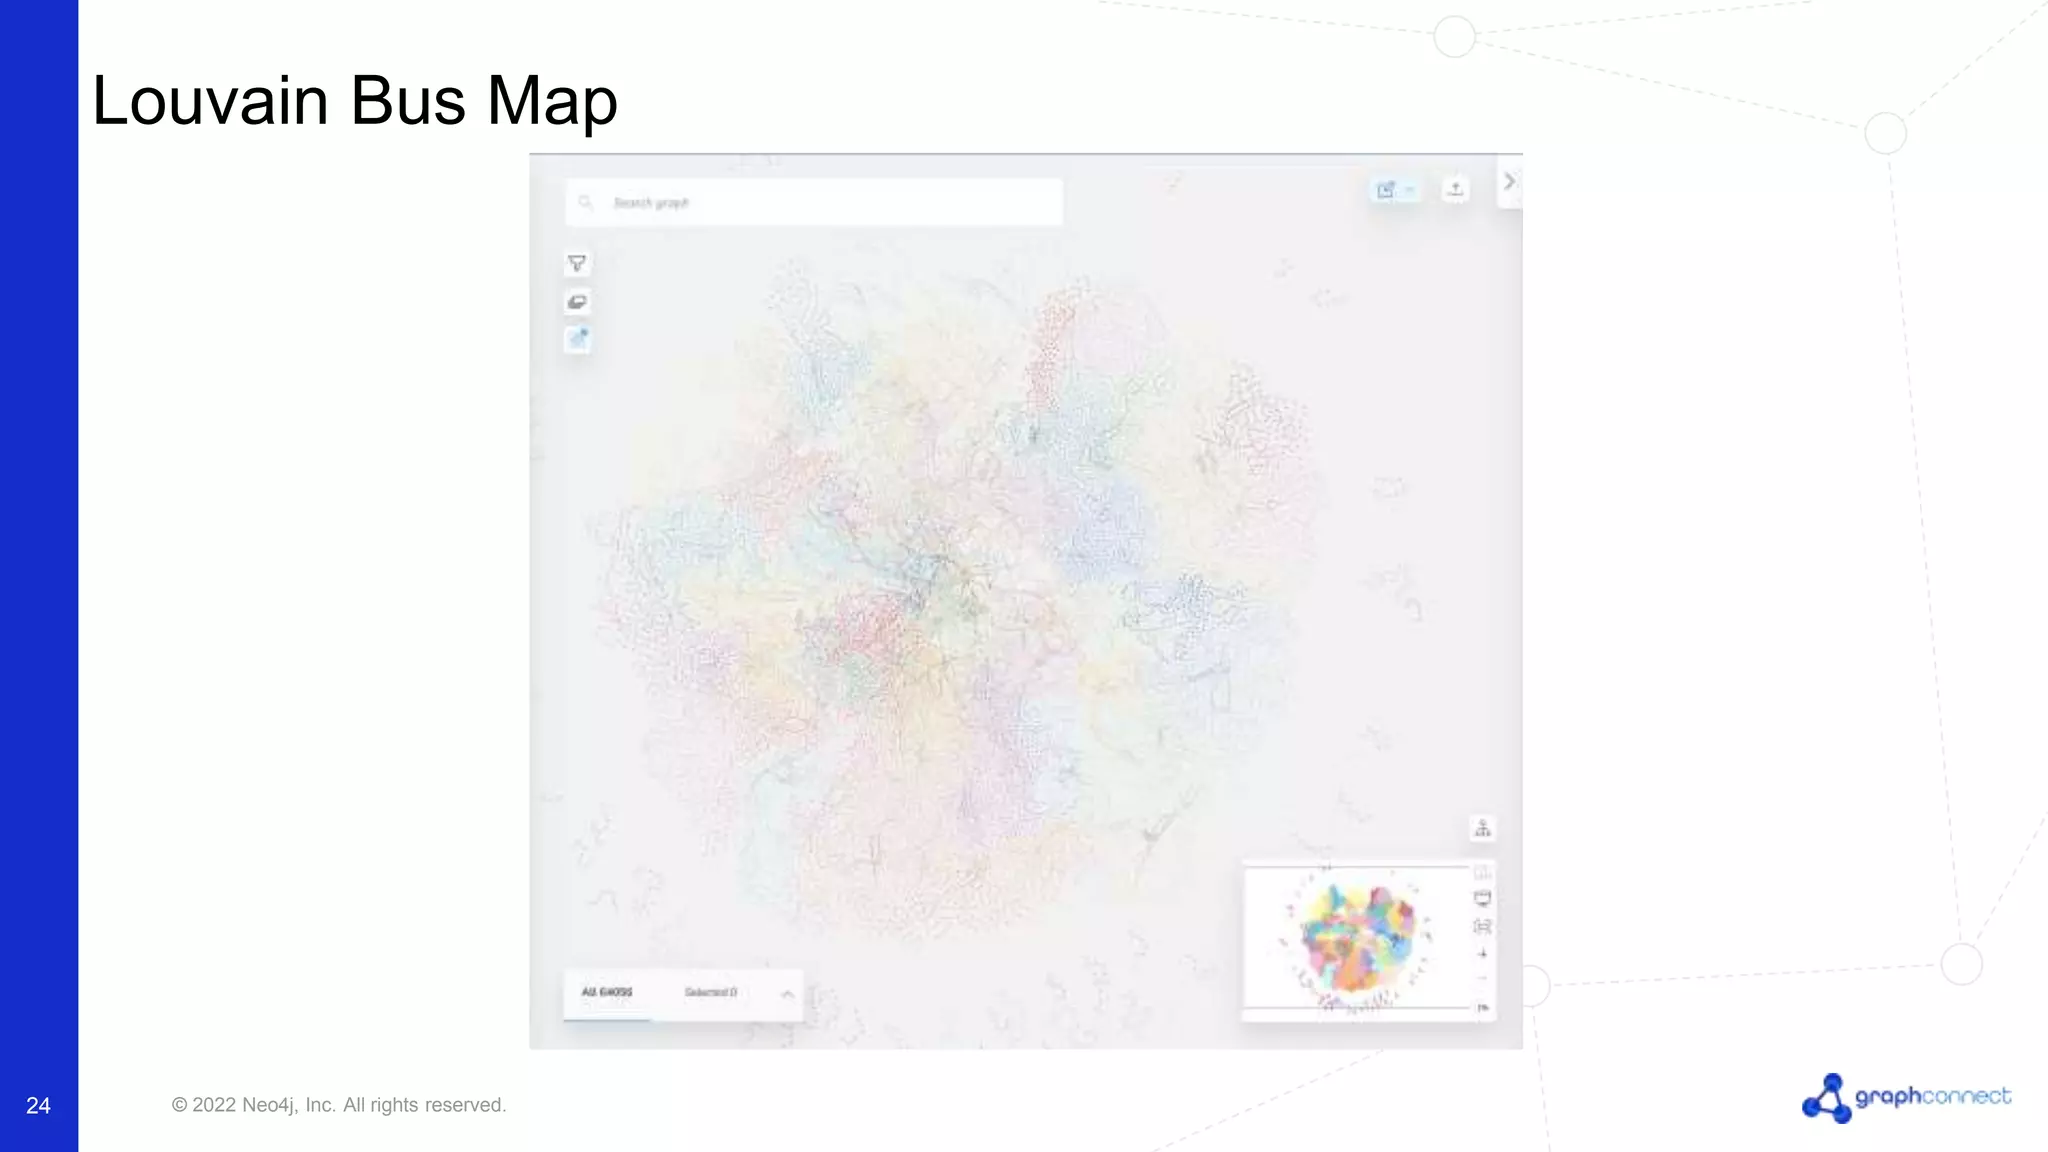
More Related Content
Similar to Visualizing Insights with Bloom and Graph Data Science.pptx (20)
Visualizing Insights with Bloom and Graph Data Science.pptx
- 1. © 2022 Neo4j, Inc. All rights reserved.
Visualising Insights With Bloom
and Graph Data Science
Yi Ren Sum
Software Engineer, Neo4j Bloom
- 2. © 2022 Neo4j, Inc. All rights reserved.
2
Introduction to Bloom and GDS
- 3. © 2022 Neo4j, Inc. All rights reserved.
Bloom
• Graph-visualisation tool
3
- 4. © 2022 Neo4j, Inc. All rights reserved.
Bloom
• Graph-visualisation tool
• No-code, low-code
4
- 5. © 2022 Neo4j, Inc. All rights reserved.
Bloom
• Graph-visualisation tool
• No-code, low-code
• Thousands of nodes
5
- 6. © 2022 Neo4j, Inc. All rights reserved.
Graph Data Science (GDS)
6
- 7. © 2022 Neo4j, Inc. All rights reserved.
Graph Algorithms
7
• Centrality
• Degree Centrality
• Betweenness Centrality
• Community-detection
• Louvain
• Weakly Connected Components
• …
- 10. © 2022 Neo4j, Inc. All rights reserved.
Which is the most important station in London?
10
- 16. © 2022 Neo4j, Inc. All rights reserved.
It depends…on what you define as ‘important’
16
- 17. © 2022 Neo4j, Inc. All rights reserved.
Find the answer, using Bloom and GDS
17
- 18. © 2022 Neo4j, Inc. All rights reserved.
Released in v2.3.0 of Bloom
18
- 19. © 2022 Neo4j, Inc. All rights reserved.
19
Thank you!
Connect:
yi-ren.sum@neo4j.com
https://linkedin.com/in/sumyiren/
- 20. © 2022 Neo4j, Inc. All rights reserved.
20
Some screenshots
Connect:
yi-ren.sum@neo4j.com
https://linkedin.com/in/sumyiren/