


Statistics on Carpet and Rug
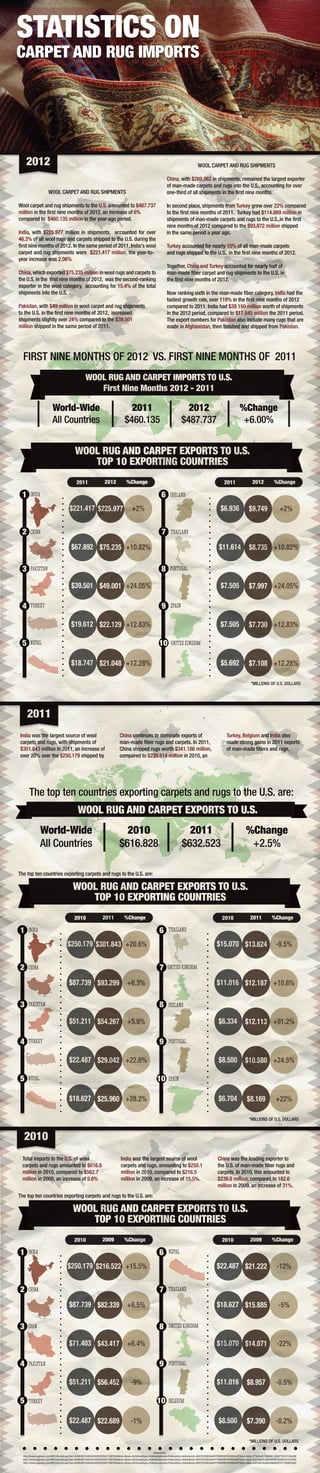
- 1. STATISTICS ON CARPET ANDRUG IMPORTS India was the largest source of wool carpets and rugs, with shipments of $301.843 million in 2011, an increase of over 20% over the $250.179 shipped by China continues to dominate exports of man-made fiber rugs and carpets. In 2011, China shipped rugs worth $341.186 million, compared to $239.814 million in 2010, an Turkey, Belgium and India also made strong gains in 2011 exports of man-made fibers and rugs. 2011 The top ten countries exporting carpets and rugs to the U.S. are: World-Wide All Countries 2010 $616.828 2011 $632.523 %Change +2.5% WOOL RUG AND CARPET EXPORTS TO U.S. References: http://www.rugnews.com/ME2/dirmod.asp?sid=0DAB59D70A93452A92E82D8312BEFBAA&nm=News+Archives&type=Publishing&mod=Publications::Article&mid=B057D339E04A4FFF99DB9FEEB9BDA02F&tier=4&id=F73A548C7DB64417AB8F7E61B7356296 http://www.rugnews.com/ME2/dirmod.asp?sid=0DAB59D70A93452A92E82D8312BEFBAA&nm=News+Archives&type=Publishing&mod=Publications::Article&mid=B057D339E04A4FFF99DB9FEEB9BDA02F&tier=4&id=B33786A9156D4AC9BCE666F2CCE7545E http://www.rugnews.com/ME2/dirmod.asp?sid=0DAB59D70A93452A92E82D8312BEFBAA&nm=News+Archives&type=Publishing&mod=Publications::Article&mid=B057D339E04A4FFF99DB9FEEB9BDA02F&tier=4&id=40FCB87A5AA549688EBF4773936C3A00 Total imports to the U.S. of wool carpets and rugs amounted to $616.8 million in 2010, compared to $562.7 million in 2009, an increase of 9.6% India was the largest source of wool carpets and rugs, amounting to $250.1 million in 2010, compared to $216.5 million in 2009, an increase of 15.5%. China was the leading exporter to the U.S. of man-made fiber rugs and carpets. In 2010, this amounted to $239.8 million, compared to 182.6 million in 2009, an increase of 31%. 2010 WOOL RUG AND CARPET EXPORTS TO U.S. TOP 10 EXPORTING COUNTRIES The top ten countries exporting carpets and rugs to the U.S. are: 2010 2009 %Change *MILLIONS OF U.S. DOLLARS 1 2 3 4 5 6 7 8 9 10 INDIA CHINA IRAN PAKISTAN TURKEY NEPAL THAILAND UNITED KINGDOM PORTUGAL BELGIUM $250.179 $87.739 $71.403 $51.211 $22.487 $216.522 $82.339 $43.417 $56.452 $22.689 +15.5% +6.5% +6.4% -9% -1% 2010 2009 %Change $22.487 $18.627 $15.070 $11.016 $8.500 $21.222 $15.885 $14.071 $8.957 $7.390 -12% -5% -22% -0.5% -0.2% WOOL RUG AND CARPET EXPORTS TO U.S. TOP 10 EXPORTING COUNTRIES The top ten countries exporting carpets and rugs to the U.S. are: 2010 2011 %Change *MILLIONS OF U.S. DOLLARS 1 2 3 4 5 6 7 8 9 10 INDIA CHINA NEPAL PAKISTAN TURKEY THAILAND UNITED KINGDOM PORTUGAL SPAIN IRELAND $250.179 $87.739 $51.211 $22.487 $18.627 $301.843 $93.299 $54.267 $29.042 $25.960 +20.6% +6.3% +5.9% +22.6% +28.2% 2010 2011 %Change $15.070 $11.016 $6.334 $8.500 $6.704 $13.624 $12.187 $12.113 $10.580 $8.169 -9.5% +10.6% +91.2% +24.5% +22% WOOL CARPET AND RUG SHIPMENTS Wool carpet and rug shipments to the U.S. amounted to $487.737 million in the first nine months of 2012, an increase of 6% compared to $460.135 million in the year-ago period. India, with $225.977 million in shipments, accounted for over 46.3% of all wool rugs and carpets shipped to the U.S. during the first nine months of 2012. In the same period of 2011,India's wool carpet and rug shipments were $221.417 million, the year-to- year increase was 2.06% China,which exported $75.235 million in wool rugs and carpets to the U.S. in the first nine months of 2012, was the second-ranking exporter in the wool category, accounting for 15.4% of the total shipments into the U.S. Pakistan, with $49 million in wool carpet and rug shipments to the U.S. in the first nine months of 2012, increased shipments slightly over 24% compared to the $39.501 million shipped in the same period of 2011. WOOL CARPET AND RUG SHIPMENTS China, with $269,062 in shipments, remained the largest exporter of man-made carpets and rugs into the U.S., accounting for over one-third of all shipments in the first nine months. In second place, shipments from Turkey grew over 22% compared to the first nine months of 2011. Turkey had $114.869 million in shipments of man-made carpets and rugs to the U.S.,in the first nine months of 2012 compared to the $93.872 million shipped in the same period a year ago. Turkey accounted for nearly 15% of all man-made carpets and rugs shipped to the U.S.. in the first nine months of 2012. Together, China and Turkey accounted for nearly half of man-made fiber carpet and rug shipments to the U.S. in the first nine months of 2012. Now ranking sixth in the man-made fiber category, India had the fastest growth rate, over 119% in the first nine months of 2012 compared to 2011. India had $39.150 million worth of shipments in the 2012 period, compared to $17.845 million the 2011 period. The export numbers for Pakistan also include many rugs that are made in Afghanistan, then finished and shipped from Pakistan. 2012 World-Wide All Countries 2011 $460.135 2012 $487.737 %Change +6.00% WOOL RUG AND CARPET IMPORTS TO U.S. First Nine Months 2012 - 2011 FIRST NINE MONTHS OF 2012 VS. FIRST NINE MONTHS OF 2011 WOOL RUG AND CARPET EXPORTS TO U.S. TOP 10 EXPORTING COUNTRIES 2011 2012 %Change *MILLIONS OF U.S. DOLLARS 1 2 3 4 5 6 7 8 9 10 INDIA CHINA NEPAL PAKISTAN TURKEY THAILAND UNITED KINGDOM PORTUGAL SPAIN IRELAND $221.417 $67.892 $39.501 $19.612 $18.747 $225.977 $75.235 $49.001 $22.129 $21.048 +2% +10.82% +24.05% +12.83% +12.28% 2011 2012 %Change $6.936 $11.614 $7.505 $7.505 $5.692 $9.749 $8.735 $7.997 $7.730 $7.108 +2% +10.82% +24.05% +12.83% +12.28%