unwanted pregnancy Kit [+918133066128] Abortion Pills IN Dubai UAE Abudhabi
Equities
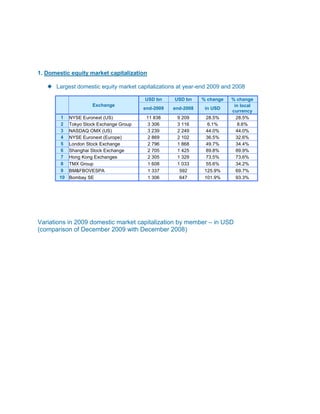
1. 1. Domestic equity market capitalization
Largest domestic equity market capitalizations at year-end 2009 and 2008
USD bn USD bn % change % change
Exchange in local
end-2009 end-2008 in USD
currency
1 NYSE Euronext (US) 11 838 9 209 28.5% 28.5%
2 Tokyo Stock Exchange Group 3 306 3 116 6.1% 8.6%
3 NASDAQ OMX (US) 3 239 2 249 44.0% 44.0%
4 NYSE Euronext (Europe) 2 869 2 102 36.5% 32.6%
5 London Stock Exchange 2 796 1 868 49.7% 34.4%
6 Shanghai Stock Exchange 2 705 1 425 89.8% 89.9%
7 Hong Kong Exchanges 2 305 1 329 73.5% 73.6%
8 TMX Group 1 608 1 033 55.6% 34.2%
9 BM&FBOVESPA 1 337 592 125.9% 69.7%
10 Bombay SE 1 306 647 101.9% 93.3%
Variations in 2009 domestic market capitalization by member – in USD
(comparison of December 2009 with December 2008)
2. Shenzhen SE
BM&FBOVESPA
Colombo SE
Indonesia SE
National Stock Exchange India
Bombay SE
Istanbul SE
Shanghai SE
Lima SE
Australian SE
Taiwan SE Corp.
Singapore Exchange
Korea Exchange
Tel Aviv SE
Santiago SE
Hong Kong Exchanges
The Stock Exchange of Thailand
Warsaw SE
Philippine SE
Johannesburg SE
Budapest SE
Colombia SE
Luxembourg SE
Oslo Børs
TSX Group
Bursa Malaysia
Mexican Exchange
London SE
Wiener Börse
New Zealand Exchange
NASDAQ OMX Nordic Exchange
NASDAQ OMX
Mauritius SE
BME Spanish Exchanges
NYSE Euronext (Europe)
Cyprus SE
NYSE Euronext (US)
Borsa Italiana
Athens Exchange
Irish SE
Tehran SE
SIX Swiss Exchange
Deutsche Börse
Buenos Aires SE
Malta SE
Tokyo SE
Egyptian Exchange
Ljubljana SE
Jasdaq
Osaka SE
Amman SE
Bermuda SE
-40% -30% -20% -10% 0% 10% 20% 30% 40% 50% 60% 70% 80% 90% 100% 110% 120% 130% 140% 150% 160%
3. In this section the various stock exchanges have been compared on the following
parameters;
1. Market Capitalization
2. number of listed securities
3. listing agreements
4. circuit filters
5. settlement