1. Appendix Tables
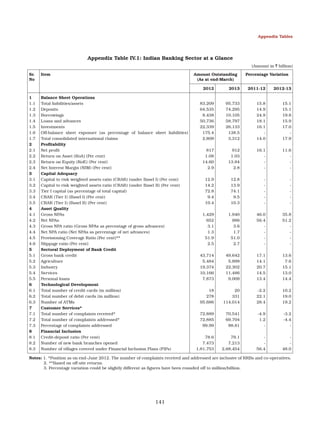
Appendix Table IV.1: Indian Banking Sector at a Glance
(Amount in ` billion)
Sr.
No
Item
Amount Outstanding
(As at end-March)
Percentage Variation
2012
1
1.1
1.2
1.3
1.4
1.5
1.6
1.7
2
2.1
2.2
2.3
2.4
3
3.1
3.2
3.3
3.4
3.5
4
4.1
4.2
4.3
4.4
4.5
4.6
5
5.1
5.2
5.3
5.4
5.5
6
6.1
6.2
6.3
7
7.1
7.2
7.3
8
8.1
8.2
8.3
Balance Sheet Operations
Total liabilities/assets
Deposits
Borrowings
Loans and advances
Investments
Off-balance sheet exposure (as percentage of balance sheet liabilities)
Total consolidated international claims
Profitability
Net profit
Return on Asset (RoA) (Per cent)
Return on Equity (RoE) (Per cent)
Net Interest Margin (NIM) (Per cent)
Capital Adequacy
Capital to risk weighted assets ratio (CRAR) (under Basel I) (Per cent)
Capital to risk weighted assets ratio (CRAR) (under Basel II) (Per cent)
Tier I capital (as percentage of total capital)
CRAR (Tier I) (Basel I) (Per cent)
CRAR (Tier I) (Basel II) (Per cent)
Asset Quality
Gross NPAs
Net NPAs
Gross NPA ratio (Gross NPAs as percentage of gross advances)
Net NPA ratio (Net NPAs as percentage of net advances)
Provisioning Coverage Ratio (Per cent)**
Slippage ratio (Per cent)
Sectoral Deployment of Bank Credit
Gross bank credit
Agriculture
Industry
Services
Personal loans
Technological Development
Total number of credit cards (in million)
Total number of debit cards (in million)
Number of ATMs
Customer Services*
Total number of complaints received*
Total number of complaints addressed*
Percentage of complaints addressed
Financial Inclusion
Credit-deposit ratio (Per cent)
Number of new bank branches opened
Number of villages covered under Financial Inclusion Plans (FIPs)
2013
2011-12
2012-13
83,209
64,535
8,438
50,736
22,339
175.4
2,809
95,733
74,295
10,105
58,797
26,133
138.5
3,312
15.8
14.9
24.9
18.1
16.1
14.0
15.1
15.1
19.8
15.9
17.0
17.9
817
1.08
14.60
2.9
912
1.03
13.84
2.8
16.1
-
11.6
-
12.9
14.2
72.8
9.4
10.4
12.8
13.9
74.1
9.5
10.3
-
-
1,429
652
3.1
1.3
51.9
2.5
1,940
986
3.6
1.7
51.0
2.7
46.0
56.4
-
35.8
51.2
-
43,714
5,484
19,374
10,166
7,873
49,642
5,899
22,302
11,486
9,009
17.1
14.1
20.7
14.5
13.4
13.6
7.6
15.1
13.0
14.4
18
278
95,686
20
331
114,014
-2.2
22.1
28.4
10.2
19.0
19.2
72,889
72,885
99.99
70,541
69,704
98.81
-4.9
1.2
-
-3.2
-4.4
-
78.6
7,473
1,81,753
79.1
7,213
2,68,454
56.4
48.0
Notes: 1. *Position as on end-June 2012. The number of complaints received and addressed are inclusive of RRBs and co-operatives.
2. **Based on off-site returns.
3. Percentage variation could be slightly different as figures have been rounded off to million/billion.
141