SlideShare a Scribd company logo
1 of 6
How EquityLock® Protection Works

                      Example: $200,000 Property Ownership Timeline
                with FHFA House Price Index (HPI) as reported at www.fhfa.gov
    Current Home Value =
                                                                                  Property
          $200,000                                                                 Sells in
                                                                                   Year 6
    Local City Price Index =
    214 at time of coverage                                                                          HPI = 226
                    Property Covered by                                                         Increase in City Index
                   EquityLock Protection                                                            No Claim
                         Contract

                                                                                                      HPI = 214
                                                                                                No Change in City Index
                                              Year 2   Year 3   Year 4   Year 5   Year 6             No Claim
                          Year 1

                    24 Month Waiting Period
                                                                                                      HPI = 171
                                                                                           Decrease in City Index is 43 points.
 RESULT                                                                                    HPI at time of coverage:      214
In this case, the local housing market values dropped by 20% when the house is             HPI at time of sale:        - 171
                                                                                                          Difference: 43
sold in Year 6. This results in $40,000 PAID to the homeowner.
Future claim payments are calculated by:                                                   (214-171) 214 = 20% drop
    multiplying the initial Protected Coverage Amount          $200,000                       Claim PAID = $40,000
    times the Percentage Decrease in the HPI Index              _ x 20%
    at the time the homeowner sells their house               = $40,000 PAID
PROPRIETARY AND CONFIDENTIAL

            0                                                                                                               0
EquityLock Protection Examples

      In 2012, Mr. Jones purchases a home for $300,000 and an EquityLock Protection contract for $5,700
      (1.90% of the home price). The local House Price Index at the time is 100. In 2015, Mr. Jones sells the
      home under one of the following potential scenarios:

                                                                    Scenario 1       Scenario 2     Scenario 3

                Initial Value at Beginning of Protection Contract   $   300,000      $   300,000    $   300,000
                         Property Value When Sold Years Later       $   350,000      $   250,000    $   325,000

                                      Property Value Difference     $    50,000      $   (50,000)   $    25,000

                                                                                                                   We will
                    House Price Index at Beginning of Contract              100              100            100
                                                                                                                  pay claims
                                     HPI When Property is Sold              105               80             90
                                                                                                                  regardless
                % Difference in HPI (Maximum Allowed is 20%)               5.0%           -20.0%         -10.0%
                                                                                                                     of the
                Initial Value at Beginning of Protection Contract   $   300,000      $   300,000    $   300,000   property’s
                                 Multiplied by Difference in HPI           5.0%           -20.0%         -10.0%   sales price
                          = Claim Paid by EquityLock Solutions      $            -   $    60,000    $    30,000      in the
                                      Property Value Difference     $    50,000      $   (50,000)   $    25,000     future!
                                 Net Benefit to Property Owner      $    50,000      $    10,000    $    55,000


        It’s About The INDEX - Not The Individual Property’s Resale Value

PROPRIETARY AND CONFIDENTIAL

            1                                                                                                              1
Your Options to Purchase EquityLock® Protection
                                                                           OPTION EXAMPLES
                                                               Property Protection Value  = $300,000
                                                               EquityLock Protection
                                                               Contract Rate              =    2.10%
1. Pay the total amount of EquityLock Protection               Total Protection Cost           = $ 6,300
   with a one-time payment.

2. Pay the total amount with 12 equal monthly                  Payments for 12 Months          = $ 525
   installments. No Interest. No Credit Check.
                                                               Monthly payments for 60
3. Finance the total amount through Prentice Acceptance        months at 9.98% through
   Corporation for 18 to 60 months at 9.98% fixed              Prentice Acceptance Corp.       = $ 126.36*
   APR, with automatic approval* for a limited time.           *Estimate. Required $350 down
     *A credit check is required.                              payment deducted from total
                                                               protection cost of $6,300.


4. Add EquityLock Protection to your existing mortgage
   payment at your current mortgage rate.                      EquityLock monthly payment
                                                               added to your mortgage payment
   Financing can be up to 60 months and requires prior         for 60 months assuming
   approval by your mortgage servicing company or              current 4.25% APR on
                                                               your mortgage                = $ 116.74
   lender.

PROPRIETARY AND CONFIDENTIAL

            2
How is Your Protected Coverage Amount Determined?


     Values are specified by you and can be based on your:
                 Home sales price
                 Tax assessed value
                 Mortgage amount
                 Down payment or equity amount
                 Any value you choose up to $2 million*
                      * Amounts above $2 million require additional underwriting


                         No Need To Validate Property Values

PROPRIETARY AND CONFIDENTIAL

            3
Population                                                                       % Change In HPI   Current HPI
                                       MSA                            State                                      HPI Peak
  Rank
   30
   13
             Las Vegas-Paradise, NV
             Riverside-San Bernardino-Ontario, CA
                                                                        NV
                                                                        CA
                                                                                   Since Peak
                                                                                     -60.24%
                                                                                     -48.60%
                                                                                                    1Q 2012
                                                                                                     101.73
                                                                                                     168.33
                                                                                                                  256.52
                                                                                                                  327.48
                                                                                                                                Top 50 Cities in
   14
   26
   24
             Phoenix-Mesa-Glendale, AZ
             Orlando-Kissimmee-Sanford, FL
             Sacramento-Arden-Arcade-Roseville, CA
                                                                        AZ
                                                                         FL
                                                                        CA
                                                                                     -48.00%
                                                                                     -47.02%
                                                                                     -46.66%
                                                                                                     152.94
                                                                                                     149.29
                                                                                                     155.03
                                                                                                                  294.23
                                                                                                                  281.78
                                                                                                                  290.62
                                                                                                                             Population Ranking &
    8
   19
   12
             Miami-Miami Beach-Kendall, FL (MSAD)
             Tampa-St. Petersburg-Clearwater, FL
             Detroit-Livonia-Dearborn, MI (MSAD)
                                                                         FL
                                                                         FL
                                                                        MI
                                                                                     -45.69%
                                                                                     -41.71%
                                                                                     -38.23%
                                                                                                      185.6
                                                                                                     169.11
                                                                                                      116.7
                                                                                                                  341.75
                                                                                                                  290.12
                                                                                                                  188.92
                                                                                                                              % Change in House
   40
    2
   17
             Jacksonville, FL
             Los Angeles-Long Beach-Glendale, CA (MSAD)
             San Diego-Carlsbad-San Marcos, CA
                                                                         FL
                                                                        CA
                                                                        CA
                                                                                     -34.58%
                                                                                     -33.90%
                                                                                     -33.51%
                                                                                                      175.8
                                                                                                     222.61
                                                                                                     214.06
                                                                                                                  268.73
                                                                                                                  336.76
                                                                                                                  321.95
                                                                                                                                  Price Index
    3        Chicago-Joliet-Naperville, IL (MSAD)                        IL          -24.99%         152.51       203.34
   15        Seattle-Bellevue-Everett, WA (MSAD)                        WA           -24.88%         198.52       264.27
   31        San Jose-Sunnyvale-Santa Clara, CA                         CA           -24.69%         238.78       317.08
   16        Minneapolis-St. Paul-Bloomington, MN-WI                  MN WI          -24.16%         176.73       233.04
   23
    9
             Portland-Vancouver-Hillsboro, OR-WA
             Atlanta-Sandy Springs-Marietta, GA
                                                                      OR WA
                                                                        GA
                                                                                     -23.46%
                                                                                     -23.43%
                                                                                                      185.3
                                                                                                     140.46
                                                                                                                  242.09
                                                                                                                  183.43
                                                                                                                               These large cities have
   38
   11
             Providence-New Bedford-Fall River, RI-MA
             San Francisco-San Mateo-Redwood City, CA (MSAD)
                                                                       RI MA
                                                                        CA
                                                                                     -23.14%
                                                                                     -22.26%
                                                                                                     197.95
                                                                                                     235.59
                                                                                                                  257.53
                                                                                                                  303.04    experienced the largest value
    7        Washington-Arlington-Alexandria, DC-VA-MD-WV (MSAD)   DC VA MD WV       -22.23%         218.05       280.37
   20        Baltimore-Towson, MD                                       MD           -20.38%         201.82       253.48      declines over the last few
   48        Salt Lake City, UT                                         UT           -19.58%          176.5       219.46
   44
   36
             Richmond, VA
        Virginia Beach-Norfolk-Newport News, VA-NC
                                                                       VA
                                                                     VA NC
                                                                                     -17.63%
                                                                                     -17.43%
                                                                                                      181.7
                                                                                                     210.29
                                                                                                                  220.58
                                                                                                                  254.67
                                                                                                                                        years .
   28   Cleveland-Elyria-Mentor, OH                                    OH            -16.15%         126.75       151.17
    1   New York-White Plains-Wayne, NY-NJ (MSAD)                     NY NJ          -16.09%         227.99        271.7
   10
   33
        Boston-Quincy, MA (MSAD)
        Charlotte-Gastonia-Rock Hill, NC-SC
                                                                       MA
                                                                     NC SC
                                                                                     -15.20%
                                                                                     -14.26%
                                                                                                     230.71
                                                                                                     155.76
                                                                                                                  272.05
                                                                                                                  181.66     If you need to sell your home
   41   Memphis, TN-MS-AR                                           TN MS AR         -12.48%         138.47       158.21
   39   Milwaukee-Waukesha-West Allis, WI                               WI           -11.99%         166.41        189.1    in the next few years, will it be
   45   Hartford, CT                                                    CT           -11.48%         173.95       196.51
   50   Birmingham-Hoover, AL                                           AL           -10.81%         160.12       179.53         worth what it is today?
    5   Philadelphia, PA (MSAD)                                         PA            -9.90%         197.35       219.04
   29   Kansas City, MO-KS                                           MO KS            -9.90%         161.78       179.56
   18   St. Louis, MO-IL                                             MO IL            -9.60%         169.51       187.51
  47
  46
        Raleigh-Cary, NC
        New Orleans-Metairie-Kenner, LA
                                                                       NC
                                                                        LA
                                                                                      -8.35%
                                                                                      -8.18%
                                                                                                     154.78
                                                                                                     191.82
                                                                                                                  168.89
                                                                                                                  208.92
                                                                                                                                EquityLock Protection
  27
  32
        Cincinnati-Middletown, OH-KY-IN
        Columbus, OH
                                                                    OH KY IN
                                                                       OH
                                                                                      -8.18%
                                                                                      -8.10%
                                                                                                     145.58
                                                                                                      144.1
                                                                                                                  158.56
                                                                                                                  156.81              gives you
  37    Nashville-Davidson--Murfreesboro--Franklin, TN                 TN             -7.69%         174.56        189.1
  21    Denver-Aurora-Broomfield, CO                                   CO             -5.88%         187.81       199.54    property value peace of mind.
  34    Indianapolis-Carmel, IN                                         IN            -5.29%         140.73       148.59
   4    Dallas-Plano-Irving, TX (MSAD)                                  TX            -4.06%         162.57       169.45
  42    Louisville-Jefferson County, KY-IN                            KY IN           -4.06%         163.73       170.65
  25    San Antonio-New Braunfels, TX                                   TX            -2.80%         172.26       177.22
   6    Houston-Sugar Land-Baytown, TX                                  TX            -1.74%         187.13       190.45
  35    Austin-Round Rock-San Marcos, TX                                TX            -1.65%         199.18       202.52
  43    Oklahoma City, OK                                               OK            -1.13%         176.41       178.42
PROPRIETARY AND CONFIDENTIAL
  22    Pittsburgh, PA                                                  PA            -0.07%         167.13       168.32
  49    Buffalo-Niagara Falls, NY                                      NY              0.00%         151.73       151.73
                   4
Summary of EquityLock Protection Terms
          Feature                                                     Description
                               Current property value (or more), purchase price, mortgage amount, down payment,
    Protected Coverage
                               existing equity - Consumer determines property coverage amount of contract.
      Coverage Period          Standard contract is for 15 years.

      Waiting Period           No claims are eligible for payment within the first 24 months of contract.

        Claim Terms            Property sales require an “arm’s-length” transaction to an unrelated party.

          Coverage             Standard contract maximum claim is 20% of contract amount.

      Property Types           Primary residences, second homes, non-owner occupied and multi-family up to 49 units.
                               Pricing is based on property and loan factors including; homeowner probability of
       Pricing Factors         mobility, loan status, property type, property value, occupancy type (rent, lease to own,
                               owner occupied…) and geography.
                               Foreclosures are not eligible for EquityLock Protection. EquityLock Protection is available
        Limitations            for short sales, subject to lender approval.
                               Consumer direct pricing is between 1.50% - 3.00% based on pricing factors above for
       Pricing Terms           existing homeowners. Financing is available and can be added to existing mortgage
                               payments with lender approval.
       Administrator           Willis Group Holdings PLC
  Additional Information       Sample contract and pricing plans available upon request.
PROPRIETARY AND CONFIDENTIAL

            5

More Related Content

What's hot

Allianz Machinery Breakdown Claim Form
Allianz Machinery Breakdown Claim FormAllianz Machinery Breakdown Claim Form
Allianz Machinery Breakdown Claim FormInsuranceRateMonitors
 
Top 26 grants and rebates for homeowners
Top 26 grants and rebates for homeownersTop 26 grants and rebates for homeowners
Top 26 grants and rebates for homeownersMatt Collinge
 
Simple Interest vs. Compound Interest
Simple Interest vs. Compound InterestSimple Interest vs. Compound Interest
Simple Interest vs. Compound InterestMike Glennon
 
Top 25 grants and rebates for homeowners
Top 25 grants and rebates for homeownersTop 25 grants and rebates for homeowners
Top 25 grants and rebates for homeownersMatt Collinge
 
Plantersbank 2012 Sure Save Sure Prize - List of Promo Items
Plantersbank 2012 Sure Save Sure Prize - List of Promo ItemsPlantersbank 2012 Sure Save Sure Prize - List of Promo Items
Plantersbank 2012 Sure Save Sure Prize - List of Promo ItemsSME Solutions, Inc.
 
Downsizing In Place 10 10 08
Downsizing In Place  10 10 08Downsizing In Place  10 10 08
Downsizing In Place 10 10 08guestb2de1
 
Buy A Home & Get A Tax Break!
Buy A Home & Get A Tax Break!Buy A Home & Get A Tax Break!
Buy A Home & Get A Tax Break!Annette Simmons
 
Good Faith Example Calculator
Good Faith Example CalculatorGood Faith Example Calculator
Good Faith Example CalculatorLee Robinson
 
ArthaYantra Buy vs. Rent Score (ABRS)-Hyderabad
ArthaYantra Buy vs. Rent Score (ABRS)-HyderabadArthaYantra Buy vs. Rent Score (ABRS)-Hyderabad
ArthaYantra Buy vs. Rent Score (ABRS)-HyderabadArthaYantra
 
Christmas Gift Sets 2011
Christmas Gift Sets 2011Christmas Gift Sets 2011
Christmas Gift Sets 2011lingo_ceo
 

What's hot (19)

Allianz Machinery Breakdown Claim Form
Allianz Machinery Breakdown Claim FormAllianz Machinery Breakdown Claim Form
Allianz Machinery Breakdown Claim Form
 
New citimortgage Short Sale Package
New citimortgage Short Sale PackageNew citimortgage Short Sale Package
New citimortgage Short Sale Package
 
Top 26 grants and rebates for homeowners
Top 26 grants and rebates for homeownersTop 26 grants and rebates for homeowners
Top 26 grants and rebates for homeowners
 
Simple Interest vs. Compound Interest
Simple Interest vs. Compound InterestSimple Interest vs. Compound Interest
Simple Interest vs. Compound Interest
 
Top 25 grants and rebates for homeowners
Top 25 grants and rebates for homeownersTop 25 grants and rebates for homeowners
Top 25 grants and rebates for homeowners
 
App
AppApp
App
 
Client Advantage
Client AdvantageClient Advantage
Client Advantage
 
Plantersbank 2012 Sure Save Sure Prize - List of Promo Items
Plantersbank 2012 Sure Save Sure Prize - List of Promo ItemsPlantersbank 2012 Sure Save Sure Prize - List of Promo Items
Plantersbank 2012 Sure Save Sure Prize - List of Promo Items
 
4/12-4/18
 4/12-4/18 4/12-4/18
4/12-4/18
 
commission structure
commission structurecommission structure
commission structure
 
Downsizing In Place 10 10 08
Downsizing In Place  10 10 08Downsizing In Place  10 10 08
Downsizing In Place 10 10 08
 
Solution ACC180 Jan 2012
Solution ACC180 Jan 2012Solution ACC180 Jan 2012
Solution ACC180 Jan 2012
 
Buy A Home & Get A Tax Break!
Buy A Home & Get A Tax Break!Buy A Home & Get A Tax Break!
Buy A Home & Get A Tax Break!
 
Good Faith Example Calculator
Good Faith Example CalculatorGood Faith Example Calculator
Good Faith Example Calculator
 
1003
10031003
1003
 
Compensation Plan
Compensation PlanCompensation Plan
Compensation Plan
 
Fact Finder
Fact FinderFact Finder
Fact Finder
 
ArthaYantra Buy vs. Rent Score (ABRS)-Hyderabad
ArthaYantra Buy vs. Rent Score (ABRS)-HyderabadArthaYantra Buy vs. Rent Score (ABRS)-Hyderabad
ArthaYantra Buy vs. Rent Score (ABRS)-Hyderabad
 
Christmas Gift Sets 2011
Christmas Gift Sets 2011Christmas Gift Sets 2011
Christmas Gift Sets 2011
 

Similar to EquityLock Protection For Existing Homeowners

2 home insurance lesson feb 17
2 home insurance lesson feb 172 home insurance lesson feb 17
2 home insurance lesson feb 17mskarras
 
Lesson 2 feb 17
Lesson 2 feb 17Lesson 2 feb 17
Lesson 2 feb 17mskarras
 
The Keys to Investment Cash Flow Anaysis
The Keys to Investment Cash Flow AnaysisThe Keys to Investment Cash Flow Anaysis
The Keys to Investment Cash Flow AnaysisAppFolio
 
Chap017 capital structure
Chap017 capital structureChap017 capital structure
Chap017 capital structureFatfat Shiying
 
OCG Private Lender Program
OCG Private Lender ProgramOCG Private Lender Program
OCG Private Lender ProgramMathewOwens2001
 
Residential Southern California Joint Venture
Residential Southern California Joint VentureResidential Southern California Joint Venture
Residential Southern California Joint VentureSam Ally
 
Debt or Equity Financing : Stephenson Real Estate Recapitalization Case Study
Debt or Equity Financing : Stephenson Real Estate Recapitalization Case StudyDebt or Equity Financing : Stephenson Real Estate Recapitalization Case Study
Debt or Equity Financing : Stephenson Real Estate Recapitalization Case StudyUun Ainurrofiq (Fiq)
 
Why rent when you can buy
Why rent when you can buyWhy rent when you can buy
Why rent when you can buyMindy Shears
 
Lease Operating Expenses Explained
Lease Operating Expenses ExplainedLease Operating Expenses Explained
Lease Operating Expenses Explaineddotsurf
 
Federal Vs State Tax Credit
Federal Vs  State  Tax  CreditFederal Vs  State  Tax  Credit
Federal Vs State Tax Creditc21mm
 

Similar to EquityLock Protection For Existing Homeowners (13)

Information Sheet
Information SheetInformation Sheet
Information Sheet
 
2 home insurance lesson feb 17
2 home insurance lesson feb 172 home insurance lesson feb 17
2 home insurance lesson feb 17
 
Lesson 2 feb 17
Lesson 2 feb 17Lesson 2 feb 17
Lesson 2 feb 17
 
CFA Alternative Investments
CFA Alternative InvestmentsCFA Alternative Investments
CFA Alternative Investments
 
The Keys to Investment Cash Flow Anaysis
The Keys to Investment Cash Flow AnaysisThe Keys to Investment Cash Flow Anaysis
The Keys to Investment Cash Flow Anaysis
 
Sale/leasebacks
Sale/leasebacksSale/leasebacks
Sale/leasebacks
 
Chap017 capital structure
Chap017 capital structureChap017 capital structure
Chap017 capital structure
 
OCG Private Lender Program
OCG Private Lender ProgramOCG Private Lender Program
OCG Private Lender Program
 
Residential Southern California Joint Venture
Residential Southern California Joint VentureResidential Southern California Joint Venture
Residential Southern California Joint Venture
 
Debt or Equity Financing : Stephenson Real Estate Recapitalization Case Study
Debt or Equity Financing : Stephenson Real Estate Recapitalization Case StudyDebt or Equity Financing : Stephenson Real Estate Recapitalization Case Study
Debt or Equity Financing : Stephenson Real Estate Recapitalization Case Study
 
Why rent when you can buy
Why rent when you can buyWhy rent when you can buy
Why rent when you can buy
 
Lease Operating Expenses Explained
Lease Operating Expenses ExplainedLease Operating Expenses Explained
Lease Operating Expenses Explained
 
Federal Vs State Tax Credit
Federal Vs  State  Tax  CreditFederal Vs  State  Tax  Credit
Federal Vs State Tax Credit
 

EquityLock Protection For Existing Homeowners

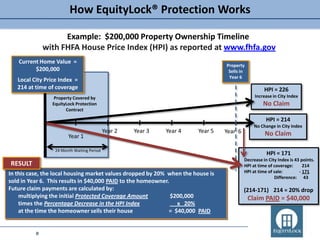
  • 1. How EquityLock® Protection Works Example: $200,000 Property Ownership Timeline with FHFA House Price Index (HPI) as reported at www.fhfa.gov Current Home Value = Property $200,000 Sells in Year 6 Local City Price Index = 214 at time of coverage HPI = 226 Property Covered by Increase in City Index EquityLock Protection No Claim Contract HPI = 214 No Change in City Index Year 2 Year 3 Year 4 Year 5 Year 6 No Claim Year 1 24 Month Waiting Period HPI = 171 Decrease in City Index is 43 points. RESULT HPI at time of coverage: 214 In this case, the local housing market values dropped by 20% when the house is HPI at time of sale: - 171 Difference: 43 sold in Year 6. This results in $40,000 PAID to the homeowner. Future claim payments are calculated by: (214-171) 214 = 20% drop multiplying the initial Protected Coverage Amount $200,000 Claim PAID = $40,000 times the Percentage Decrease in the HPI Index _ x 20% at the time the homeowner sells their house = $40,000 PAID PROPRIETARY AND CONFIDENTIAL 0 0
  • 2. EquityLock Protection Examples In 2012, Mr. Jones purchases a home for $300,000 and an EquityLock Protection contract for $5,700 (1.90% of the home price). The local House Price Index at the time is 100. In 2015, Mr. Jones sells the home under one of the following potential scenarios: Scenario 1 Scenario 2 Scenario 3 Initial Value at Beginning of Protection Contract $ 300,000 $ 300,000 $ 300,000 Property Value When Sold Years Later $ 350,000 $ 250,000 $ 325,000 Property Value Difference $ 50,000 $ (50,000) $ 25,000 We will House Price Index at Beginning of Contract 100 100 100 pay claims HPI When Property is Sold 105 80 90 regardless % Difference in HPI (Maximum Allowed is 20%) 5.0% -20.0% -10.0% of the Initial Value at Beginning of Protection Contract $ 300,000 $ 300,000 $ 300,000 property’s Multiplied by Difference in HPI 5.0% -20.0% -10.0% sales price = Claim Paid by EquityLock Solutions $ - $ 60,000 $ 30,000 in the Property Value Difference $ 50,000 $ (50,000) $ 25,000 future! Net Benefit to Property Owner $ 50,000 $ 10,000 $ 55,000 It’s About The INDEX - Not The Individual Property’s Resale Value PROPRIETARY AND CONFIDENTIAL 1 1
  • 3. Your Options to Purchase EquityLock® Protection OPTION EXAMPLES Property Protection Value = $300,000 EquityLock Protection Contract Rate = 2.10% 1. Pay the total amount of EquityLock Protection Total Protection Cost = $ 6,300 with a one-time payment. 2. Pay the total amount with 12 equal monthly Payments for 12 Months = $ 525 installments. No Interest. No Credit Check. Monthly payments for 60 3. Finance the total amount through Prentice Acceptance months at 9.98% through Corporation for 18 to 60 months at 9.98% fixed Prentice Acceptance Corp. = $ 126.36* APR, with automatic approval* for a limited time. *Estimate. Required $350 down *A credit check is required. payment deducted from total protection cost of $6,300. 4. Add EquityLock Protection to your existing mortgage payment at your current mortgage rate. EquityLock monthly payment added to your mortgage payment Financing can be up to 60 months and requires prior for 60 months assuming approval by your mortgage servicing company or current 4.25% APR on your mortgage = $ 116.74 lender. PROPRIETARY AND CONFIDENTIAL 2
  • 4. How is Your Protected Coverage Amount Determined? Values are specified by you and can be based on your:  Home sales price  Tax assessed value  Mortgage amount  Down payment or equity amount  Any value you choose up to $2 million* * Amounts above $2 million require additional underwriting No Need To Validate Property Values PROPRIETARY AND CONFIDENTIAL 3
  • 5. Population % Change In HPI Current HPI MSA State HPI Peak Rank 30 13 Las Vegas-Paradise, NV Riverside-San Bernardino-Ontario, CA NV CA Since Peak -60.24% -48.60% 1Q 2012 101.73 168.33 256.52 327.48 Top 50 Cities in 14 26 24 Phoenix-Mesa-Glendale, AZ Orlando-Kissimmee-Sanford, FL Sacramento-Arden-Arcade-Roseville, CA AZ FL CA -48.00% -47.02% -46.66% 152.94 149.29 155.03 294.23 281.78 290.62 Population Ranking & 8 19 12 Miami-Miami Beach-Kendall, FL (MSAD) Tampa-St. Petersburg-Clearwater, FL Detroit-Livonia-Dearborn, MI (MSAD) FL FL MI -45.69% -41.71% -38.23% 185.6 169.11 116.7 341.75 290.12 188.92 % Change in House 40 2 17 Jacksonville, FL Los Angeles-Long Beach-Glendale, CA (MSAD) San Diego-Carlsbad-San Marcos, CA FL CA CA -34.58% -33.90% -33.51% 175.8 222.61 214.06 268.73 336.76 321.95 Price Index 3 Chicago-Joliet-Naperville, IL (MSAD) IL -24.99% 152.51 203.34 15 Seattle-Bellevue-Everett, WA (MSAD) WA -24.88% 198.52 264.27 31 San Jose-Sunnyvale-Santa Clara, CA CA -24.69% 238.78 317.08 16 Minneapolis-St. Paul-Bloomington, MN-WI MN WI -24.16% 176.73 233.04 23 9 Portland-Vancouver-Hillsboro, OR-WA Atlanta-Sandy Springs-Marietta, GA OR WA GA -23.46% -23.43% 185.3 140.46 242.09 183.43 These large cities have 38 11 Providence-New Bedford-Fall River, RI-MA San Francisco-San Mateo-Redwood City, CA (MSAD) RI MA CA -23.14% -22.26% 197.95 235.59 257.53 303.04 experienced the largest value 7 Washington-Arlington-Alexandria, DC-VA-MD-WV (MSAD) DC VA MD WV -22.23% 218.05 280.37 20 Baltimore-Towson, MD MD -20.38% 201.82 253.48 declines over the last few 48 Salt Lake City, UT UT -19.58% 176.5 219.46 44 36 Richmond, VA Virginia Beach-Norfolk-Newport News, VA-NC VA VA NC -17.63% -17.43% 181.7 210.29 220.58 254.67 years . 28 Cleveland-Elyria-Mentor, OH OH -16.15% 126.75 151.17 1 New York-White Plains-Wayne, NY-NJ (MSAD) NY NJ -16.09% 227.99 271.7 10 33 Boston-Quincy, MA (MSAD) Charlotte-Gastonia-Rock Hill, NC-SC MA NC SC -15.20% -14.26% 230.71 155.76 272.05 181.66 If you need to sell your home 41 Memphis, TN-MS-AR TN MS AR -12.48% 138.47 158.21 39 Milwaukee-Waukesha-West Allis, WI WI -11.99% 166.41 189.1 in the next few years, will it be 45 Hartford, CT CT -11.48% 173.95 196.51 50 Birmingham-Hoover, AL AL -10.81% 160.12 179.53 worth what it is today? 5 Philadelphia, PA (MSAD) PA -9.90% 197.35 219.04 29 Kansas City, MO-KS MO KS -9.90% 161.78 179.56 18 St. Louis, MO-IL MO IL -9.60% 169.51 187.51 47 46 Raleigh-Cary, NC New Orleans-Metairie-Kenner, LA NC LA -8.35% -8.18% 154.78 191.82 168.89 208.92 EquityLock Protection 27 32 Cincinnati-Middletown, OH-KY-IN Columbus, OH OH KY IN OH -8.18% -8.10% 145.58 144.1 158.56 156.81 gives you 37 Nashville-Davidson--Murfreesboro--Franklin, TN TN -7.69% 174.56 189.1 21 Denver-Aurora-Broomfield, CO CO -5.88% 187.81 199.54 property value peace of mind. 34 Indianapolis-Carmel, IN IN -5.29% 140.73 148.59 4 Dallas-Plano-Irving, TX (MSAD) TX -4.06% 162.57 169.45 42 Louisville-Jefferson County, KY-IN KY IN -4.06% 163.73 170.65 25 San Antonio-New Braunfels, TX TX -2.80% 172.26 177.22 6 Houston-Sugar Land-Baytown, TX TX -1.74% 187.13 190.45 35 Austin-Round Rock-San Marcos, TX TX -1.65% 199.18 202.52 43 Oklahoma City, OK OK -1.13% 176.41 178.42 PROPRIETARY AND CONFIDENTIAL 22 Pittsburgh, PA PA -0.07% 167.13 168.32 49 Buffalo-Niagara Falls, NY NY 0.00% 151.73 151.73 4
  • 6. Summary of EquityLock Protection Terms Feature Description Current property value (or more), purchase price, mortgage amount, down payment, Protected Coverage existing equity - Consumer determines property coverage amount of contract. Coverage Period Standard contract is for 15 years. Waiting Period No claims are eligible for payment within the first 24 months of contract. Claim Terms Property sales require an “arm’s-length” transaction to an unrelated party. Coverage Standard contract maximum claim is 20% of contract amount. Property Types Primary residences, second homes, non-owner occupied and multi-family up to 49 units. Pricing is based on property and loan factors including; homeowner probability of Pricing Factors mobility, loan status, property type, property value, occupancy type (rent, lease to own, owner occupied…) and geography. Foreclosures are not eligible for EquityLock Protection. EquityLock Protection is available Limitations for short sales, subject to lender approval. Consumer direct pricing is between 1.50% - 3.00% based on pricing factors above for Pricing Terms existing homeowners. Financing is available and can be added to existing mortgage payments with lender approval. Administrator Willis Group Holdings PLC Additional Information Sample contract and pricing plans available upon request. PROPRIETARY AND CONFIDENTIAL 5