SlideShare a Scribd company logo
1 of 5
Download to read offline
Stock Repurchases in the US
What can our data tell you about Share Buybacks and associated trends?**
Background
Please note all data is based on Calendar Quarters, NOT Fiscal Quarters. Fiscal quarters provided upon request.
**Our metric is reflective of stock repurchases as part of an authorized repurchase plan. We attempt to exclude
share repurchases for employee incentive plans, or other purposes that are not related to returning value to
shareholders.
1
• Calcbench analyzed 15 quarterly periods going back to Q1 2012 through Q3
2015
• 3,295 firm quarter observations collected (e.g. AAPL is in the dataset 12
times, in 3 quarters AAPL did not buy back shares).
• 687, or 20.8% of the observations, were firm quarters with buybacks
greater than $500 Million dollars
• Total dollars spent on buybacks for the 15 periods is $1.366 Trillion.
• The average buyback per firm quarter is $364 million
• 337 quarterly Buybacks Greater than $1B
• Only 10% of all buyback programs,
• BUT more than half of all buyback dollars at 54.2%.
2
Please note all data is based on Calendar Quarters, NOT Fiscal Quarters. Fiscal quarters provided upon request.
**Our metric is reflective of stock repurchases as part of an authorized repurchase plan. We attempt to exclude
share repurchases for employee incentive plans, or other purposes that are not related to returning value to
shareholders.
The table below represents the biggest buyers of their own stock over the last 15
calendar quarters.
Dollars Repurchased Over last 15 Quarters Avg. Daily Repurchase*
Apple Inc. $ 107,976,000,000.00 $ 114,260,317.46
Exxon Mobil Corp $ 53,568,000,000.00 $ 56,685,714.29
International Business Machines Corp $ 43,257,000,000.00 $ 45,774,603.17
Oracle Corp $ 36,048,000,000.00 $ 38,146,031.75
At&T Inc. $ 27,407,000,000.00 $ 29,002,116.40
American International Group Inc. $ 25,958,000,000.00 $ 27,468,783.07
Wells Fargo & Company/MN $ 25,411,000,000.00 $ 26,889,947.09
Motorola Solutions, Inc. $ 22,413,000,000.00 $ 23,717,460.32
Qualcomm Inc./DE $ 20,214,000,000.00 $ 21,390,476.19
Cisco Systems, Inc. $ 20,103,000,000.00 $ 21,273,015.87
Microsoft Corp $ 19,898,000,000.00 $ 21,056,084.66
Merck & Co., Inc. $ 19,815,000,000.00 $ 20,968,253.97
Walt Disney Co/ $ 18,924,000,000.00 $ 20,025,396.83
Goldman Sachs Group Inc. $ 18,829,000,000.00 $ 19,924,867.72
Intel Corp $ 18,756,000,000.00 $ 19,847,619.05
38.6% 37.2%
43.5%
39.3% 37.7%
50.6%
29.6%
34.8%
31.2% 29.3%
46.0%
29.9%
34.8%
30.8%
39.9%
0.0%
10.0%
20.0%
30.0%
40.0%
50.0%
60.0%
Top 10 Firms Percent of Total Activity By Quarter
Firm Level Buybacks
*Avg. Daily Repurchase based on 63 day quarters
3
Please note all data is based on Calendar Quarters, NOT Fiscal Quarters. Fiscal quarters provided upon request.
**Our metric is reflective of stock repurchases as part of an authorized repurchase plan. We attempt to exclude
share repurchases for employee incentive plans, or other purposes that are not related to returning value to
shareholders.
Buyback Yields*
Top 20 Firms by Quarter
0
2
4
6
8
10
12
14
16
18
20
0.0% 1.0% 2.0% 3.0% 4.0% 5.0% 6.0% 7.0% 8.0% 9.0% 10.0%
2015_Q3 2015_Q2 2015_Q1 2014_Q4
• Maximum buyback yield in Q2 at almost 9%(Express Scripts)
• Median buyback yield in top 20 firms is 3.2% for all quarters.
Biggest
Buybacks
Smallest in the top 20
(Still big though)
*Total dollars bought back divided by the market capitalization of the firm.
4
Please note all data is based on Calendar Quarters, NOT Fiscal Quarters. Fiscal quarters provided upon request.
**Our metric is reflective of stock repurchases as part of an authorized repurchase plan. We attempt to exclude
share repurchases for employee incentive plans, or other purposes that are not related to returning value to
shareholders.
Buyback Yields For Top 10 Firms
0.0%
1.0%
2.0%
3.0%
4.0%
5.0%
6.0%
7.0%
8.0%
9.0%
BedBath&BeyondInc
CorningInc/NY
CitrixSystemsInc
DardenRestaurants
Inc
ParkerHannifinCorp
FluorCorp
L3Communications
HoldingsInc
StarwoodHotel&
ResortsWorldwide,…
HessCorp
ScrippsNetworks
Interactive,Inc.
2014 Fourth Quarter
0.0%
2.0%
4.0%
6.0%
8.0%
10.0%
12.0%
ScrippsNetworks
Interactive,Inc.
NetApp,Inc.
SouthernCo
JuniperNetworksInc
CbsCorp
NavientCorp
LyondellBasell
IndustriesN.V.
SeagateTechnology
plc
UnitedRentalsInc/DE
AllstateCorp
2015 First Quarter
0.0%
1.0%
2.0%
3.0%
4.0%
5.0%
6.0%
7.0%
8.0%
9.0%
10.0%
ExpressScripts
HoldingCo.
JuniperNetworksInc
NetApp,Inc.
NavientCorp
QualcommInc/DE
LowesCompaniesInc
UrbanOutfittersInc
MarriottInternational
Inc/MD/
American
InternationalGroup…
MurphyOilCorp/DE
2015 Second Quarter
0.0%
1.0%
2.0%
3.0%
4.0%
5.0%
6.0%
7.0%
SeagateTechnology
plc
XeroxCorp
American
InternationalGroup…
MichaelKorsHoldings
Ltd
IntuitInc
Macy's,Inc.
MicrochipTechnology
Inc
MarriottInternational
Inc/MD/
AirgasInc
CorningInc/NY
2015 Third Quarter
Try Calcbench Today!
ABOUT THIS REPORT: This report was created using data analyzed via
Calcbench’s Premium Suite, an online interactive platform that helps finance
leaders access and analyze financial data thoroughly and efficiently.
Our accessible and intuitive platform can aid in better understanding
competitor financials, identifying potential risk areas, analyzing trends across
industry sectors, or conducting more effective due diligence.
Sign up for a 2 week free trial at
www.calcbench.com/trial
or contact us at us@calcbench.com or via www.calcbench.com
CALCBENCH PREMIUM SUITE
5

More Related Content

What's hot

A du-pont analysis of automobile companies
A du-pont analysis of automobile companiesA du-pont analysis of automobile companies
A du-pont analysis of automobile companies
priya1826dangi
 

What's hot (18)

Chap005
Chap005Chap005
Chap005
 
Chap006
Chap006Chap006
Chap006
 
Accounting Ratios
Accounting RatiosAccounting Ratios
Accounting Ratios
 
Profitability ratios
Profitability ratiosProfitability ratios
Profitability ratios
 
Du pont analysis
Du pont analysisDu pont analysis
Du pont analysis
 
Sustainable Growth Rate | Finance
Sustainable Growth Rate | FinanceSustainable Growth Rate | Finance
Sustainable Growth Rate | Finance
 
Internal Growth Rate | Finance
Internal Growth Rate | FinanceInternal Growth Rate | Finance
Internal Growth Rate | Finance
 
Financial Ratios - Introduction to Profitability Ratios
Financial Ratios - Introduction to Profitability RatiosFinancial Ratios - Introduction to Profitability Ratios
Financial Ratios - Introduction to Profitability Ratios
 
Financial ratios Part 1
Financial ratios Part 1Financial ratios Part 1
Financial ratios Part 1
 
Financial ratios
Financial ratiosFinancial ratios
Financial ratios
 
Meeting 3 - Profitability Ratios (Financial Reporting and Analysis)
Meeting 3 - Profitability Ratios (Financial Reporting and Analysis)Meeting 3 - Profitability Ratios (Financial Reporting and Analysis)
Meeting 3 - Profitability Ratios (Financial Reporting and Analysis)
 
A du-pont analysis of automobile companies
A du-pont analysis of automobile companiesA du-pont analysis of automobile companies
A du-pont analysis of automobile companies
 
Chap007
Chap007Chap007
Chap007
 
Profitability Ratios
Profitability RatiosProfitability Ratios
Profitability Ratios
 
Acm
AcmAcm
Acm
 
How to analyze profitability
How to analyze profitabilityHow to analyze profitability
How to analyze profitability
 
Du pont analysis
Du pont analysisDu pont analysis
Du pont analysis
 
Costing imprtance
Costing imprtanceCosting imprtance
Costing imprtance
 

Viewers also liked (14)

80223977 school surveillance
80223977 school surveillance80223977 school surveillance
80223977 school surveillance
 
công ty làm phim quảng cáo uy tín
công ty làm phim quảng cáo uy tíncông ty làm phim quảng cáo uy tín
công ty làm phim quảng cáo uy tín
 
Empty place
Empty placeEmpty place
Empty place
 
Horror channel
Horror channel Horror channel
Horror channel
 
Question 2 Evaluation Media
Question 2 Evaluation MediaQuestion 2 Evaluation Media
Question 2 Evaluation Media
 
Rpp bab-2 (iman kepada allah)
Rpp bab-2 (iman kepada allah)Rpp bab-2 (iman kepada allah)
Rpp bab-2 (iman kepada allah)
 
1
11
1
 
Hypermarket ksa
Hypermarket ksaHypermarket ksa
Hypermarket ksa
 
Undang-Undang Nomor 22 Tahun 2009
Undang-Undang Nomor 22 Tahun 2009Undang-Undang Nomor 22 Tahun 2009
Undang-Undang Nomor 22 Tahun 2009
 
PB&A_ShouldIStayOrShouldIGo_UMich
PB&A_ShouldIStayOrShouldIGo_UMichPB&A_ShouldIStayOrShouldIGo_UMich
PB&A_ShouldIStayOrShouldIGo_UMich
 
ENorthrup_EcommercePort
ENorthrup_EcommercePortENorthrup_EcommercePort
ENorthrup_EcommercePort
 
20150523.career sharing
20150523.career sharing20150523.career sharing
20150523.career sharing
 
ступак
ступакступак
ступак
 
Improving Organizational Risk Management Practice
Improving Organizational Risk Management PracticeImproving Organizational Risk Management Practice
Improving Organizational Risk Management Practice
 

Similar to Stock Repurchases aka Share Buybacks for US Firms

Walmart Income StatementWal-Mart Stores Inc., Consolidated Income .docx
Walmart Income StatementWal-Mart Stores Inc., Consolidated Income .docxWalmart Income StatementWal-Mart Stores Inc., Consolidated Income .docx
Walmart Income StatementWal-Mart Stores Inc., Consolidated Income .docx
melbruce90096
 
[Type text][Type text][Type text]Part 1 Native American’s.docx
[Type text][Type text][Type text]Part 1 Native American’s.docx[Type text][Type text][Type text]Part 1 Native American’s.docx
[Type text][Type text][Type text]Part 1 Native American’s.docx
gerardkortney
 
FIN 534 – FINANCIAL MANAGEMENTwithDr. charity ezenwa.docx
FIN 534 – FINANCIAL MANAGEMENTwithDr. charity ezenwa.docxFIN 534 – FINANCIAL MANAGEMENTwithDr. charity ezenwa.docx
FIN 534 – FINANCIAL MANAGEMENTwithDr. charity ezenwa.docx
charlottej5
 

Similar to Stock Repurchases aka Share Buybacks for US Firms (20)

Stock Repurchases in the United States
Stock Repurchases in the United StatesStock Repurchases in the United States
Stock Repurchases in the United States
 
Q2 2015 earnings conference call presentation
Q2 2015 earnings conference call presentationQ2 2015 earnings conference call presentation
Q2 2015 earnings conference call presentation
 
Q3 2015 Earnings Deck Final 2
Q3 2015 Earnings Deck Final 2Q3 2015 Earnings Deck Final 2
Q3 2015 Earnings Deck Final 2
 
Q1 2015 Earnings Presentation
Q1 2015 Earnings PresentationQ1 2015 Earnings Presentation
Q1 2015 Earnings Presentation
 
Walmart Income StatementWal-Mart Stores Inc., Consolidated Income .docx
Walmart Income StatementWal-Mart Stores Inc., Consolidated Income .docxWalmart Income StatementWal-Mart Stores Inc., Consolidated Income .docx
Walmart Income StatementWal-Mart Stores Inc., Consolidated Income .docx
 
6 ratio analysis
6   ratio analysis6   ratio analysis
6 ratio analysis
 
6.Chapter six new.pptx
6.Chapter six new.pptx6.Chapter six new.pptx
6.Chapter six new.pptx
 
Q3 2016-earnings-slides
Q3 2016-earnings-slidesQ3 2016-earnings-slides
Q3 2016-earnings-slides
 
[Type text][Type text][Type text]Part 1 Native American’s.docx
[Type text][Type text][Type text]Part 1 Native American’s.docx[Type text][Type text][Type text]Part 1 Native American’s.docx
[Type text][Type text][Type text]Part 1 Native American’s.docx
 
FMA-CH-3_1.ppt
FMA-CH-3_1.pptFMA-CH-3_1.ppt
FMA-CH-3_1.ppt
 
01 fs analysis
01 fs analysis01 fs analysis
01 fs analysis
 
FIN 534 – FINANCIAL MANAGEMENTwithDr. charity ezenwa.docx
FIN 534 – FINANCIAL MANAGEMENTwithDr. charity ezenwa.docxFIN 534 – FINANCIAL MANAGEMENTwithDr. charity ezenwa.docx
FIN 534 – FINANCIAL MANAGEMENTwithDr. charity ezenwa.docx
 
Laying Down the Groundwork for Financial Stability
Laying Down the Groundwork for Financial StabilityLaying Down the Groundwork for Financial Stability
Laying Down the Groundwork for Financial Stability
 
Financial interpretations with models & formats (unit 2)
Financial interpretations with models & formats (unit 2)Financial interpretations with models & formats (unit 2)
Financial interpretations with models & formats (unit 2)
 
Financial ratios
Financial ratiosFinancial ratios
Financial ratios
 
Financial interpretations with models & formats (unit 2)
Financial interpretations with models & formats (unit 2)Financial interpretations with models & formats (unit 2)
Financial interpretations with models & formats (unit 2)
 
2 q14 slides final
2 q14 slides final2 q14 slides final
2 q14 slides final
 
Fin 515 week 6 problems solutions
Fin 515 week 6 problems solutionsFin 515 week 6 problems solutions
Fin 515 week 6 problems solutions
 
Nolen bootcamp
Nolen bootcampNolen bootcamp
Nolen bootcamp
 
A Summary of the US Economy through Corporate Finance
A Summary of the US Economy through Corporate FinanceA Summary of the US Economy through Corporate Finance
A Summary of the US Economy through Corporate Finance
 

Recently uploaded

MASTERING FOREX: STRATEGIES FOR SUCCESS.pdf
MASTERING FOREX: STRATEGIES FOR SUCCESS.pdfMASTERING FOREX: STRATEGIES FOR SUCCESS.pdf
MASTERING FOREX: STRATEGIES FOR SUCCESS.pdf
Cocity Enterprises
 

Recently uploaded (20)

Thane Call Girls , 07506202331 Kalyan Call Girls
Thane Call Girls , 07506202331 Kalyan Call GirlsThane Call Girls , 07506202331 Kalyan Call Girls
Thane Call Girls , 07506202331 Kalyan Call Girls
 
Q1 2024 Conference Call Presentation vF.pdf
Q1 2024 Conference Call Presentation vF.pdfQ1 2024 Conference Call Presentation vF.pdf
Q1 2024 Conference Call Presentation vF.pdf
 
Solution Manual For Financial Statement Analysis, 13th Edition By Charles H. ...
Solution Manual For Financial Statement Analysis, 13th Edition By Charles H. ...Solution Manual For Financial Statement Analysis, 13th Edition By Charles H. ...
Solution Manual For Financial Statement Analysis, 13th Edition By Charles H. ...
 
Business Principles, Tools, and Techniques in Participating in Various Types...
Business Principles, Tools, and Techniques  in Participating in Various Types...Business Principles, Tools, and Techniques  in Participating in Various Types...
Business Principles, Tools, and Techniques in Participating in Various Types...
 
Famous Kala Jadu, Black magic expert in Faisalabad and Kala ilam specialist i...
Famous Kala Jadu, Black magic expert in Faisalabad and Kala ilam specialist i...Famous Kala Jadu, Black magic expert in Faisalabad and Kala ilam specialist i...
Famous Kala Jadu, Black magic expert in Faisalabad and Kala ilam specialist i...
 
MASTERING FOREX: STRATEGIES FOR SUCCESS.pdf
MASTERING FOREX: STRATEGIES FOR SUCCESS.pdfMASTERING FOREX: STRATEGIES FOR SUCCESS.pdf
MASTERING FOREX: STRATEGIES FOR SUCCESS.pdf
 
Lion One Corporate Presentation May 2024
Lion One Corporate Presentation May 2024Lion One Corporate Presentation May 2024
Lion One Corporate Presentation May 2024
 
Bhubaneswar🌹Ravi Tailkes ❤CALL GIRLS 9777949614 💟 CALL GIRLS IN bhubaneswar ...
Bhubaneswar🌹Ravi Tailkes  ❤CALL GIRLS 9777949614 💟 CALL GIRLS IN bhubaneswar ...Bhubaneswar🌹Ravi Tailkes  ❤CALL GIRLS 9777949614 💟 CALL GIRLS IN bhubaneswar ...
Bhubaneswar🌹Ravi Tailkes ❤CALL GIRLS 9777949614 💟 CALL GIRLS IN bhubaneswar ...
 
Kurla Capable Call Girls ,07506202331, Sion Affordable Call Girls
Kurla Capable Call Girls ,07506202331, Sion Affordable Call GirlsKurla Capable Call Girls ,07506202331, Sion Affordable Call Girls
Kurla Capable Call Girls ,07506202331, Sion Affordable Call Girls
 
falcon-invoice-discounting-unlocking-prime-investment-opportunities
falcon-invoice-discounting-unlocking-prime-investment-opportunitiesfalcon-invoice-discounting-unlocking-prime-investment-opportunities
falcon-invoice-discounting-unlocking-prime-investment-opportunities
 
Kopar Khairane Cheapest Call Girls✔✔✔9833754194 Nerul Premium Call Girls-Navi...
Kopar Khairane Cheapest Call Girls✔✔✔9833754194 Nerul Premium Call Girls-Navi...Kopar Khairane Cheapest Call Girls✔✔✔9833754194 Nerul Premium Call Girls-Navi...
Kopar Khairane Cheapest Call Girls✔✔✔9833754194 Nerul Premium Call Girls-Navi...
 
Fixed exchange rate and flexible exchange rate.pptx
Fixed exchange rate and flexible exchange rate.pptxFixed exchange rate and flexible exchange rate.pptx
Fixed exchange rate and flexible exchange rate.pptx
 
Bhubaneswar🌹Kalpana Mesuem ❤CALL GIRLS 9777949614 💟 CALL GIRLS IN bhubaneswa...
Bhubaneswar🌹Kalpana Mesuem  ❤CALL GIRLS 9777949614 💟 CALL GIRLS IN bhubaneswa...Bhubaneswar🌹Kalpana Mesuem  ❤CALL GIRLS 9777949614 💟 CALL GIRLS IN bhubaneswa...
Bhubaneswar🌹Kalpana Mesuem ❤CALL GIRLS 9777949614 💟 CALL GIRLS IN bhubaneswa...
 
W.D. Gann Theory Complete Information.pdf
W.D. Gann Theory Complete Information.pdfW.D. Gann Theory Complete Information.pdf
W.D. Gann Theory Complete Information.pdf
 
Call Girls Howrah ( 8250092165 ) Cheap rates call girls | Get low budget
Call Girls Howrah ( 8250092165 ) Cheap rates call girls | Get low budgetCall Girls Howrah ( 8250092165 ) Cheap rates call girls | Get low budget
Call Girls Howrah ( 8250092165 ) Cheap rates call girls | Get low budget
 
Collecting banker, Capacity of collecting Banker, conditions under section 13...
Collecting banker, Capacity of collecting Banker, conditions under section 13...Collecting banker, Capacity of collecting Banker, conditions under section 13...
Collecting banker, Capacity of collecting Banker, conditions under section 13...
 
CBD Belapur((Thane)) Charming Call Girls📞❤9833754194 Kamothe Beautiful Call G...
CBD Belapur((Thane)) Charming Call Girls📞❤9833754194 Kamothe Beautiful Call G...CBD Belapur((Thane)) Charming Call Girls📞❤9833754194 Kamothe Beautiful Call G...
CBD Belapur((Thane)) Charming Call Girls📞❤9833754194 Kamothe Beautiful Call G...
 
Virar Best Sex Call Girls Number-📞📞9833754194-Poorbi Nalasopara Housewife Cal...
Virar Best Sex Call Girls Number-📞📞9833754194-Poorbi Nalasopara Housewife Cal...Virar Best Sex Call Girls Number-📞📞9833754194-Poorbi Nalasopara Housewife Cal...
Virar Best Sex Call Girls Number-📞📞9833754194-Poorbi Nalasopara Housewife Cal...
 
Webinar on E-Invoicing for Fintech Belgium
Webinar on E-Invoicing for Fintech BelgiumWebinar on E-Invoicing for Fintech Belgium
Webinar on E-Invoicing for Fintech Belgium
 
7 steps to achieve financial freedom.pdf
7 steps to achieve financial freedom.pdf7 steps to achieve financial freedom.pdf
7 steps to achieve financial freedom.pdf
 

Stock Repurchases aka Share Buybacks for US Firms

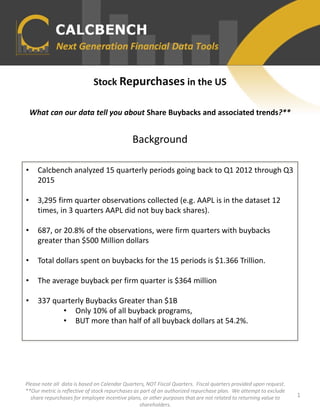
  • 1. Stock Repurchases in the US What can our data tell you about Share Buybacks and associated trends?** Background Please note all data is based on Calendar Quarters, NOT Fiscal Quarters. Fiscal quarters provided upon request. **Our metric is reflective of stock repurchases as part of an authorized repurchase plan. We attempt to exclude share repurchases for employee incentive plans, or other purposes that are not related to returning value to shareholders. 1 • Calcbench analyzed 15 quarterly periods going back to Q1 2012 through Q3 2015 • 3,295 firm quarter observations collected (e.g. AAPL is in the dataset 12 times, in 3 quarters AAPL did not buy back shares). • 687, or 20.8% of the observations, were firm quarters with buybacks greater than $500 Million dollars • Total dollars spent on buybacks for the 15 periods is $1.366 Trillion. • The average buyback per firm quarter is $364 million • 337 quarterly Buybacks Greater than $1B • Only 10% of all buyback programs, • BUT more than half of all buyback dollars at 54.2%.
  • 2. 2 Please note all data is based on Calendar Quarters, NOT Fiscal Quarters. Fiscal quarters provided upon request. **Our metric is reflective of stock repurchases as part of an authorized repurchase plan. We attempt to exclude share repurchases for employee incentive plans, or other purposes that are not related to returning value to shareholders. The table below represents the biggest buyers of their own stock over the last 15 calendar quarters. Dollars Repurchased Over last 15 Quarters Avg. Daily Repurchase* Apple Inc. $ 107,976,000,000.00 $ 114,260,317.46 Exxon Mobil Corp $ 53,568,000,000.00 $ 56,685,714.29 International Business Machines Corp $ 43,257,000,000.00 $ 45,774,603.17 Oracle Corp $ 36,048,000,000.00 $ 38,146,031.75 At&T Inc. $ 27,407,000,000.00 $ 29,002,116.40 American International Group Inc. $ 25,958,000,000.00 $ 27,468,783.07 Wells Fargo & Company/MN $ 25,411,000,000.00 $ 26,889,947.09 Motorola Solutions, Inc. $ 22,413,000,000.00 $ 23,717,460.32 Qualcomm Inc./DE $ 20,214,000,000.00 $ 21,390,476.19 Cisco Systems, Inc. $ 20,103,000,000.00 $ 21,273,015.87 Microsoft Corp $ 19,898,000,000.00 $ 21,056,084.66 Merck & Co., Inc. $ 19,815,000,000.00 $ 20,968,253.97 Walt Disney Co/ $ 18,924,000,000.00 $ 20,025,396.83 Goldman Sachs Group Inc. $ 18,829,000,000.00 $ 19,924,867.72 Intel Corp $ 18,756,000,000.00 $ 19,847,619.05 38.6% 37.2% 43.5% 39.3% 37.7% 50.6% 29.6% 34.8% 31.2% 29.3% 46.0% 29.9% 34.8% 30.8% 39.9% 0.0% 10.0% 20.0% 30.0% 40.0% 50.0% 60.0% Top 10 Firms Percent of Total Activity By Quarter Firm Level Buybacks *Avg. Daily Repurchase based on 63 day quarters
  • 3. 3 Please note all data is based on Calendar Quarters, NOT Fiscal Quarters. Fiscal quarters provided upon request. **Our metric is reflective of stock repurchases as part of an authorized repurchase plan. We attempt to exclude share repurchases for employee incentive plans, or other purposes that are not related to returning value to shareholders. Buyback Yields* Top 20 Firms by Quarter 0 2 4 6 8 10 12 14 16 18 20 0.0% 1.0% 2.0% 3.0% 4.0% 5.0% 6.0% 7.0% 8.0% 9.0% 10.0% 2015_Q3 2015_Q2 2015_Q1 2014_Q4 • Maximum buyback yield in Q2 at almost 9%(Express Scripts) • Median buyback yield in top 20 firms is 3.2% for all quarters. Biggest Buybacks Smallest in the top 20 (Still big though) *Total dollars bought back divided by the market capitalization of the firm.
  • 4. 4 Please note all data is based on Calendar Quarters, NOT Fiscal Quarters. Fiscal quarters provided upon request. **Our metric is reflective of stock repurchases as part of an authorized repurchase plan. We attempt to exclude share repurchases for employee incentive plans, or other purposes that are not related to returning value to shareholders. Buyback Yields For Top 10 Firms 0.0% 1.0% 2.0% 3.0% 4.0% 5.0% 6.0% 7.0% 8.0% 9.0% BedBath&BeyondInc CorningInc/NY CitrixSystemsInc DardenRestaurants Inc ParkerHannifinCorp FluorCorp L3Communications HoldingsInc StarwoodHotel& ResortsWorldwide,… HessCorp ScrippsNetworks Interactive,Inc. 2014 Fourth Quarter 0.0% 2.0% 4.0% 6.0% 8.0% 10.0% 12.0% ScrippsNetworks Interactive,Inc. NetApp,Inc. SouthernCo JuniperNetworksInc CbsCorp NavientCorp LyondellBasell IndustriesN.V. SeagateTechnology plc UnitedRentalsInc/DE AllstateCorp 2015 First Quarter 0.0% 1.0% 2.0% 3.0% 4.0% 5.0% 6.0% 7.0% 8.0% 9.0% 10.0% ExpressScripts HoldingCo. JuniperNetworksInc NetApp,Inc. NavientCorp QualcommInc/DE LowesCompaniesInc UrbanOutfittersInc MarriottInternational Inc/MD/ American InternationalGroup… MurphyOilCorp/DE 2015 Second Quarter 0.0% 1.0% 2.0% 3.0% 4.0% 5.0% 6.0% 7.0% SeagateTechnology plc XeroxCorp American InternationalGroup… MichaelKorsHoldings Ltd IntuitInc Macy's,Inc. MicrochipTechnology Inc MarriottInternational Inc/MD/ AirgasInc CorningInc/NY 2015 Third Quarter
  • 5. Try Calcbench Today! ABOUT THIS REPORT: This report was created using data analyzed via Calcbench’s Premium Suite, an online interactive platform that helps finance leaders access and analyze financial data thoroughly and efficiently. Our accessible and intuitive platform can aid in better understanding competitor financials, identifying potential risk areas, analyzing trends across industry sectors, or conducting more effective due diligence. Sign up for a 2 week free trial at www.calcbench.com/trial or contact us at us@calcbench.com or via www.calcbench.com CALCBENCH PREMIUM SUITE 5