SlideShare a Scribd company logo
1 of 2
FNC: Residential Property Values increased 4.9% year-
                 over-year in December
The latest FNC Residential Price Index™ (RPI) shows continuing
momentum in the U.S. housing market with home prices rising to a two-
year high in December. Despite an unexpected deceleration in economic
growth, the ongoing housing recovery has maintained its pace with
steady gains in home prices, sending the index up 5.4% year to date.

Contributing to this pricing recovery:
     • A stabilizing foreclosure market
            Foreclosures as a percentage of total home sales were
           17.8% in December, down from 24.0% a year ago

Based on recorded sales of non-distressed properties (existing and new
homes) in the 100 largest metropolitan areas, the FNC 100-MSA
composite index, December home prices …
     • Remained relatively unchanged from the previous month
     • Were up 4.9% on a year-over-year basis from the same period in
     2011

Half of the component markets tracked by the FNC 30-MSA composite
index show rising prices in December
      • In Baltimore, Chicago, Houston, and San Antonio, prices were
      relatively flat over the last 12 months (year-to-year change)
      • Phoenix and Denver saw a double-digit growth, led by Phoenix at
      nearly 23%
      • The Chicago market continues to underperform other major
      cities that make up the FNC 30-MSA composite index
              Home prices were up only 1.0% on a year-over-year basis,
             compared to an average of 5.0% among the nation’s largest
             cities
The graph below shows the year-over-year change for the FNC
Composite 10, 20, 30 and 100 indexes*.

The key is the indexes are now showing a year-over-year increase
indicating prices probably bottomed early in 2012.


*The FNC indexes are hedonic price indexes using a blend of sold homes and real-time appraisals.

More Related Content

Viewers also liked

Viewers also liked (18)

Uso Efectivo de Twitter para la Empresa
Uso Efectivo de Twitter para la EmpresaUso Efectivo de Twitter para la Empresa
Uso Efectivo de Twitter para la Empresa
 
Hacia la empresa 2.0
Hacia la empresa 2.0Hacia la empresa 2.0
Hacia la empresa 2.0
 
11.4
11.411.4
11.4
 
Sin título 1
Sin título 1Sin título 1
Sin título 1
 
Don't take an offence. Take a stand instead.
Don't take an offence. Take a stand instead. Don't take an offence. Take a stand instead.
Don't take an offence. Take a stand instead.
 
Simulacro, subjetividad y biopolitica
Simulacro, subjetividad y biopoliticaSimulacro, subjetividad y biopolitica
Simulacro, subjetividad y biopolitica
 
Practica 2 Paula Getino
Practica 2 Paula GetinoPractica 2 Paula Getino
Practica 2 Paula Getino
 
20 21
20 2120 21
20 21
 
John wooden sitat
John wooden sitatJohn wooden sitat
John wooden sitat
 
Ejercicio 4 espaciado 2_ nombre
Ejercicio  4 espaciado 2_ nombreEjercicio  4 espaciado 2_ nombre
Ejercicio 4 espaciado 2_ nombre
 
Verbale n1 comm 2 del 9 dicembre 2013
Verbale n1 comm 2 del 9 dicembre 2013Verbale n1 comm 2 del 9 dicembre 2013
Verbale n1 comm 2 del 9 dicembre 2013
 
Dia de la madre
Dia de la madreDia de la madre
Dia de la madre
 
Detailed analysis of a Horror trailer
Detailed analysis of a Horror trailerDetailed analysis of a Horror trailer
Detailed analysis of a Horror trailer
 
1
11
1
 
Pe dfa 2014 23 chik
Pe dfa 2014 23 chikPe dfa 2014 23 chik
Pe dfa 2014 23 chik
 
Resumen cómo hacer una buena presentación oral
Resumen cómo hacer una buena presentación oralResumen cómo hacer una buena presentación oral
Resumen cómo hacer una buena presentación oral
 
Seja nosso parceiro, adquira a sua
Seja nosso parceiro, adquira a suaSeja nosso parceiro, adquira a sua
Seja nosso parceiro, adquira a sua
 
Resumen presentaciones orales
Resumen presentaciones oralesResumen presentaciones orales
Resumen presentaciones orales
 

Similar to Fnc residential property values increased 4.9% year over-year in december

U.S. House Prices Rose 1.9 Percent in First Quarter 2013
U.S. House Prices Rose 1.9 Percent in First Quarter 2013U.S. House Prices Rose 1.9 Percent in First Quarter 2013
U.S. House Prices Rose 1.9 Percent in First Quarter 2013Wealth Partners Financial Group
 
FNB_House Price Index_January 2018
FNB_House Price Index_January 2018FNB_House Price Index_January 2018
FNB_House Price Index_January 2018Berty Van Staaden
 
Housing market assessment greater toronto area - 1 st quarter 2017
Housing market assessment   greater toronto area - 1 st quarter 2017Housing market assessment   greater toronto area - 1 st quarter 2017
Housing market assessment greater toronto area - 1 st quarter 2017Shawn Venasse
 
Economic Indicators for the Week of November 15-19, 2010
Economic Indicators for the Week of November 15-19, 2010Economic Indicators for the Week of November 15-19, 2010
Economic Indicators for the Week of November 15-19, 2010NAR Research
 
House Price Monitor: November 2011
House Price Monitor: November 2011House Price Monitor: November 2011
House Price Monitor: November 2011REALTORS
 
House Price Monitor: November 2011
House Price Monitor: November 2011House Price Monitor: November 2011
House Price Monitor: November 2011REALTORS
 
Home Price Monitor: June 2011
Home Price Monitor: June 2011Home Price Monitor: June 2011
Home Price Monitor: June 2011REALTORS
 
News Report Market Watch 06/17
News Report Market Watch 06/17News Report Market Watch 06/17
News Report Market Watch 06/17Lynda Cudney
 
Home Price Monitor: July 2011
Home Price Monitor: July 2011Home Price Monitor: July 2011
Home Price Monitor: July 2011REALTORS
 
Building Products and Materials Industry Insights - Q1 2017
Building Products and Materials Industry Insights - Q1 2017Building Products and Materials Industry Insights - Q1 2017
Building Products and Materials Industry Insights - Q1 2017Duff & Phelps
 
Building Products and Materials Industry Insights - Q3 2017
Building Products and Materials Industry Insights - Q3 2017Building Products and Materials Industry Insights - Q3 2017
Building Products and Materials Industry Insights - Q3 2017Duff & Phelps
 
TORONTO REGIONAL REAL ESTATE BOARD's JUNE 2020 MARKET WATCH REPORT
TORONTO REGIONAL REAL ESTATE BOARD's JUNE 2020 MARKET WATCH REPORTTORONTO REGIONAL REAL ESTATE BOARD's JUNE 2020 MARKET WATCH REPORT
TORONTO REGIONAL REAL ESTATE BOARD's JUNE 2020 MARKET WATCH REPORTShawn Venasse
 
Daily Economic Update, December 28, 2010
Daily Economic Update, December 28, 2010Daily Economic Update, December 28, 2010
Daily Economic Update, December 28, 2010NAR Research
 
Economic Indicators for the Week of January 18th
Economic Indicators for the Week of January 18thEconomic Indicators for the Week of January 18th
Economic Indicators for the Week of January 18thNAR Research
 

Similar to Fnc residential property values increased 4.9% year over-year in december (15)

U.S. House Prices Rose 1.9 Percent in First Quarter 2013
U.S. House Prices Rose 1.9 Percent in First Quarter 2013U.S. House Prices Rose 1.9 Percent in First Quarter 2013
U.S. House Prices Rose 1.9 Percent in First Quarter 2013
 
FNB_House Price Index_January 2018
FNB_House Price Index_January 2018FNB_House Price Index_January 2018
FNB_House Price Index_January 2018
 
Housing market assessment greater toronto area - 1 st quarter 2017
Housing market assessment   greater toronto area - 1 st quarter 2017Housing market assessment   greater toronto area - 1 st quarter 2017
Housing market assessment greater toronto area - 1 st quarter 2017
 
2516 bc
2516 bc2516 bc
2516 bc
 
Economic Indicators for the Week of November 15-19, 2010
Economic Indicators for the Week of November 15-19, 2010Economic Indicators for the Week of November 15-19, 2010
Economic Indicators for the Week of November 15-19, 2010
 
House Price Monitor: November 2011
House Price Monitor: November 2011House Price Monitor: November 2011
House Price Monitor: November 2011
 
House Price Monitor: November 2011
House Price Monitor: November 2011House Price Monitor: November 2011
House Price Monitor: November 2011
 
Home Price Monitor: June 2011
Home Price Monitor: June 2011Home Price Monitor: June 2011
Home Price Monitor: June 2011
 
News Report Market Watch 06/17
News Report Market Watch 06/17News Report Market Watch 06/17
News Report Market Watch 06/17
 
Home Price Monitor: July 2011
Home Price Monitor: July 2011Home Price Monitor: July 2011
Home Price Monitor: July 2011
 
Building Products and Materials Industry Insights - Q1 2017
Building Products and Materials Industry Insights - Q1 2017Building Products and Materials Industry Insights - Q1 2017
Building Products and Materials Industry Insights - Q1 2017
 
Building Products and Materials Industry Insights - Q3 2017
Building Products and Materials Industry Insights - Q3 2017Building Products and Materials Industry Insights - Q3 2017
Building Products and Materials Industry Insights - Q3 2017
 
TORONTO REGIONAL REAL ESTATE BOARD's JUNE 2020 MARKET WATCH REPORT
TORONTO REGIONAL REAL ESTATE BOARD's JUNE 2020 MARKET WATCH REPORTTORONTO REGIONAL REAL ESTATE BOARD's JUNE 2020 MARKET WATCH REPORT
TORONTO REGIONAL REAL ESTATE BOARD's JUNE 2020 MARKET WATCH REPORT
 
Daily Economic Update, December 28, 2010
Daily Economic Update, December 28, 2010Daily Economic Update, December 28, 2010
Daily Economic Update, December 28, 2010
 
Economic Indicators for the Week of January 18th
Economic Indicators for the Week of January 18thEconomic Indicators for the Week of January 18th
Economic Indicators for the Week of January 18th
 

More from Jameson Sotheby's International Realty

More from Jameson Sotheby's International Realty (19)

IMAGINE Magazine Distribution
IMAGINE Magazine DistributionIMAGINE Magazine Distribution
IMAGINE Magazine Distribution
 
101 West Luxury Apartments
101 West Luxury Apartments101 West Luxury Apartments
101 West Luxury Apartments
 
4 High-Return Updates for Your Home
4 High-Return Updates for Your Home4 High-Return Updates for Your Home
4 High-Return Updates for Your Home
 
Barrington, IL - Real Estate Trends
Barrington, IL - Real Estate TrendsBarrington, IL - Real Estate Trends
Barrington, IL - Real Estate Trends
 
November/December 2016 Market Pulse
November/December 2016 Market PulseNovember/December 2016 Market Pulse
November/December 2016 Market Pulse
 
2015 housing forecast
2015 housing forecast2015 housing forecast
2015 housing forecast
 
FHA's Homeownership Initiative gets Mixed Reactions
FHA's Homeownership Initiative gets Mixed ReactionsFHA's Homeownership Initiative gets Mixed Reactions
FHA's Homeownership Initiative gets Mixed Reactions
 
January 2014 Real Estate Report - Chicago Metro and NW Suburbs
January 2014 Real Estate Report - Chicago Metro and NW SuburbsJanuary 2014 Real Estate Report - Chicago Metro and NW Suburbs
January 2014 Real Estate Report - Chicago Metro and NW Suburbs
 
January Real Estate Report - Barrington Area
January Real Estate Report - Barrington AreaJanuary Real Estate Report - Barrington Area
January Real Estate Report - Barrington Area
 
Barrington Area Housing Report - November 2013
Barrington Area Housing Report - November 2013 Barrington Area Housing Report - November 2013
Barrington Area Housing Report - November 2013
 
Barrington Area Housing Report - Sept 2013
Barrington Area Housing Report - Sept 2013 Barrington Area Housing Report - Sept 2013
Barrington Area Housing Report - Sept 2013
 
August 2013 Barrington Area Market Report
August 2013 Barrington Area Market ReportAugust 2013 Barrington Area Market Report
August 2013 Barrington Area Market Report
 
July 2013 Barrington Area Market Report
July 2013 Barrington Area Market ReportJuly 2013 Barrington Area Market Report
July 2013 Barrington Area Market Report
 
June 2013 Barrington Market Report
June 2013 Barrington Market ReportJune 2013 Barrington Market Report
June 2013 Barrington Market Report
 
Real Estate Industry Facts 2012
Real Estate Industry Facts 2012Real Estate Industry Facts 2012
Real Estate Industry Facts 2012
 
What Homebuyers want in their New Home, Part 1
What Homebuyers want in their New Home, Part 1What Homebuyers want in their New Home, Part 1
What Homebuyers want in their New Home, Part 1
 
Negotiation Tips for Home Buyers
Negotiation Tips for Home BuyersNegotiation Tips for Home Buyers
Negotiation Tips for Home Buyers
 
Market Update 01/07/13
Market Update 01/07/13Market Update 01/07/13
Market Update 01/07/13
 
Real Estate Market Update for 12-17-12
Real Estate Market Update for 12-17-12Real Estate Market Update for 12-17-12
Real Estate Market Update for 12-17-12
 

Fnc residential property values increased 4.9% year over-year in december

  • 1. FNC: Residential Property Values increased 4.9% year- over-year in December The latest FNC Residential Price Index™ (RPI) shows continuing momentum in the U.S. housing market with home prices rising to a two- year high in December. Despite an unexpected deceleration in economic growth, the ongoing housing recovery has maintained its pace with steady gains in home prices, sending the index up 5.4% year to date. Contributing to this pricing recovery: • A stabilizing foreclosure market  Foreclosures as a percentage of total home sales were 17.8% in December, down from 24.0% a year ago Based on recorded sales of non-distressed properties (existing and new homes) in the 100 largest metropolitan areas, the FNC 100-MSA composite index, December home prices … • Remained relatively unchanged from the previous month • Were up 4.9% on a year-over-year basis from the same period in 2011 Half of the component markets tracked by the FNC 30-MSA composite index show rising prices in December • In Baltimore, Chicago, Houston, and San Antonio, prices were relatively flat over the last 12 months (year-to-year change) • Phoenix and Denver saw a double-digit growth, led by Phoenix at nearly 23% • The Chicago market continues to underperform other major cities that make up the FNC 30-MSA composite index  Home prices were up only 1.0% on a year-over-year basis, compared to an average of 5.0% among the nation’s largest cities
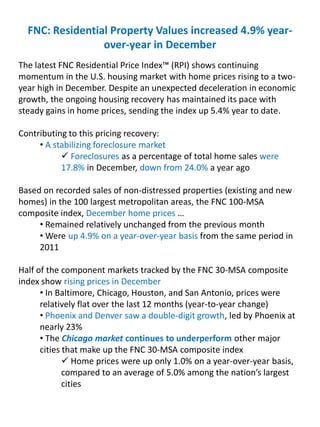
  • 2. The graph below shows the year-over-year change for the FNC Composite 10, 20, 30 and 100 indexes*. The key is the indexes are now showing a year-over-year increase indicating prices probably bottomed early in 2012. *The FNC indexes are hedonic price indexes using a blend of sold homes and real-time appraisals.